The A2667 Giant Arc at z=1.03: Evidence for Large-scale Shocks at High Redshift
Abstract
We present the spatially resolved emission line ratio properties of a 1010 M⊙ star-forming galaxy at redshift . This galaxy is gravitationally lensed as a triple-image giant arc behind the massive lensing cluster Abell 2667. The main image of the galaxy has magnification factors of 142.1 in flux and in area, yielding an intrinsic spatial resolution of 115405 pc after AO correction with OSIRIS at KECK II. The HST morphology shows a clumpy structure and the H kinematics indicates a large velocity dispersion with Vmax/ 0.73, consistent with high redshift disk galaxies of similar masses. From the [N ii]/H line ratios, we find that the central 350 parsec of the galaxy is dominated by star formation. The [N ii]/H line ratios are higher in the outer-disk than in the central regions. Most noticeably, we find a blue-shifted region of strong [N ii]/H emission in the outer disk. Applying our recent H ii region and slow-shock models, we propose that this elevated [N ii]/H ratio region is contaminated by a significant fraction of shock excitation due to galactic outflows. Our analysis suggests that shocked regions may mimic flat or inverted metallicity gradients at high redshift.
Subject headings:
galaxies: abundances — galaxies: evolution — galaxies: high-redshift — gravitational lensing: strong — ISM: jet and outflows1. Introduction
One of the most challenging aspects of current galaxy formation and evolution theory is the modeling of feedback processes associated with star-formation and/or nuclear activities. Feedback is considered to be the key solution to many observational puzzles such as the quenching of star-formation in massive galaxies (e.g., Bower et al., 2006; Dekel et al., 2009), the origin of the mass-metallicity (MZ) relation (e.g., Tremonti et al., 2004; Finlator & Davé, 2008), the enrichment of the interstellar and intergalactic medium (ISM, IGM) (e.g., Veilleux et al., 2005, and references therein), the flatter central dark matter profile than that predicted in CDM simulations (e.g., Flores & Primack, 1994; Governato et al., 2012), and the problem of the formation of bulge-less galaxies (e.g., Governato et al., 2010; Pilkington et al., 2011).
Galactic-scale winds and outflows are observed in a wide range of galaxy types that are undergoing significant star formation. Galactic-scale outflows have been frequently observed in (1) local starburst dwarf galaxies (Martin, 1999; Kirby et al., 2011; van der Wel et al., 2011), (2) local ultra-luminous infrared galaxies (ULIRGs) (Rupke et al., 2002, 2005; Martin, 2005), and (3) high-redshift sub-millimeter galaxies (SMGs) (Nesvadba et al., 2007; Alexander et al., 2010). Galactic winds are prevalent at intermediate and high redshift (Shapley et al., 2003; Nesvadba et al., 2008; Sato et al., 2009; Weiner et al., 2009; Martin & Bouché, 2009; Martin et al., 2012; Rubin et al., 2010b, 2011).
In cosmological hydrodynamical simulations, implementation of a constant wind speed and outflow mass fails to reproduce the galaxy stellar mass functions (e.g., Crain et al., 2009). A momentum-driven wind feedback model is currently favored by observations and can reproduce the stellar mass function and the observed large-scale metal enrichment (Murray et al., 2005; Oppenheimer & Davé, 2008; Finlator & Davé, 2008; Davé et al., 2011). In the momentum-drive wind model, the efficiency of the winds or mass-loading factor () scales with the declining power of the mass or circular velocity () of the galaxy (). However, whether this simple scaling relation applies to individual galaxies of a wide mass range at different redshifts remains to be tested. The physical picture of how exactly the winds interact with and recycle the energy and chemical elements to the ISM and IGM is still lacking. Indeed, Hopkins et al. (2012) have recently developed a more realistic stellar feedback model that includes a complex multi-phase structure that depends on the interaction between multiple feedback mechanisms operating on different spatial and temporal scales.
Note that past studies of gas inflows/outflows have mostly been based on slit-spectra of a small number of individual galaxies (Sato et al., 2009; Rubin et al., 2010a) or average composite spectra from stacked low signal-to-noise spectra (Weiner et al., 2009; Rubin et al., 2010b). Recent studies using KECK/LRIS data have significantly expanded the sample of individual galaxies and prevalent outflows have been confirmed for hundreds of individual galaxies at (Rubin et al., 2012; Martin et al., 2012).
To provide a more concrete observational baseline for the sophisticated feedback models such as Hopkins et al. (2012), the next leap forward is to look for wind signatures in a spatially resolved manner. Integral field spectroscopic (IFS) observations are needed to separate the various spatial components of the multi-phased ISM (Arribas et al., 2001; Rich et al., 2010, 2011). Recent surveys of wide field of view IFS on local galaxies have dramatically expanded the quantitative analysis for galactic-wide winds and shocks (Rich et al., 2010, 2011; Arribas et al., 2008; Sharp & Bland-Hawthorn, 2010).
IFS studies have found widespread shock-excitation associated with galactic outflows in massive local galaxies (Farage et al., 2010; Sharp & Bland-Hawthorn, 2010; Rich et al., 2010, 2011). Shocks are common products of winds and can also be induced by gas accretion and tidal flows in mergers (Veilleux et al., 2005; Farage et al., 2010; Genzel et al., 2011; Soto et al., 2012). Shock excitation contributes to the ionized state of the hot gas in galaxies, which also depends intimately on the chemical abundance of the ISM. To identify the location and fraction of shock excitation across an entire galaxy, it is crucial to disentangle the shock induced ionization and energy dissipation from other mechanisms.
Narrow line ratio maps can be used to probe the ionization nature of the sources (Veilleux et al., 2002; Veilleux & Rupke, 2002). Strong emission line ratios such as the BPT diagram (Baldwin et al., 1981; Veilleux & Osterbrock, 1987; Allen et al., 1998; Kewley et al., 2001b, 2006) remains one of the most practical methods to probe the ionization mechanisms at both low and high redshift. Combined with the most recent photoionization and shock models, strong line ratios such as [N ii]/H, [O iii]/H, and [S ii]/H offer a powerful tool to identify the excitation mechanisms in non-obscured regions. For example, Rich et al. (2010) showed that in NGC 839, the [N ii]/H, [O iii]/H, and [S ii]/H ratios are systematically lower near the nucleus, yet high along an outflow bi-cone. The region with high line ratios is remarkably well fitted by a shock model with slow velocities typical of galactic winds.
At high redshift, the star-formation rate (SFR) of galaxies is substantially larger than local star-forming (SF) galaxies (Noeske et al., 2007a, b; Wuyts et al., 2011; Sobral et al., 2012b), and galactic outflows are prevalent and powerful (Erb et al., 2006; Swinbank et al., 2007; Weiner et al., 2009; Rubin et al., 2010b; Alexander et al., 2010; Genzel et al., 2011). It is therefore of paramount importance to observe the masses and energies of high redshift winds to constrain the relations between the wind efficiency, SFR and galaxy masses on a broader scale.
Because of the observational challenges, outflows and super winds at high redshift have mostly been reported for LBGs, SMGs, or in quasar absorption line systems. Spatially resolved spectroscopy for high- galaxies have been limited to the very massive starburst galaxies (Cresci et al., 2010; Genzel et al., 2011). With seeing-limited observations, Cresci et al. (2010) reported three UV-selected galaxies with inverted metallicity gradients (i.e., lower metallicity in the nucleus than in the outer-disk). The inverted gradient was explained by primordial cold gas being funneled to the nucleus. These studies demonstrate the power of IFU studies in revealing the underlying physical processes of the gas accretion at high redshifts.
With the aid of magnification from gravitational lensing and adaptive optics (AO), we can begin to probe the details of fainter and less massive galaxies at high redshift (Nesvadba et al., 2008; Swinbank, 2007; Jones et al., 2010b; Sharon et al., 2012; Wuyts et al., 2012). The highly magnified multiple images in massive clusters can be magnified by more than ten, offering a rare opportunity to obtain spatially resolved observations. This technique has enabled the first high resolution measurements of metallicity gradients at high redshift (Stark et al., 2008; Jones et al., 2010a; Yuan et al., 2011).
To determine the metallicity gradient evolutions with redshift, we are undertaking a metallicity gradient survey on lensed galaxies behind galaxy clusters. Here we report observations of the arc behind the massive cluster Abell 2667. We find anomalous spatial line ratio variations indicative of large scale shocks.
Throughout this paper we use a CDM cosmology with = 70 km s-1 Mpc-1, =0.30 and =0.70. At z=1.0, 1 arcsec corresponds to 8.1 kpc and a look-back time of 9.3 Gigayear (Gyrs). We use solar oxygen abundance 12 + log(O/H)⊙=8.66 (Asplund et al., 2005).
2. Observations, Data Reduction and Analysis
2.1. Observations
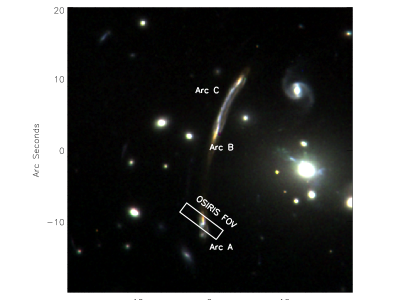
The A2667 giant arc is a three-image lensing system. Covone et al. (2006) provided the spectroscopic redshift of for the arc and the lensing models of the Abell 2667 cluster at . We observed the Abell 2667 giant arc with the OH-Suppressing Infra-Red Imaging Spectrograph (OSIRIS; Larkin et al. 2006) in natural guide star Adaptive Optics (NGSAO) mode on the KECK II telescope at = (23:51:40.023, -26:04:51.66). The observation was conducted on the night of September 20-21, 2011, using natural guide star (NGS) AO correction. The R=14 mag natural guide star was on the edge of the NGS field-of-view (FOV) of OSIRIS, restricting the positional angle (PA) to 37∘. The 100 mas pixel scale was used. Since only broad band filters were available on OSIRIS at the time, we used the Jbb filter (spectral coverage: 1.18 to 1.416, spectral resolution: R 3600, FOV 1.6 6.4), which covers the H, [N ii], and [S ii] lines. The observations were conducted in a standard ABBA dithering sequence, with the A frame centered on the target and the B frame centered on an object-free sky region 20 arcseconds North-East of the target. The same position angle was used for A and B (sky) frames. A total of 5 exposures were obtained for the target, with 900 seconds on each individual frame. The net on-target exposure time is 75 minutes. Figure 1 shows the OSIRIS FOV and locations of the A2667 arc on the HST F814W, F606W, F450W color-coded image.
Before the science target exposure, short exposures of the tip-tilt star (TT) were taken to center the IFU. An offset was applied from the TT star to the science target. The offset was determined from astrometry corrected HST images with 0.25 (i.e., 2-3 OSIRIS pixels) accuracy. Gaussian fitting to the point spread function of the TT star yields an average FWHM of 0.13. The average FWHM of the sky OH lines is measured to be 2.5 for our data and we use this value as the instrumental resolution. In the analysis below, we deconvolve the line widths with this instrument resolution by subtracting the instrumental resolution in quadrature from the best-fitting Gaussian .
2.2. Data Reduction
Individual exposures were first reduced using the OSIRIS data reduction pipeline (Larkin et al., 2006). We used the sky subtraction IDL code of Davies (2007), which we have modified to optimize the sky subtraction specifically around the wavelength region of H and [N ii]. The [S ii] lines are undetected due to strong telluric absorption. Since we are mainly concerned with the emission lines, a first order polynomial function was fit to the continuum for each spatial sample pixel (spaxel) and then the continuum was subtracted from each spaxel. The subtraction of the continuum helps to improve the removal of lenslet to lenslet variations. The final datacube was constructed by aligning the sub-exposures with the centroid of the H images and combining using a 3 mean clip to reject cosmic rays and bad lenslets. Telluric correction and flux calibration were performed by averaging three A0 standard stars (HIP220, HIP1272, HIP14719) observed immediately after the science exposure. Due to the low declination of this target, the airmass varied between 1.4 to 1.8 during the observation. The uncertainty in absolute flux calibration is estimated to be 2030%. However, the relative flux ratio of [N ii]/H is accurate to 10%.
2.3. Analysis
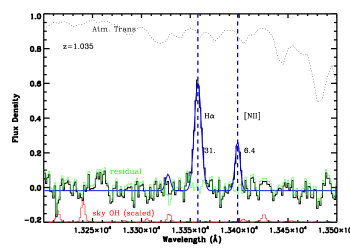
Our analysis follows the procedures outlined in Jones et al. (2010b). Gaussian profiles were fitted simultaneously to the three emission lines: [N ii]6548, 6583 and H. The centroid and velocity width of [N ii]6548, 6583 lines were constrained by the velocity width of H6563, and the ratio of [N ii]6548 and [N ii]6583 is constrained to be the theoretical value of Osterbrock (1989). We fit the line profiles using a weighted minimization procedure which takes into account the greater noise level close to atmospheric OH emission. A blank region of sky within each reduced datacube was used to determine the variance spectrum. Since the variance spectrum is dominated by sky emission, the fitted spectra were weighted by the inverse of the variance spectrum (dominated by sky counts) so that regions of strong sky lines do not cause spurious fits. Fortunately, the sky emission is weak over the H, [N ii] wavelength range for A2667 arcA (Figure 2). We compute the statistic for the best-fitting Gaussian lines and compare with that of a featureless spectrum. We first fit the spectrum for each pixel, requiring a minimum of for detection. Where this criterion is not met, we average the surrounding 33 spatial pixels to achieve higher signal to noise. No fit is made if the 33 averaging fails to produce the minimum S/N. Figure 2 shows the integrated spectrum from the image plane.
In order to check that our results are insensitive to the lensing model uncertainty, we first analyze the data on the image plane, and then repeat the analysis on the source plane. We find that the results are consistent for the image-plane and source-plane analysis. In the following sections, we will show the spectra measured on the image-plane with associated physical scales determined from the source plane.
3. Global Properties of the Giant Arc
We determined the total photometry for arc A in 7 bands from HST and Spitzer archival data: HST ACS/F814, WFPC2/F606W, WFPC2/F450W, and Spitzer IRAC 3.6, 4.5, 5.8 and 8.0m. Chandra data are also available for the cluster, but we find no X-ray detection on the giant arc. We used a fixed aperture of diameter 4 defined in the ACS/F814 band to measure the photometry. For the IRAC colors, we measured the PSF near arc A using the bright isolated stars in the field of view and convolve the ACS/F814 aperture with this PSF to calculate the aperture flux. Note that the photometric aperture covers the entire image of arc A whereas the OSIRIS FOV does not cover the tip of the southern clump C3 (Figure 1 for OSIRIS FOV; C3 is labeled on Figure 3). This southern clump only contributes to 5% to the total photometry, well below the 10% photometric measurement error. The intrinsic photometric error is dominated by the lensing magnification uncertainty (15%).
We use the software LE PHARE (Ilbert et al., 2009) to determine the stellar mass.
LE PHARE is a photometric redshift and simulation package based on
population synthesis models of Bruzual & Charlot (2003). We choose the initial mass function (IMF) by
Chabrier (2003) and the Calzetti et al. (2000) attenuation law, with E ranging from 0 to 2 and an exponentially decreasing SFR
(SFR e-t/τ) with varying between 0 and 13 Gyrs. After correcting for the flux magnification of 142.1,
the stellar mass from SED fitting is Mstar= (lensing uncertainty included),
assuming the best fit extinction value E=0.6, and SFRSED = 5035 M⊙ yr-1.
Taking E = E / 0.44 (Calzetti, 1997) and Rv=3.1, we obtain
A(H)=3.46 according to the Cardelli et al. (1989) classical extinction curve. Note that the A(H) is 2.46 higher than the median A(H) ( ) at similar masses
from the local and star forming galaxy dust extinction vs. stellar mass relation (Garn & Best, 2010; Sobral et al., 2012a).
The total H flux from our OSIRIS spectra is 6.30.2 10-16 ergs s-1 cm-2 (before correcting for lensing magnification). Applying the Kennicutt (1998) SFR prescription and after correcting for lensing magnification and extinction (A(H)=3.46), the H star formation rate is estimated to be SFRHα = 49.216.5 M⊙ yr-1. Note that the error is calculated by assuming a 15% uncertainty in lensing magnification and 30% error in H flux measurement. The error estimation excludes the uncertainty in extinction and aperture flux loss due to the coverage of the OSIRIS instrument. The physical properties of Arc A is summarized in Table 1.
4. Lensing Reconstruction, morphology and kinematics
4.1. Lens Modeling
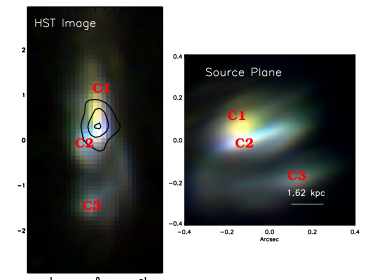
We use the best fit lensing model parameters from Covone et al. (2006); Richard et al. (2010) and use the software Lenstool111http://www.oamp.fr/cosmology/lenstool (Kneib et al., 1993; Jullo et al., 2007) to derive the geometrical transformation between image plane coordinates and source plane coordinates. The HST image and IFU datacube are reconstructed using this mapping and based on the conservation of surface brightness. The total magnification is computed by the ratio of the sizes (or equivalently, the total fluxes) between the image and its source plane reconstruction. As the magnification is not isotropic, the angular size of each image is more highly stretched along a specific axis. However, within the single image of arc A, the distortions among each pixel is identical. Figure 3 shows the reconstructed image from the HST F814W, F606W, F450W three-color image. The total flux magnification for arc A is =14.02.1, and linear magnifications in two axes are =7.01.4, and =2.00.4.
4.2. Morphology & Kinematics
The HST three-color image reveals at least three main clumps (labeled as C1, C2, C3) for arc A. These three clumps are easily identified in both the image-plane (Figure 3, Left) and source-plane (Figure 3, Right) morphology. The northern red clump (C1) could be dominated by an old stellar population. Alternatively, C1 could be heavily reddened by dust. After masking out the two blue clumps (C2, C3) on the south, a Sersic profile fit to the red component on the source plane yields a Sersic index of 0.63 0.30, and a half light radius of = 1.10.2 kpc. The blue clumps (C2, C3) are likely to be active star forming regions. The peak of the H emission is close to the largest blue clump as shown in the H contours of Figure 3. One the one hand, the asymmetric clumpy structure of A2667arc is similar to the asymmetric clumpy feature seen in disks (Genzel et al., 2006, 2011; Law et al., 2009; Lehnert et al., 2009; Förster Schreiber et al., 2009, 2011). On the other hand, the morphology could also be interpreted as a merging system. We combine the morphology with the velocity structure to further analyze the disk-versus-merger origin of the system.
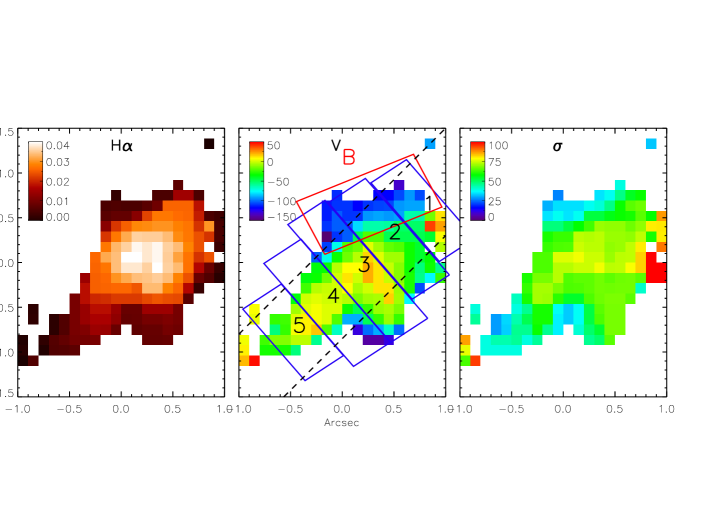
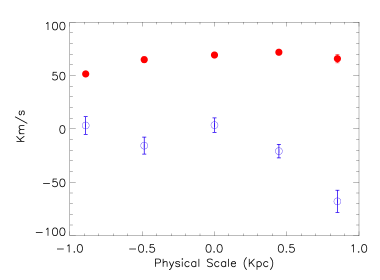
In Figure 4, we show the two-dimensional (2D) H intensity, H Gaussian fit velocity and velocity dispersion maps. In Figure 5, we extract the one-dimensional (1D) velocities and dispersions from a slit oriented along the direction of the blue and red components (black dotted lines in Figure 4, middle panel). We divide the spaxels into five bins equally along the slit direction and extract the H flux weighted spectrum for each bin. There is a small velocity gradient (75 km s-1) across a 2 kpc length. Since the shape of the 1D velocity curve is not clearly of a rotating disk, the small velocity gradient could result from either an almost face-on rotating field or a non-rotating system. The system however is clearly dominated by dispersion with /1.3, consistent with the large velocity dispersion of the high redshift turbulent disks (Lehnert et al., 2009; Förster Schreiber et al., 2009; Jones et al., 2010b).
From our morphology and velocity maps, it remains unclear whether the A2667 arc is a face-on clumpy disk or a merging system, especially considering that the H lines are not observed across the entire galaxy. Higher S/N data with better spatial coverage is required to more reliably model the velocity field.
5. Spatially Resolved Line Ratios
5.1. [N ii]6583/H as an indicator for metallicity and nonphotoionized emission
The [N ii]6583/H ratio is often used as an indicator for nebular metallicity at high redshift (up to ). The adjacency of the two lines in wavelength means the line ratio is insensitive to reddening correction and flux calibration. The calibration of Pettini & Pagel (2004) (PP04) is commonly used to convert [N ii] /H to metallicity. Using the oxygen abundance of local H ii regions, PP04 measured metallicities from the (electron temperature) method and determined the correlation between metallicity and the N2 ( log([N ii]6583/H)) values as follows:
| (1) |
Note that at high abundance, PP04 used the strong line metallicities rather than the metallicities because of the weakness of the sensitive [O iii]4363 line. Strictly speaking the PP04 relation only holds true for the range of (or [N ii] /H ). At extremely low N2 values, the calibration of N2 is difficult due to the weakness of the [N ii] line. At , the relation is nonlinear. The reason for this is, first, as the metallicity becomes larger and decreases, the production of secondary nitrogen begins to dominate and maintain a high value of N2. At even higher metallicity, the rise in metallicity cools the nebula, lowering and allowing less collisional excitations of the [N ii] lines (Kewley & Dopita, 2002). We note that the [N ii] /H ratio is particularly sensitive to non-thermal excitation. The presence of shock excitation or an AGN will increase the [N ii] /H ratio and cause abundances determined to be artificially high (Baldwin et al., 1981; Kewley & Dopita, 2002; Rich et al., 2010). For metallicity studies, it is crucial to check if the N2 values are within the regime of pure star formation.
On the other hand, if N2 surpasses the linear metallicity diagnostic range, the high N2 ratios may be a smoking gun for the presence of non-photoionization mechanisms such as shocks. For example, Veilleux & Rupke (2002) studied the [N ii] /H distribution in the local super-wind galaxy M82. They found that for [N ii] /H , additional excitation mechanisms such as shocks are needed to explain the enhanced [N ii] /H ratio. Using the most recent shock and photoionization models with IFU observations, Rich et al. (2011) showed that for the local galaxy IC 1623, shocks contribute more than 40% of the line ratio of [N ii] /H.
5.2. [N ii] /H in boxed regions
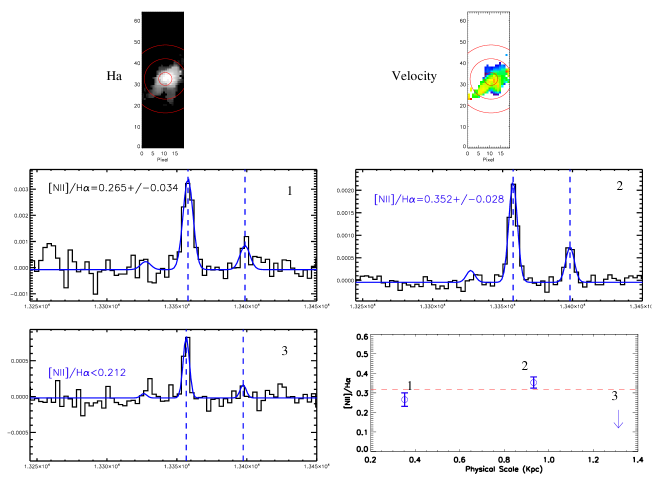
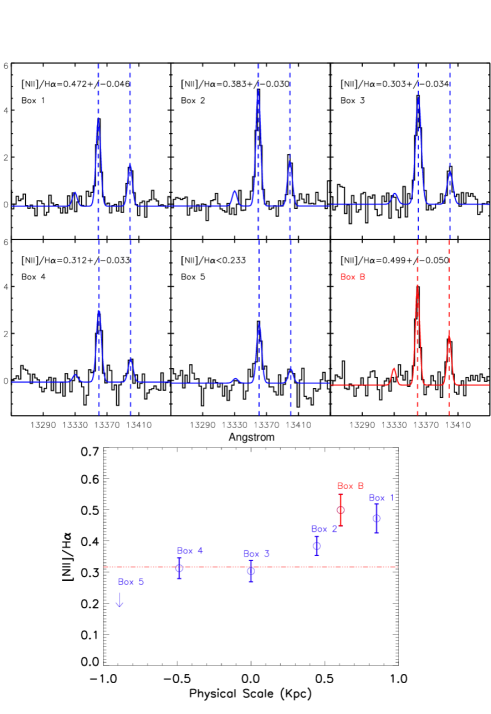
To determine the spatial variation (if any) of metallicity or ionization sources, we analyze the spatial distribution of [N ii] /H ratios. In order to enhance the S/N of the N2 line ratio map, we bin the pixels in five rectangular regions along the major axis and extract spectra for each boxed region (Figure 4). The widths of the regions are chosen in such a way that each region contains sufficient pixels to extract a reliable spectrum (i.e., S/N 3 for the [N ii] line). We derive the spectrum for each region using the H flux weighted median of all pixels in that region. We fit the [N ii] and H emission lines and obtain the errors on [N ii] / H by propagating the flux errors of [N ii] and H.
The peak of the H emission corresponds to the center of Box 3 in Figure 4. We do not find significantly enhanced [N ii] /H ratios in the central pixels and rule out AGN contamination of this target.
Our [N ii] /H emission-line ratios are shown in Figure 6. The [N ii] /H ratios of Box 3 and 4 are 0.3030.034 and 0.3120.033 respectively, close to solar values. The [N ii] /H ratios for Box 1 and 2 are 0.4720.046 and 0.3840.03 respectively, significantly higher than those of Box 3 and Box 4. We can only derive an upper limit of [N ii] /H (0.233) for Box 5. The high [N ii] /H values in the non-central regions of the galaxy indicate either extremely high metallicity or the presence of non-photoionization excitation.
We further analyze individual pixels in Box 1 and 2 and find that the [N ii] /H ratio is the highest in a sub-region highlighted as Box B in Figure 4. Very interestingly, Box B which has the highest [N ii] /H ratio ([N ii] /H =0.4990.05) has also the “bluest” velocity () with respect to the center of Box 3. Unfortunately, the data quality is not sufficient to reveal any significant variations in the velocity dispersion map. As discussed in the previous section, large [N ii] /H ratios may indicate non-photoionized emission and therefore we do not convert this ratio to metallicity. We note that the consequences of deriving metallically using [N ii] /H ratios in this case will result in the conclusion of a flat or inverted metallicity gradient (Appendix). In the next section, we discuss the possible origins of these elevated [N ii] /H ratios.
6. Discussion
The standard BPT diagrams prove to be a powerful tool for investigating the ionization sources in galaxies (Baldwin et al., 1981; Veilleux & Osterbrock, 1987; Kewley et al., 2001a; Kauffmann et al., 2003; Kewley et al., 2006). Employing IFS data on the BPT diagram has revolutionized our understanding of the power sources across entire galaxies (e.g., Rich et al., 2010, 2011, 2012; Sharp & Bland-Hawthorn, 2010). The [N ii] /H versus [O iii] /H diagram is useful for distinguishing pure star-forming regions from non-photoionized regions. The [N ii] /H ratio increases linearly with nebular metallicity until high metallicities where the log([N ii] /H) ratio saturates at -0.5 (Denicoló et al., 2002; Kewley & Dopita, 2002; Pettini & Pagel, 2004). Any non-thermal contribution will shift the [N ii] /H ratio towards higher values than this saturation level (Kewley et al., 2006; Rich et al., 2010, 2011). The log([N ii] /H) ratio of region B is 0.2 dex larger than the saturation level of , suggestive of shock ionization.
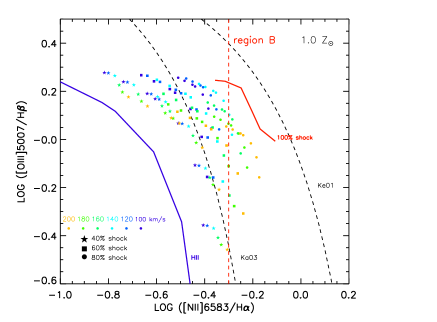
We apply a mixed grid of photoionization and shock models to quantify the potential relative contribution of shock and H ii region ionization to the [N ii] /H ratio. The H ii region models are taken from the most recent Starburst99(SB99)/Mappings III model suite (Leitherer et al., 1999; Sutherland et al., 1993). The model setup and input parameters are similar to those of Levesque et al. (2010) except that we use a slightly higher mass cut of 120 M⊙ for the Salpeter initial mass function (Salpeter 1955). We use a continuous star formation history with age 5.0 Myr and =100 cm-3. Solar metallicity was used with a range of ionization parameters log ( to ). We then mix the H ii region model with the slow-velocity shock model as described in Sutherland et al. (1993); Farage et al. (2010); Rich et al. (2010, 2011). We assume a 100% pre-ionization, with a slow shock velocity ranging from 100 to 200 km s-1, in increments 20 km s-1. These shock velocities are typical of galactic winds (Shopbell & Bland-Hawthorn, 1998; Rich et al., 2010, 2011; Sharp & Bland-Hawthorn, 2010).
Our shock and starburst models are shown in Figure 7. We show mixing lines to represent the relative contributions of starbursts and shocks from 0 to 100%. Shocks are able to produce higher [N ii]/H ratios than pure starburst models for a given metallicity. According to our models, a 20% shock contribution could increase the log([N ii]/H) value by 0.2 dex. The region B of the A2667arc has log([N ii]/H)=, lying well within the region covered by the shock models.
Shocks induced by galactic winds/outflows associated with either stellar winds, supernovae or nuclear activity are commonly observed in local galaxies (e.g., Veilleux et al., 2005; Rupke et al., 2005; Rich et al., 2010; Soto & Martin, 2012). The ubiquity of winds is even more prominent at high redshift given their violent star formation activities (e.g., Pettini et al., 2001; Swinbank et al., 2005; Sato et al., 2009; Weiner et al., 2009; Martin & Bouché, 2009; Martin et al., 2012; Rubin et al., 2010b, 2011; Alexander et al., 2010; Steidel et al., 2010). In the cold flow scenario, the turbulent disks are associated with shocks (Genzel et al., 2011). The coincidence of region B being blue-shifted with respect to the center strengthens the argument that it is an outflow shocked region.
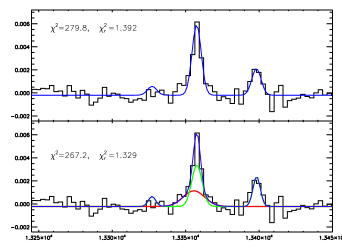
Indeed, the outflow scenario is further supported by the detection of a broad component in H. We detected a broad component in the co-added spectrum of boxes 1, 2, 4, 5. In Figure 8 we show that by including a broad component in H, the fitting to the co-add spectrum is improved by 3 in a sense. The broad component indicates a broadening wing of km s-1, with a slight blueshift of 60 km s-1 with respect to the narrow line component. The contribution of the broad wing to the total H flux of the co-added spectrum is 40%.
Because of the unknown orientation of the A2667arc system, the outflow velocity is difficult to estimate. We thus compare the outflow properties of the A2667arc with other studies using the observed linewidth . For example, NGC 1569, a local dwarf starburst galaxy, has a wind-excited broad component of km s-1 (Westmoquette et al., 2007). Arp 220, a famous local IR-luminous starburst galaxy, has a nuclear wind broadening of km s-1 (Arribas et al., 2001). For a large sample of 39 local ULRGs studied in Soto et al. (2012), the median line-width for the shocked components is km s-1 (after converting their to FWHM using FWHM= 2.3548Gaussian). The median SFR of the Soto et al. (2012) ULIRGs sample is 73 M⊙ yr-1. At very high redshift ( 2), the UV-selected massive SINS galaxies are found to have km (Shapiro et al., 2009; Genzel et al., 2011), with a median SFR of 72 M⊙ yr-1. Roughly, the broadening linewidth ( km s-1) and SFR (49.216.5 M⊙ yr-1) of A2667arc is most similar to the local ULIRGs sample of Soto et al. (2012). However, the similarity between the linewidths and SFR of the A2667arc and the SINS galaxies cannot be ruled out within 3 of the (FWHM) measurement uncertainty.
If, on the other hand, the high extra-nuclear [N ii] /H ratio regions in the A2667arc are caused by extremely high metallicity, we lack theories to explain how outer regions with super-solar metallicity would evolve spatially as a function of time. It is unclear how the A2667arc has gone through such a quick enrichment. Throughout the study we use the peak of H as the “galactic center”, which does not necessarily concur with the true galactic center. However, the choice of center would not change our main conclusion that there is a shocked region blue-shifted from the peak of H emission.
Finally, the possibility of shocks will cause an overestimation of the “true” SFR. The H flux in Regions 1 and 2 is 20% of the total H flux. Rich et al. (2010) showed that for a slow shock of 100, 50% to 70% of the H luminosity can be ascribed to shocks. Hence, 10% of the total H flux of A2667arc may result from shocks.
7. Summary
We present the OSIRIS IFU data analysis of the spatially resolved giant arc at z = 1.03 in Abell 2667. With a flux magnification of 14.02 in flux and in area, we achieved a spatial resolution of 115405 pc on the source plane. We find the A2667arc is clumpy in rest-frame UV and optical morphology, and has a high velocity dispersion Vrot / 0.73, similar to the turbulent star forming disks at z 2. The current morphology and velocity map is not sufficient to distinguish whether the A2667 arc is a face-on clumpy disk or a merger. We find that [N ii] and H ratios first rise and then fall when moving out from the galactic center defined as the peak of H flux. The central 350 pc of the H nucleus region is dominated by star-formation with metallicity 12 + log(O/H) 8.570.03 ( 0.76 ). The [N ii] /H ratios in the 350 900 pc annulus show a significantly enhanced value ( 0.1 dex higher than the nucleus). The highest [N ii] /H ratio region ( 0.2 dex higher) corresponds to a 100 blue-shifted velocity clump with respect to the nucleus. Applying the most recent slow-shock models, we propose that this elevated [N ii]/H ratio is caused by shock excitation from a galactic wind. Our results indicate that extreme caution must be used when interpreting line ratios as metallicity gradients at high redshift. Shocked extra-nuclear regions can mimic flat or inverted metallicity gradients.
References
- Alexander et al. (2010) Alexander, D. M., Swinbank, A. M., Smail, I., McDermid, R., & Nesvadba, N. P. H. 2010, MNRAS, 402, 2211
- Allen et al. (1998) Allen, M. G., Dopita, M. A., & Tsvetanov, Z. I. 1998, ApJ, 493, 571
- Arribas et al. (2001) Arribas, S., Colina, L., & Clements, D. 2001, ApJ, 560, 160
- Arribas et al. (2008) Arribas, S., Colina, L., Monreal-Ibero, A., Alfonso, J., García-Marín, M., & Alonso-Herrero, A. 2008, A&A, 479, 687
- Asplund et al. (2005) Asplund, M., Grevesse, N., & Sauval, A. J. 2005, in Astronomical Society of the Pacific Conference Series, Vol. 336, Cosmic Abundances as Records of Stellar Evolution and Nucleosynthesis, ed. T. G. Barnes III & F. N. Bash, 25–+
- Baldwin et al. (1981) Baldwin, J. A., Phillips, M. M., & Terlevich, R. 1981, PASP, 93, 5
- Bower et al. (2006) Bower, R. G., Benson, A. J., Malbon, R., Helly, J. C., Frenk, C. S., Baugh, C. M., Cole, S., & Lacey, C. G. 2006, MNRAS, 370, 645
- Bruzual & Charlot (2003) Bruzual, G., & Charlot, S. 2003, MNRAS, 344, 1000
- Calzetti (1997) Calzetti, D. 1997, in American Institute of Physics Conference Series, Vol. 408, American Institute of Physics Conference Series, ed. W. H. Waller, 403–412
- Calzetti et al. (2000) Calzetti, D., Armus, L., Bohlin, R. C., Kinney, A. L., Koornneef, J., & Storchi-Bergmann, T. 2000, ApJ, 533, 682
- Cardelli et al. (1989) Cardelli, J. A., Clayton, G. C., & Mathis, J. S. 1989, ApJ, 345, 245
- Chabrier (2003) Chabrier, G. 2003, PASP, 115, 763
- Covone et al. (2006) Covone, G., Kneib, J.-P., Soucail, G., Richard, J., Jullo, E., & Ebeling, H. 2006, A&A, 456, 409
- Crain et al. (2009) Crain, R. A., et al. 2009, MNRAS, 399, 1773
- Cresci et al. (2010) Cresci, G., Mannucci, F., Maiolino, R., Marconi, A., Gnerucci, A., & Magrini, L. 2010, Nature, 467, 811
- Davé et al. (2011) Davé, R., Finlator, K., & Oppenheimer, B. D. 2011, MNRAS, 416, 1354
- Davies (2007) Davies, R. I. 2007, MNRAS, 375, 1099
- Dekel et al. (2009) Dekel, A., Sari, R., & Ceverino, D. 2009, ApJ, 703, 785
- Denicoló et al. (2002) Denicoló, G., Terlevich, R., & Terlevich, E. 2002, MNRAS, 330, 69
- Erb et al. (2006) Erb, D. K., Steidel, C. C., Shapley, A. E., Pettini, M., Reddy, N. A., & Adelberger, K. L. 2006, ApJ, 646, 107
- Farage et al. (2010) Farage, C. L., McGregor, P. J., Dopita, M. A., & Bicknell, G. V. 2010, ApJ, 724, 267
- Finlator & Davé (2008) Finlator, K., & Davé, R. 2008, MNRAS, 385, 2181
- Flores & Primack (1994) Flores, R. A., & Primack, J. R. 1994, ApJ, 427, L1
- Förster Schreiber et al. (2009) Förster Schreiber, N. M., et al. 2009, ApJ, 706, 1364
- Förster Schreiber et al. (2011) Förster Schreiber, N. M., Shapley, A. E., Erb, D. K., Genzel, R., Steidel, C. C., Bouché, N., Cresci, G., & Davies, R. 2011, ApJ, 731, 65
- Garn & Best (2010) Garn, T., & Best, P. N. 2010, MNRAS, 409, 421
- Genzel et al. (2011) Genzel, R., et al. 2011, ApJ, 733, 101
- Genzel et al. (2006) —. 2006, Nature, 442, 786
- Governato et al. (2010) Governato, F., et al. 2010, Nature, 463, 203
- Governato et al. (2012) —. 2012, ArXiv e-prints
- Hopkins et al. (2012) Hopkins, P. F., Quataert, E., & Murray, N. 2012, MNRAS, 421, 3522
- Ilbert et al. (2009) Ilbert, O., et al. 2009, ArXiv e-prints
- Jones et al. (2010a) Jones, T., Ellis, R., Jullo, E., & Richard, J. 2010a, ApJ, 725, L176
- Jones et al. (2010b) Jones, T. A., Swinbank, A. M., Ellis, R. S., Richard, J., & Stark, D. P. 2010b, MNRAS, 404, 1247
- Jullo et al. (2007) Jullo, E., Kneib, J.-P., Limousin, M., Elíasdóttir, Á., Marshall, P. J., & Verdugo, T. 2007, New Journal of Physics, 9, 447
- Kauffmann et al. (2003) Kauffmann, G., et al. 2003, MNRAS, 346, 1055
- Kennicutt (1998) Kennicutt, Jr., R. C. 1998, ApJ, 498, 541
- Kewley & Dopita (2002) Kewley, L. J., & Dopita, M. A. 2002, ApJS, 142, 35
- Kewley et al. (2001a) Kewley, L. J., Dopita, M. A., Sutherland, R. S., Heisler, C. A., & Trevena, J. 2001a, ApJ, 556, 121
- Kewley et al. (2006) Kewley, L. J., Groves, B., Kauffmann, G., & Heckman, T. 2006, MNRAS, 372, 961
- Kewley et al. (2001b) Kewley, L. J., Heisler, C. A., Dopita, M. A., & Lumsden, S. 2001b, ApJS, 132, 37
- Kirby et al. (2011) Kirby, E. N., Martin, C. L., & Finlator, K. 2011, ApJ, 742, L25
- Kneib et al. (1993) Kneib, J. P., Mellier, Y., Fort, B., & Mathez, G. 1993, A&A, 273, 367
- Larkin et al. (2006) Larkin, J., et al. 2006, New Astronomy Reviews, 50, 362
- Law et al. (2009) Law, D. R., Steidel, C. C., Erb, D. K., Larkin, J. E., Pettini, M., Shapley, A. E., & Wright, S. A. 2009, ApJ, 697, 2057
- Lehnert et al. (2009) Lehnert, M. D., Nesvadba, N. P. H., Le Tiran, L., Di Matteo, P., van Driel, W., Douglas, L. S., Chemin, L., & Bournaud, F. 2009, ApJ, 699, 1660
- Leitherer et al. (1999) Leitherer, C., et al. 1999, ApJS, 123, 3
- Levesque et al. (2010) Levesque, E. M., Kewley, L. J., & Larson, K. L. 2010, AJ, 139, 712
- Martin (1999) Martin, C. L. 1999, ApJ, 513, 156
- Martin (2005) —. 2005, ApJ, 621, 227
- Martin & Bouché (2009) Martin, C. L., & Bouché, N. 2009, ApJ, 703, 1394
- Martin et al. (2012) Martin, C. L., Shapley, A. E., Coil, A. L., Kornei, K. A., Bundy, K., Weiner, B. J., Noeske, K. G., & Schiminovich, D. 2012, ArXiv e-prints
- Moustakas et al. (2010) Moustakas, J., Kennicutt, Jr., R. C., Tremonti, C. A., Dale, D. A., Smith, J., & Calzetti, D. 2010, ApJS, 190, 233
- Murray et al. (2005) Murray, N., Quataert, E., & Thompson, T. A. 2005, ApJ, 618, 569
- Nesvadba et al. (2008) Nesvadba, N. P. H., Lehnert, M. D., Davies, R. I., Verma, A., & Eisenhauer, F. 2008, A&A, 479, 67
- Nesvadba et al. (2007) Nesvadba, N. P. H., et al. 2007, ApJ, 657, 725
- Noeske et al. (2007a) Noeske, K. G., et al. 2007a, ApJ, 660, L47
- Noeske et al. (2007b) —. 2007b, ApJ, 660, L43
- Oppenheimer & Davé (2008) Oppenheimer, B. D., & Davé, R. 2008, MNRAS, 387, 577
- Osterbrock (1989) Osterbrock, D. E. 1989, Astrophysics of gaseous nebulae and active galactic nuclei (Research supported by the University of California, John Simon Guggenheim Memorial Foundation, University of Minnesota, et al. Mill Valley, CA, University Science Books, 1989, 422 p.)
- Pettini & Pagel (2004) Pettini, M., & Pagel, B. E. J. 2004, MNRAS, 348, L59
- Pettini et al. (2001) Pettini, M., Shapley, A. E., Steidel, C. C., Cuby, J.-G., Dickinson, M., Moorwood, A. F. M., Adelberger, K. L., & Giavalisco, M. 2001, ApJ, 554, 981
- Pilkington et al. (2011) Pilkington, K., et al. 2011, MNRAS, 417, 2891
- Queyrel et al. (2011) Queyrel, J., et al. 2011, ArXiv e-prints
- Rich et al. (2010) Rich, J. A., Dopita, M. A., Kewley, L. J., & Rupke, D. S. N. 2010, ApJ, 721, 505
- Rich et al. (2011) Rich, J. A., Kewley, L. J., & Dopita, M. A. 2011, ApJ, 734, 87
- Rich et al. (2012) Rich, J. A., Torrey, P., Kewley, L. J., Dopita, M. A., & Rupke, D. S. N. 2012, ArXiv e-prints
- Richard et al. (2010) Richard, J., et al. 2010, MNRAS, 404, 325
- Rubin et al. (2012) Rubin, K. H. R., Prochaska, J. X., Koo, D. C., & Phillips, A. C. 2012, ApJ, 747, L26
- Rubin et al. (2010a) Rubin, K. H. R., Prochaska, J. X., Koo, D. C., Phillips, A. C., & Weiner, B. J. 2010a, ApJ, 712, 574
- Rubin et al. (2011) Rubin, K. H. R., Prochaska, J. X., Ménard, B., Murray, N., Kasen, D., Koo, D. C., & Phillips, A. C. 2011, ApJ, 728, 55
- Rubin et al. (2010b) Rubin, K. H. R., Weiner, B. J., Koo, D. C., Martin, C. L., Prochaska, J. X., Coil, A. L., & Newman, J. A. 2010b, ApJ, 719, 1503
- Rupke et al. (2002) Rupke, D. S., Veilleux, S., & Sanders, D. B. 2002, ApJ, 570, 588
- Rupke et al. (2005) —. 2005, ApJ, 632, 751
- Sato et al. (2009) Sato, T., Martin, C. L., Noeske, K. G., Koo, D. C., & Lotz, J. M. 2009, ApJ, 696, 214
- Shapiro et al. (2009) Shapiro, K. L., et al. 2009, ApJ, 701, 955
- Shapley et al. (2003) Shapley, A. E., Steidel, C. C., Pettini, M., & Adelberger, K. L. 2003, ApJ, 588, 65
- Sharon et al. (2012) Sharon, K., Gladders, M. D., Rigby, J. R., Wuyts, E., Koester, B. P., Bayliss, M. B., & Barrientos, L. F. 2012, ApJ, 746, 161
- Sharp & Bland-Hawthorn (2010) Sharp, R. G., & Bland-Hawthorn, J. 2010, ApJ, 711, 818
- Shopbell & Bland-Hawthorn (1998) Shopbell, P. L., & Bland-Hawthorn, J. 1998, ApJ, 493, 129
- Sobral et al. (2012a) Sobral, D., Best, P. N., Matsuda, Y., Smail, I., Geach, J. E., & Cirasuolo, M. 2012a, MNRAS, 420, 1926
- Sobral et al. (2012b) Sobral, D., Smail, I., Best, P. N., Geach, J. E., Matsuda, Y., Stott, J. P., Cirasuolo, M., & Kurk, J. 2012b, ArXiv e-prints
- Soto & Martin (2012) Soto, K. T., & Martin, C. L. 2012, ArXiv e-prints
- Soto et al. (2012) Soto, K. T., Martin, C. L., Prescott, M. K. M., & Armus, L. 2012, ArXiv e-prints
- Stark et al. (2008) Stark, D. P., Swinbank, A. M., Ellis, R. S., Dye, S., Smail, I. R., & Richard, J. 2008, Nature, 455, 775
- Steidel et al. (2010) Steidel, C. C., Erb, D. K., Shapley, A. E., Pettini, M., Reddy, N., Bogosavljević, M., Rudie, G. C., & Rakic, O. 2010, ApJ, 717, 289
- Sutherland et al. (1993) Sutherland, R. S., Bicknell, G. V., & Dopita, M. A. 1993, ApJ, 414, 510
- Swinbank et al. (2007) Swinbank, A. M., Bower, R. G., Smith, G. P., Wilman, R. J., Smail, I., Ellis, R. S., Morris, S. L., & Kneib, J.-P. 2007, MNRAS, 376, 479
- Swinbank et al. (2005) Swinbank, A. M., et al. 2005, MNRAS, 359, 401
- Swinbank (2007) Swinbank, M. 2007, in Astronomical Society of the Pacific Conference Series, Vol. 379, Cosmic Frontiers, ed. N. Metcalfe & T. Shanks, 226
- Tremonti et al. (2004) Tremonti, C. A., et al. 2004, ApJ, 613, 898
- van der Wel et al. (2011) van der Wel, A., et al. 2011, ApJ, 742, 111
- Veilleux et al. (2005) Veilleux, S., Cecil, G., & Bland-Hawthorn, J. 2005, ARA&A, 43, 769
- Veilleux et al. (2002) Veilleux, S., Kim, D.-C., & Sanders, D. B. 2002, ApJS, 143, 315
- Veilleux & Osterbrock (1987) Veilleux, S., & Osterbrock, D. E. 1987, ApJS, 63, 295
- Veilleux & Rupke (2002) Veilleux, S., & Rupke, D. S. 2002, ApJ, 565, L63
- Weiner et al. (2009) Weiner, B. J., et al. 2009, ApJ, 692, 187
- Westmoquette et al. (2007) Westmoquette, M. S., Exter, K. M., Smith, L. J., & Gallagher, J. S. 2007, MNRAS, 381, 894
- Wuyts et al. (2012) Wuyts, E., Rigby, J. R., Gladders, M. D., Gilbank, D. G., Sharon, K., Gralla, M. B., & Bayliss, M. B. 2012, ApJ, 745, 86
- Wuyts et al. (2011) Wuyts, S., et al. 2011, ApJ, 742, 96
- Yuan et al. (2011) Yuan, T.-T., Kewley, L. J., Swinbank, A. M., Richard, J., & Livermore, R. C. 2011, ApJ, 732, L14+
Table 1.
Derived Global Physical Properties for Arc A
| Re | SFRHα | 12 + log(O/H) | , , | ||||
| kpc | SED fit | Integrated | flux, axis1, axis2 | ||||
| 1.10.2 | 0.6 | 49.216.5 | 1.90 | 656 | 4812 | 8.6060.051 | 142.1, 2.00.4,7.01.4 |
Appendix A [N ii] /H as a function of radius
In metallicity gradient studies, averaging spectra in annular regions is a common exercise (Moustakas et al., 2010; Queyrel et al., 2011; Yuan et al., 2011). To relate to these studies, we extract spectra in 3 annuli centered on the H peak (Figure 9). Each spectrum is calculated as the H flux weighted median of all pixels within the annulus. From Section 5.2, we see that the line ratio map is not symmetric with respect to the center. Averaging spectra in annuli smooths out the lateral spatial variance, resulting in noisier [N ii] lines. The choice of the annuli is such that the integrated spectra gives S/N 5 for the [N ii] lines. The physical lengths of the three outer radii of the annuli in the source plane are 0.35, 0.93, and 1.31 kpc respectively. The [N ii] line is robustly detected at S/N 5 for the inner two annuli and is a 3 detection for the outer annulus.
The [N ii] /H ratios are larger in the circum-nuclear region (350930 pc) than in the nucleus (350pc). Small [N ii] /H ratios are seen in the outer annulus (9301.3 kpc). If the [N ii] /H ratios arise purely from H ii regions, these [N ii] /H ratios could translate into a flat or inverted metallicity gradient similar to those in several high redshift studies such as Cresci et al. (2010); Queyrel et al. (2011).
However, in A2667arc, these enhanced circum-nuclear [N ii] /H ratios are remarkably similar to the LINER-like luminous infrared galaxies reported in Rich et al. (2010, 2011). Rich et al. observed that enhanced extra-nuclear [N ii] /H ratios in late-stage galaxy mergers are driven by slow shock emission (100200 km s-1) associated with galactic-wide winds or gas collisions due to mergers. Rich et al. (2010, 2011) showed that both velocity dispersions and the strong line ratios independently indicate shock excitation in the extra-nuclear regions. Slow shock models confirm this conclusion, yielding remarkable agreement with the enhanced emission-like ratios.