Microscopic picture of aging in SiO2
Abstract
We investigate the aging dynamics of amorphous SiO2 via molecular dynamics simulations of a quench from a high temperature to a lower temperature . We obtain a microscopic picture of aging dynamics by analyzing single particle trajectories, identifying jump events when a particle escapes the cage formed by its neighbors, and by determining how these jumps depend on the waiting time , the time elapsed since the temperature quench to . We find that the only -dependent microscopic quantity is the number of jumping particles per unit time, which decreases with age. Similar to previous studies for fragile glass formers, we show here for the strong glass former SiO2 that neither the distribution of jump lengths nor the distribution of times spent in the cage are -dependent. We conclude that the microscopic aging dynamics is surprisingly similar for fragile and strong glass formers.
pacs:
61.20.Lc, 51.20.+d, 45.70.-n, 47.57.Gcpacs:
61.20.Lc, 61.20.Ja, 64.70.ph, 61.43.FsIf a system is quenched from a high temperature
to a lower temperature below the glass transition,
crystallization is avoided and
a glass is formed. The resulting out of equilibrium
(aging) dynamics has been hotly debated for the last decades and
remains unclear Binder and Kob (2005); Berthier and Biroli (2011).
Most previous studies on the aging dynamics investigated
quantities which are averages over all particles in the
system, such as
mean squared displacement, incoherent
intermediate scattering function,
dynamic susceptibility,
and energy
Colin et al. (2011); Heuer (2008); ElMasri et al. (2010); Parsaeian and Castillo (2009); Rehwald et al. (2010); Vollmayr-Lee et al. (2010); Warren and Rottler (2008).
On the other hand much less is known about single particle
dynamics
during aging.
For colloids, Cianci et al. investigated the structure
Cianci et al. (2006a, b)
and Yunker et al. Yunker et al. (2009)
focused on irreversible rearrangements
as function of waiting time .
Warren and Rottler used computer simulations to
investigate single particle hopping events for a
binary Lennard-Jones mixture without shear as well as for
polymers with and without shear
Warren and Rottler (2009); Warren and
Rottler (2010a, b).
To gain a more complete picture of the microscopic processes during aging,
we study single particle hopping (jump) events
for the very different glass former SiO2.
Whereas the systems of Warren and Rottler are fragile glass
formers, SiO2 belongs to the class of strong glass
formers Binder and Kob (2005).
We determine the number of jumping particles per unit time,
the jump length, and the time spent in a cage
for a wide range of waiting times and
for several choices of and .
To study the aging dynamics of amorphous silica we
carried out molecular dynamics (MD) simulations using the
BKS potential van Beest et al. (1990) for the particle interactions.
Starting from 20 independent
fully equilibrated configurations at high temperatures K K}, the system is quenched instantaneously
to lower
temperatures K, K, K, K.
To keep the temperature at constant and
to disturb the dynamics minimally,
the Nosé-Hoover thermostat was applied only
for the first ns (NVT), and the simulation was continued
in the NVE ensemble for ns during which stayed
constant. For more information on details of the simulation see Vollmayr-Lee et al. (2010).
We focus on the microscopic dynamics at the lower temperature by analyzing the single particle trajectories . During the production runs at we stored average positions and fluctuations for each particle at times ns. Here correspond to averages over 3200 MD steps and 2000 MD steps for the NVT and NVE simulation runs respectively. We then use the resulting to identify jump events. For example Fig. 1 shows the y-component of for ; rectangular boxes indicate identified jumps. We define a particle to undergo a jump if its change in average position
| (1) |
satisfies
| (2) |
where is the average fluctuation size for particle type . Since is intended to be a measure of average fluctuations during each particles rattling within its cage of neighbors, we first determine the estimate by averaging over all times of a given simulation run at and over all particles of the same type . We then determine by redoing the average over , but by averaging only over times for which which roughly excludes jumps from the average. Note that the definition of Eq. (2) is similar, but not identical to our analysis in Vollmayr-Lee (2004); Vollmayr-Lee and Baker (2006). To verify that our results are independent of the details of the jump definition, we replaced Eq. (2) with and found indeed qualitatively the same results as they are presented here, for which we used Eq. (2).
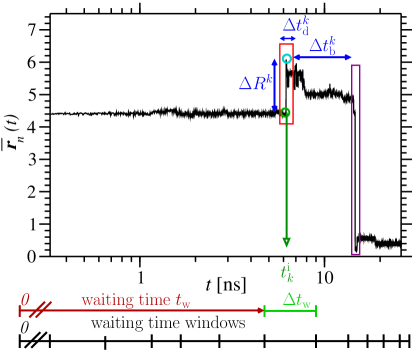
We thus identify for all simulation runs all jump events occurring during the production run at . For each jump event we determine the particle jumping from average position at time to average position at time (see in Fig. 1 dark green and cyan circles).
Our focus is on the dynamics of the system as it is aging over time. We investigate it via the jump events and their dependence on the waiting time , i.e. the time elapsed since the temperature quench to . We divide the simulation run into waiting time windows, as indicated in Fig. 1 111In simulation time units ( ns) we used the borders for for for .. For each jump event with jump time we determine the waiting time window which includes (in Fig. 1 the light green waiting time window) and assign to this waiting time window the waiting time of the left border of the selected time window (in Fig. 1 red arrow).
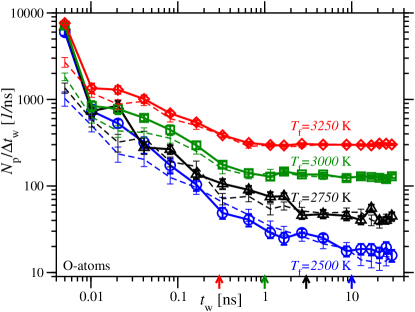
We therefore obtain jump statistics for each waiting time window starting at time and of duration (see Fig. 1). In Fig. 2 we show the number of distinct particles jumping per observation time as function of waiting time 222To avoid that all particles jump, we choose a small enough window. For the case of ns we therefore divide the waiting time window into subwindows of size ns and average over .. We find for all investigated and both a clear -dependence. With increasing waiting time decreases following roughly a power law until equilibrium is reached and becomes independent of and . The power law exponents are approximately the same for O- and Si-atoms in the range nsns. As one might expect, the larger the more particles jump and the earlier the equilibrium time , i.e. the time when levels off. For comparison we include in Fig. 2 the equilibrium times determined via the intermediate incoherent scattering function ( in Vollmayr-Lee et al. (2010)). We find , i.e. agreement between the microscopic equilibrium time (single particle jumps) and the macroscopic equilibrium ( includes a particle average).
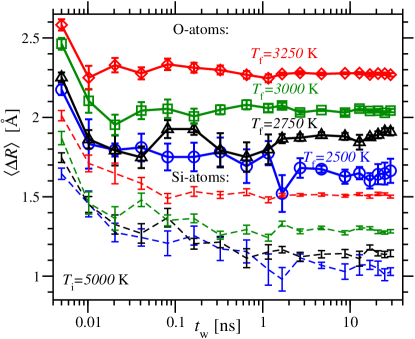
Next we test whether the -dependence manifests itself also in a microscopic length scale. As sketched in Fig. 1, we define the jump length of event of particle jumping at time from to to be
| (3) |
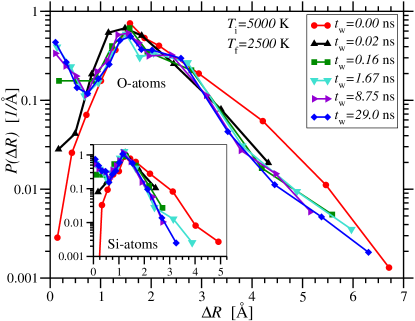
Similar to above, we investigate the -dependence of by including in the average only events for which belong to the same waiting time window. The resulting Fig. 3 shows that for oxygen atoms (solid thick lines with symbols) is independent of (with the only exception of the first time-window), and for silicon atoms (dashed thin lines) is only slightly -dependent. This is in stark contrast to of Fig. 2, which shows strong -dependence. The -independence of holds true even for the distribution , both for O- and for Si-atoms, as shown in Fig. 4 for the case of K, K. We find similar results for all other investigated and . Consistent with Fig. 3, we find only -dependence for ns (which corresponds in an experiment to the undetectable instant of an infinitely fast quench). For an additional peak occurs at which is mostly due to reversible jumps (as defined in Vollmayr-Lee (2004)). Furthermore we find exponential tails with and for O- and Si-atoms respectively (similar to the results for a binary Lennard Jones mixture Warren and Rottler (2009)).
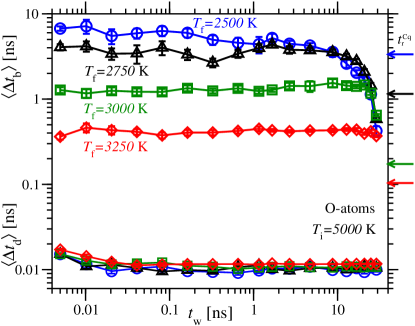
With the conclusion from Figs. 3 and 4 that the length scale is -independent, we investigate next the time scales associated with the single particle jumps. We define the duration of a jump event to be
| (4) |
(see Fig. 1) and the time between successive jumps of the same particle
| (5) |
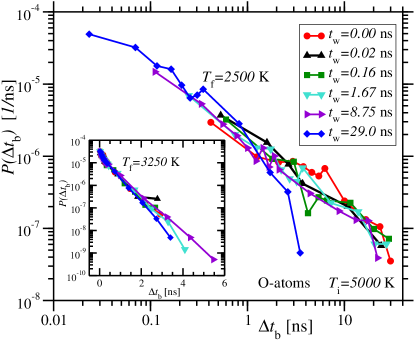
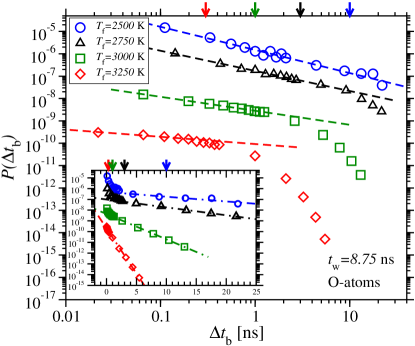
that means the time spent in the cage before the same particle jumps again (see Fig. 1). The resulting and are shown in Fig. 5. The time between jumps is several magnitudes larger than . For comparison with we include arrows on the right to indicate ns of Vollmayr-Lee et al. (2010), which is defined to be the time for which . Since , we conclude that is characterizing -relaxation. As above, we determined the -dependence by averaging and for all jump events for which belongs to the same waiting time window. By choosing this definition of we prevent artifacts due to the different time window sizes, because only (instead of ) is required to be in the time window of consideration. For large , however, the finite simulation run time ns, causes to decrease for waiting times . Ignoring this -specific decrease, we therefore obtain the surprising result that is independent of . This independence of holds not only for the average , but even for the whole distribution , as shown in Fig. 6. Also in Fig. 6 we notice that at K, whereas at K. In Fig. 7 we show how plotted versus changes with the final temperature, for a fixed ns. We observe that at intermediate temperatures, i.e. K and K, there is a crossover from power law to exponential decay. For comparison we include in Fig. 7 the same arrows as in Fig. 2, which indicate the equilibrium times . The crossover time occurs approximately at the same time when and reach equilibrium. A similar crossover has been observed for kinetically constrained models (see Fig. 10 of Jung et al. (2005)) and for a binary Lennard-Jones mixture (see Fig. 2 of Doliwa and Heuer (2003)).
In summary, we obtain the following microscopic picture of aging: both the distribution of jump length and the distribution of times spent in the cage are independent of waiting time (similar to the results of Warren and Rottler Warren and Rottler (2009); Warren and Rottler (2010a, b)). Instead the only -dependent microscopic quantity is the number of jumping particles per time, which decreases with increasing (similar to the results of Yunker et al. Yunker et al. (2009)). This is consistent with the first hop time results reported in Warren and Rottler (2009); Warren and Rottler (2010a, b). In agreement with kinetically constrained models shows a crossover from power law to exponential decay Jung et al. (2005). Our results for the strong glass former SiO2 are surprisingly similar to the fragile glass former results Warren and Rottler (2009); Warren and Rottler (2010a, b).
Acknowledgements.
RB and LMC were supported by NSF REU grants PHY-0552790 and REU-0997424. We thank A. Zippelius and H.E. Castillo for comments on an earlier version of this manuscript. KVL thanks A. Zippelius and the Institute of Theoretical Physics, University of Göttingen, for hospitality and financial support via the SFB 602.References
- Binder and Kob (2005) K. Binder and W. Kob, Glassy Materials and Disordered Solids – An Introduction to Their Statistical Mechanics (World Scientific, Singapore, 2005).
- Berthier and Biroli (2011) L. Berthier and G. Biroli, Rev. Mod. Phys. 83, 587 (2011).
- Colin et al. (2011) R. Colin, A. M. Alsayed, J.-C. Castaing, R. Goyal, L. Hough, and B. Abou, Soft Matter 7, 4504 (2011).
- Heuer (2008) A. Heuer, J. Phys.: Condens. Matter 20, 373101 (2008).
- ElMasri et al. (2010) D. ElMasri, L. Berthier, and L. Cipelletti, Phys. Rev. E 82, 031503 (2010).
- Parsaeian and Castillo (2009) A. Parsaeian and H. E. Castillo, Phys. Rev. Lett. 102, 055704 (2009).
- Rehwald et al. (2010) C. Rehwald, N. Gnan, A. Heuer, T. Schrder, J. C. Dyre, and G. Diezemann, Phys. Rev. E 82, 021503 (2010).
- Vollmayr-Lee et al. (2010) K. Vollmayr-Lee, J. A. Roman, and J. Horbach, Phys. Rev. E 81, 061203 (2010).
- Warren and Rottler (2008) M. Warren and J. Rottler, Phys. Rev. E 78, 041502 (2008).
- Cianci et al. (2006a) G. C. Cianci, R. E. Courtland, and E. R. Weeks, Solid State Commun. 139, 599 (2006a).
- Cianci et al. (2006b) G. C. Cianci, R. E. Courtland, and E. R. Weeks, AIP Conf. Proc. 832, 21 (2006b).
- Yunker et al. (2009) P. Yunker, Z. Zhang, K. B. Aptowicz, and A. G. Yodh, Phys. Rev. Lett. 103, 115701 (2009).
- Warren and Rottler (2009) M. Warren and J. Rottler, Europhys. Lett. 88, 58005 (2009).
- Warren and Rottler (2010a) M. Warren and J. Rottler, Phys. Rev. Lett. 104, 205501 (2010a).
- Warren and Rottler (2010b) M. Warren and J. Rottler, J. Chem. Phys. 133, 164513 (2010b).
- van Beest et al. (1990) B. W. H. van Beest, G. J. Kramer, and R. A. van Santen, Phys. Rev. Lett. 64, 1955 (1990).
- Vollmayr-Lee (2004) K. Vollmayr-Lee, J. Chem. Phys. 121, 4781 (2004).
- Vollmayr-Lee and Baker (2006) K. Vollmayr-Lee and E. A. Baker, Europhys. Lett. 76, 1130 (2006).
- Jung et al. (2005) Y. Jung, J. P. Garrahan, and D. Chandler, J. Chem. Phys. 123, 084509 (2005).
- Doliwa and Heuer (2003) B. Doliwa and A. Heuer, Phys. Rev. Lett. 91, 235501 (2003).