Prominent effect of soil network heterogeneity on microbial invasion
Abstract
Using a network representation for real soil samples and mathematical models for microbial spread, we show that the structural heterogeneity of the soil habitat may have a very significant influence on the size of microbial invasions of the soil pore space. In particular, neglecting the soil structural heterogeneity may lead to a substantial underestimation of microbial invasion. Such effects are explained in terms of a crucial interplay between heterogeneity in microbial spread and heterogeneity in the topology of soil networks. The main influence of network topology on invasion is linked to the existence of long channels in soil networks that may act as bridges for transmission of microorganisms between distant parts of soil.
Understanding how the ubiquitous structural heterogeneity of natural habitats affects the movement and spatial distribution of biota is an important and fascinating question relevant to several disciplines Turner et al. (2001); Viswanathan et al. (2011). In particular, the soil pore space is a highly heterogeneous habitat hosting a stunning wealth of biological activity (e.g. of bacteria, fungi or nematodes Lavelle and Spain (2001); Copley (2000); Young and Crawford (2004)) that plays an essential role in many processes including plant growth Kiers et al. (2011), climate change B. K. Singh and Reay (2010), or soil-borne epidemics Otten and Gilligan (2006). The study of the interplay between soil structural heterogeneity and microbial activities in three dimensions (3D) is challenging due to the opacity of soil and the complexity of biological and environmental factors involved in microbial spread. Experiments based on soil thin sections Franklin and Mills (2007); Otten and Gilligan (1998); Nunan et al. (2002); Harris et al. (2003); Otten et al. (2004) or planar microcosms Hapca et al. (2009); Dechesne et al. (2010); Franklin and Mills (2007) give some insight. For instance, it was observed that the volume of soil explored by fungi increases with the soil bulk density Harris et al. (2003) and macropores may act as either preferential pathways or barriers for fungal spread Otten et al. (2004). However, due to the nature of the techniques, these type of experiments fail to provide information in 3D so as to quantitatively assess the influence of the structural heterogeneity and topology on microbial invasion. Current understanding based on ecological and epidemiological models suggests that heterogeneity in soil structure could either enhance or reduce the probabilities of invasions Melbourne et al. (2007); Neri et al. (2011); Newman (2002); Miller (2007). The outcome depends largely on the properties of the pore space, including the connectivity and pore sizes, and the effects these properties have on microbial movement through soil. In this letter, we identify the main structural factors that affect invasion by devising several network models for biological invasion with increasing degree of interplay between microbial spread and the structure of the soil pore space (Table 1). Our results and conclusions are not only relevant to biological invasion in soil but are also expected to be important for any biota moving in complex landscapes or generic agents spreading in networks with structurally complex links.
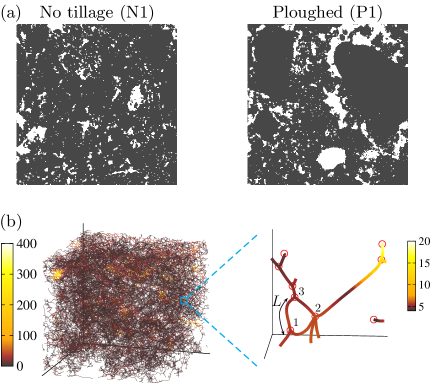
We have analysed the invasion models for six real soil samples: three samples of soil without tillage treatment (denoted as N1, N2, and N3) and three samples of ploughed soil (P1, P2, and P3). The main qualitative difference between N and P samples is that the pores are typically larger in the P samples (see Fig. 1(a) and the statistical analysis in Sup ). For our theoretical analysis, we have used a network representation of the soil pore structure derived from 3D-digital images of the soil samples scanned with an X-ray micro-tomography device Sup . Soil networks consist of a set of nodes and edges whose layout captures the topology of the soil pore space where biological activity takes place. The network representation is achieved by associating the branching points of the soil pore space with the nodes and the pore-space channels between branching points with the network edges (see Sup for more detail and a comparison with previously proposed network representations for soil Vogel and Roth (1998, 2001); Santiago et al. (2008); Cárdenas et al. (2010)). Fig. 1(b) shows the network for sample N1. All the networks have similar topological properties irrespective of tillage treatment (Table 2). The samples exhibit limited node degree, small topological heterogeneity, high clustering in comparison with random graphs, and fractal small-world behaviour (i.e. the mean separation between nodes increases as with , which contrasts with the slower increase in standard small-wold networks Csányi and Szendrői (2004)). Such features are typical for geographical networks embedded in Euclidean spaces Boccaletti et al. (2006); Buhl et al. (2004) and are thus not un-expected for soil networks that are embedded in a 3D space. The connectivity in this kind of networks is limited because each edge fills a certain space and thus the number of edges per node is restricted Boccaletti et al. (2006); Buhl et al. (2004); Sup . This property remains unaltered under tillage and this is likely to be the reason why the topologies are statistically similar for both N and P samples. We describe the structure of channels in terms of their arc-length, , and local cross-section area (Fig. 1). Both the mean value and the relative dispersion of the arc-length are similar for all the samples (Table 2). A relatively weak heterogeneity in , i.e. , contrasts with much greater variability in the cross-section area along channels, i.e. . Large cross-sections are typical for long channels which are frequently attached to nodes with large . Spatial correlations of are significant (i.e. narrow channels tend to be attached to narrow channels and vice-versa) Sup . Here, we show that the heterogeneity in , the correlations between and and spatial correlations for play a key role for microbial invasion.
| Model | Heterogeneity | Parameters | Transmissibility |
|---|---|---|---|
| 1 | None | ||
| 2 | Non-structural | ||
| 3 | |||
| 4 |
| Sample | Topological characteristics | Channel properties | ||||||||
| N1 | 49709 | 69563 | 2.80 | 0.165 | 763.7 | 73.05 | 6.47 | 0.362 | 12.03 | 2.51 |
| N2 | 58618 | 82949 | 2.83 | 0.180 | 1000.4 | 74.67 | 5.94 | 0.348 | 11.53 | 6.66 |
| N3 | 54083 | 76747 | 2.84 | 0.165 | 848.0 | 64.26 | 6.53 | 0.382 | 22.80 | 30.60 |
| P1 | 33526 | 45544 | 2.72 | 0.162 | 488.2 | 69.61 | 6.85 | 0.401 | 19.18 | 3.23 |
| P2 | 47388 | 66147 | 2.79 | 0.156 | 667.6 | 66.65 | 6.67 | 0.366 | 17.33 | 5.27 |
| P3 | 27042 | 36125 | 2.67 | 0.165 | 368.3 | 70.73 | 7.15 | 0.450 | 21.31 | 4.00 |
The spread of micro-organisms through a given pore space in soil is not a deterministic process but it occurs with certain probability Otten and Gilligan (2006); Franklin and Mills (2007). Inspired by epidemiological network models Grassberger (1983); Newman (2002); Miller (2007); Neri et al. (2011); Pérez-Reche et al. (2011); Vespignani (2012), we assume that microorganisms reaching a node in the soil network are able to colonise any of the channels that emerge from that node and to reach uncolonised nodes with probability (referred to as the transmissibility). This quantity is central for all the models proposed in this work. Each model assumes a different form for (Table 1). Model 1 corresponds to the simplest mean-field case with being identical for all the channels. In model 2, is independent of the structural properties of channels but it takes a random value for each channel (representing, e.g. a non-uniform spatial distribution of nutrient resources necessary for microbial activity Ettema and Warde (2002)) that obeys a bi-modal distribution parameterised by the mean transmissibility, . Model 3 suggests that depends on the arc-length of channels () and the spatial scale of microbial colonisation is characterised by a typical exploration length, . The value of transmissibility is assumed to decay with increasing , meaning that microbial transmission through short channels is more likely than through longer channels. In Model 4, depends on both and the cross-section area along channels, . The dependence on is again controlled by the parameter . Regarding , we keep our description general so as to account both for microorganisms with preferential spread through pores with wide cross-sections and those that have a preference for narrow cross-sections. This preference may depend on a combination of biological and physical factors such as competitive exclusion from pore-size classes due to predator-prey interactions Turner et al. (2001); Melbourne et al. (2007); Lavelle and Spain (2001), or the spatial distribution of water in soil Otten and Gilligan (1998); Lavelle and Spain (2001); Franklin and Mills (2007); Dechesne et al. (2010). We capture these factors qualitatively with an effective area exploration parameter, , whose sign controls the preference for narrow () or wide () cross-sections. For , model 4 reduces to model 3 (cf. expressions for in Table 1).
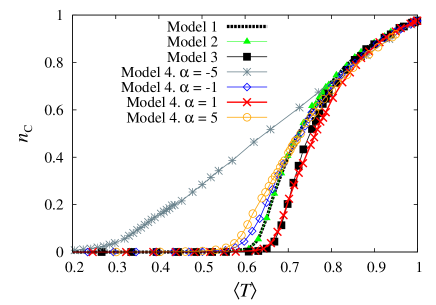
We quantify the size of invasion by the density of colonisation, , defined as the relative number of nodes reached by the microbial colony during an invasion that starts from a randomly chosen node in the network. Numerical simulations reveal that the mean value of predicted by model 1 increases with but only takes significantly large values (e.g. ) if , where for all the analysed networks (Fig. 2 and Sup ). Similar threshold behaviour for invasion is typically observed in some epidemiological models Grassberger (1983); Newman (2002); Miller (2007); Neri et al. (2011); Pérez-Reche et al. (2011); Vespignani (2012). The heterogeneity in considered in model 2 does not introduce significant differences to which coincides with that for model 1 if the strength of microbial transmission is parametrised by in both models. This result holds in general if the values of for all the channels in the network are statistically independent from each other Sander et al. (2002); Pérez-Reche et al. (2010). For given , model 3 predicts colonisations of smaller size on average than that for model 1 (the colonisation curve for model 3 is clearly below the curve for model 1 in Fig. 2). Therefore, heterogeneity in induced by heterogeneity in makes the soil network more resilient to microbial invasion Perez-Reche et al. (2009). Model 4 predicts a similar behaviour for values of near zero which is expected since models 4 and 3 coincide for (see, e.g. the invasion curve for in Fig. 2). In contrast, for larger values of the area exploration parameter (either or ), invasions for given can be more significant in model 4 than in any of the other models. The effect is especially pronounced for large negative (compare, e.g. the curve for with that for homogeneous in Fig. 2). This is a clear illustration of the prominent effect of the strong heterogeneity in cross-sections of soil channels on biological invasion.
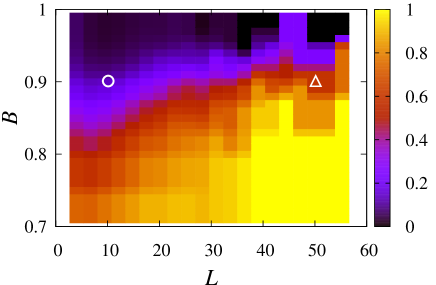
The above results can be understood in terms of the intuitive idea that some channels act as bridges that link nodes that would otherwise be further apart or disconnected. Accordingly, if some microorganisms are able to colonise channels with high “bridging-effects”, the resulting invasions should be large. This behaviour is reminiscent of the small-world effect Watts and Strogatz (1998); Sander et al. (2002) and is related to the fractal small-world property of soil networks Csányi and Szendrői (2004). In order to quantify the bridge effect for every pair, , of connected nodes we measure the range of the edge Motter et al. (2002) which gives the number of links, , along the shortest path from to , if the edge linking these two nodes is removed and define the bridgeness, , as . Channels with close to unity indicate the presence of bridges for transmission because the shortest alternative path has a large number of steps, . Fig. 3 shows that is heterogeneous but is correlated with the channel length, typically taking larger values for channels with long arc-length. This effect is ultimately responsible for the variations between invasion curves in Fig. 2 for different models.
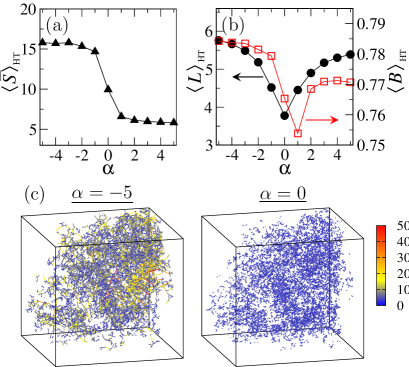
In models 1 and 2 for invasion, is not linked to the structural properties of channels and is thus independent of . In contrast, model 3 assumes that decays monotonically with meaning that microorganisms are more likely to be transmitted through short channels which typically have small (rather than through channels of any length as in models 1 and 2). This explains why the typical size of invasions for given is smaller in model 3 than predicted by models 1 and 2. In contrast, the transmissibility in model 4 depends on (provided ) and does not decay monotonically with as in model 3 (see Sec. VI in Sup ). As a result, some long channels with high degrees of bridging are able to transmit microbes more efficiently than other with smaller and . Fig. 4 illustrates this idea for microbial invasion with given by showing that the cross-section area of highly transmissible channels with decreases with (Fig. 4(a)) but their length and bridgeness show a minimum for (Fig. 4(b) and (c)). The larger values of observed for (i.e. when wide channels are preferred) are due to the positive correlations between and . In spite of these correlations, invasions with positive (preference for narrow channels) may have a large value of because is very heterogeneous and there are channels that are both narrow and long Sup . The invasions corresponding to are then typically larger than predicted by models 1-3 (Fig. 2). The effect is particularly important for because wide channels (preferred for ) tend to be longer than narrow channels. Similarly, the significant spatial correlations in favour invasion in model 4 (see Sup ).
According to our analysis, the global traits of invasion are mainly dictated by generic characteristics such as the heterogeneity in the network (i.e. in channel length and degree of bridging) and transmission. An important conclusion which applies to invasions in any heterogeneous landscape is that a limited parametrisation of microbial transmission (e.g. in terms of ) combined with an insufficient description of structural heterogeneity in models (e.g. as in models 1-3) may lead to serious underestimates of the size of invasions. This highlights the importance of capturing (i) the essential features of structural heterogeneity that affect microbial spread and (ii) the appropriate parametrisation of microbial transmission which takes into account the effects of structural heterogeneity. Our results suggest that describing microbial transmission in terms of the parameters and (Model 4) is more appropriate than using just . Indeed, and give a better description of the effects of channel structure on microbial spread and reveal significant differences in invasion for ploughed and unploughed soil (microorganisms with preference for wide channels invade more in ploughed soil, and vice versa Sup ).
To conclude, our work demonstrates that the shape, size, and interconnection of pores in addition to other characteristics influencing the value of the area exploration parameter (e.g. type of microorganisms) are the key factors determining the extend of microbial invasion in soil. The interplay between heterogeneity in microbial transmission and heterogeneity in the topology of soil networks plays a crucial role for biological invasions in soil.
Acknowledgements.
We acknowledge fruitful discussions with V.L. Morales. CAG gratefully acknowledges support for a BBSRC Professorial Fellowship. LdFC is grateful to FAPESP (05/00587- 5) and CNPq (301303/06-1 and 573583/2008-0). MPV thanks FAPESP (2010/16310-0) for his post-doc grant.References
- Turner et al. (2001) M. Turner, R. Gardner, and R. O’Neill, Landscape ecology in theory and practice: pattern and process (Springer, 2001)
- Viswanathan et al. (2011) G. M. Viswanathan, M. G. E. da Luz, E. P. Raposo, and H. E. Stanley, The physics of foraging (Cambridge University Press, Cambridge, UK, 2011)
- Lavelle and Spain (2001) P. Lavelle and A. Spain, Soil Ecology (Springer, 2001)
- Copley (2000) J. Copley, Nature 406, 452 (2000)
- Young and Crawford (2004) I. M. Young and J. W. Crawford, Science 304, 1634 (2004)
- Kiers et al. (2011) E. T. Kiers, M. Duhamel, Y. Beesetty, J. A. Mensah, O. Franken, E. Verbruggen, C. R. Fellbaum, G. A. Kowalchuk, M. M. Hart, A. Bago, T. M. Palmer, S. A. West, P. Vandenkoornhuyse, J. Jansa, and H. Bücking, Science 333, 880 (2011), http://www.sciencemag.org/content/333/6044/880.full.pdf
- B. K. Singh and Reay (2010) P. S. B. K. Singh, R. D. Bardgett and D. S. Reay, Nat Rev Micro 8, 779 (2010)
- Otten and Gilligan (2006) W. Otten and C. A. Gilligan, European Journal of Soil Science 57, 26 (2006)
- Franklin and Mills (2007) R. B. Franklin and A. L. Mills, eds., The Spatial Distribution of Microbes in the Environment (Springer, Dordrecht, 2007)
- Otten and Gilligan (1998) W. Otten and C. A. Gilligan, New Phytol. 138, 629 – (1998)
- Nunan et al. (2002) N. Nunan, K. Wu, I. Young, J. Crawford, and K. Ritz, Microbial Ecology 44, 296 (2002), 10.1007/s00248-002-2021-0
- Harris et al. (2003) K. Harris, I. M. Young, C. A. Gilligan, W. Otten, and K. Ritz, FEMS Microbiology Ecology 44, 45 (2003)
- Otten et al. (2004) W. Otten, K. Harris, I. Young, K. Ritz, and C. Gilligan, Soil Biology and Biochemistry 36, 203 (2004)
- Hapca et al. (2009) S. Hapca, J. Crawford, and I. Young, J. Roy. Soc. Interface 6, 111 (2009)
- Dechesne et al. (2010) A. Dechesne, G. Wang, G. Gülez, D. Or, and B. F. Smets, Proceedings of the National Academy of Sciences 107, 14369 (2010), http://www.pnas.org/content/107/32/14369.full.pdf+html
- Melbourne et al. (2007) B. A. Melbourne, H. V. Cornell, K. F. Davies, C. J. Dugaw, S. Elmendorf, A. L. Freestone, R. J. Hall, S. Harrison, A. Hastings, M. Holland, M. Holyoak, J. Lambrinos, K. Moore, and H. Yokomizo, Ecology Letters 10, 77 (2007)
- Neri et al. (2011) F. M. Neri, F. J. Pérez-Reche, S. N. Taraskin, and C. A. Gilligan, J. Roy. Soc. Interface 8, 201 (2011)
- Newman (2002) M. E. J. Newman, Phys. Rev. E 66, 016128 (2002)
- Miller (2007) J. C. Miller, Phys. Rev. E 76, 010101 (2007)
- (20) See supplemental material at http://link.aps.org/supplemental/xxxx for further details on methods and results.
- Vogel and Roth (1998) H. J. Vogel and K. Roth, European Journal of Soil Science 49, 547 (1998)
- Vogel and Roth (2001) H.-J. Vogel and K. Roth, Advances in Water Resources 24, 233 (2001)
- Santiago et al. (2008) A. Santiago, J. P. Cárdenas, J. C. Losada, R. M. Benito, A. M. Tarquis, and F. Borondo, Nonlinear Processes in Geophysics 15, 893 (2008)
- Cárdenas et al. (2010) J. Cárdenas, A. Santiago, A. Tarquis, J. Losada, F. Borondo, and R. Benito, Geoderma 160, 13 (2010)
- Csányi and Szendrői (2004) G. Csányi and B. Szendrői, Phys. Rev. E 70, 016122 (2004)
- Boccaletti et al. (2006) S. Boccaletti, V. Latora, Y. Moreno, M. Chavez, and D. Hwang, Phys. Rep. 424, 175 (2006)
- Buhl et al. (2004) J. Buhl, J. Gautrais, R. Solé, P. Kuntz, S. Valverde, J. Deneubourg, and G. Theraulaz, Eur. Phys. J. B 42, 123 (2004)
- Barrat et al. (2008) A. Barrat, M. Barthélemy, and A. Vespignani, Dynamical Processes on Complex Networks (Cambridge University Press, Cambridge, 2008)
- Watts and Strogatz (1998) D. J. Watts and S. H. Strogatz, Nature 393, 440 (1998)
- Grassberger (1983) P. Grassberger, Math. Biosc. 63, 157 (1983)
- Pérez-Reche et al. (2011) F. J. Pérez-Reche, J. J. Ludlam, S. N. Taraskin, and C. A. Gilligan, Phys. Rev. Lett. 106, 218701 (2011)
- Vespignani (2012) A. Vespignani, Nat Phys 8, 32 (2012)
- Ettema and Warde (2002) C. H. Ettema and D. A. Warde, Trends Ecol. Evol. 17, 177 (2002)
- Sander et al. (2002) L. Sander, C. P. Warren, I. M. Sokolov, C. Simon, and J. Koopman, Math. Biosc. 180, 293 (2002)
- Pérez-Reche et al. (2010) F. J. Pérez-Reche, S. N. Taraskin, L. d. F. Costa, F. M. Neri, and C. A. Gilligan, J. Roy. Soc. Interface 7, 1083 (2010)
- Perez-Reche et al. (2009) F. Perez-Reche, S. Taraskin, F. Neri, C. Gilligan, L. da F. Costa, M. Viana, W. Otten, and D. Grinev, in Proc. 16th International Conference on Digital Signal Processing (2009) pp. 1–8
- Motter et al. (2002) A. E. Motter, T. Nishikawa, and Y.-C. Lai, Phys. Rev. E 66, 065103 (2002)