Structural phase transition below 250 K in superconducting K0.75Fe1.75Se2
Abstract
Vibrational properties of iron-chalcogenide superconductor K0.75Fe1.75Se2 with 30 K have been measured by Raman and optical spectroscopies over temperature range of 3-300 K. Sample undergoes I4/m I4 structural phase transition accompanied by loss of inversion symmetry at , below 250 K, observed as appearance of new fully-symmetric Raman mode at 165 cm-1. Small vibration mode anomalies are also observed at 160 K. From first-principles vibrational analysis of antiferromagnetic K0.8Fe1.6Se2 utilizing pseudopotentials all observed Raman and infrared modes have been assigned and the displacement patterns of the new Raman mode identified as involving predominantly the Se atoms.
pacs:
78.30.-j, 74.70.Xa, 74.25.KcI INTRODUCTION
Discovery of high- superconductivity in iron-based chalcogenides AyFe1.6+xSe2 (A=K, Rb, Cs, and Tl) Ref. [discovery, ] raised considerable attention since the materials exhibit unusual physical properties. Parent compound (1, 0) is an insulator, transport ; gap crystalizes into xx1 I4/m Fe vacancy-ordering structure, and exhibits antiferromagnetic (AFM) order below a Neél temperature of 560 K Ref.[structure, ]. Doping with alkaline metals or Tl (1) apparently preserves the Fe vacancy-ordering and give rise to superconductivity in samples with close to 2:4:5 stoichiometry compos . Early transport transport and neutron diffraction structure studies suggested that the superconductivity coexists with AFM order. Alternatively, the doping is discussed in terms of microscopic phase separation TEM ; XRD ; XRD1 ; NQR0 ; optics : a mixture of vacancy-ordered AFM insulating phase and superconducting phase (SC). Due to resent experimental evidences mSR ; NQR ; INS ; STM the consensus seems emerge: the AFM and SC phases are specially separated, the AFM phase occupies from 80 Ref. [mSR, ] to 95 % Ref. [NQR, ] of the sample volume, and SC phase is homogeneous and does not contains Fe-vacancies nor magnetic moments. NQR ; INS ; STM
Raman scattering study of superconducting K0.8Fe1.6Se2 observed at least 13 phonon modes Raman1 . The crystal symmetry of sample was determined as or lower. Zhang et al. performed LDA vibration analysis of nonmagnetic I4/m K0.8Fe1.6Se2 phase and assigned majority of observed Raman modes. The vibrational properties K0.88Fe1.63S2 isostructural to K0.8Fe1.6Se2 confirmed Fe-vacancy ordering: 14 Raman active modes predicted by factor-group analysis were observed and assigned. The authors concluded that the phonon energies in the range of 80-300 K are driven by anharmonicity effects without any signatures of electron-phonon interaction Raman2 . Impact of iron and potassium composition on Raman vibration spectra of A0.8Fe1.6Se2 (A=K, Rb, and Tl) was presented in Ref. [Raman3, ].
The optical studies to date showed at least ten IR-active modes at low temperatures. optics1 ; optics2 The in-plane optical conductivity of (31 K) is incoherent at 300 K, dominated by IR-active modes and high-frequency excitations optics2 , but become coherent just above the . Small carrier concentration prompted authors optics ; optics2 to suggest that the global superconductivity is due to Josephson coupling of nanoscale-sized superconducting phase in the AFM ordered insulating phase.
In this paper we report on Raman scattering and ab-plain optical conductivity studies of superconducting K0.75Fe1.75Se2 ( 30 K) in the -range from 3 to 300 K. At least 19 Raman-active and 12 IR-active modes are observed at 3 K. The 136, 143, 242, and 277 cm-1 Raman and 208 cm-1 IR mode exhibit Fano-like shape. The Raman Fano modes are due the vibration coupling to AFM spin fluctuations, while the IR- mode is coupled to charge carriers in low-frequency part of optical conductivity. Raman phonon linewidth contains approximately equal contributions of two-phonon lattice anharmonicity on one hand and bare self-energy and broadening due to intrinsic defects on the other hand, except for the 100 cm-1 mode dominated by inhomogeneous broadening. We show that K0.75Fe1.75Se2 undergoes I4/m I4 structural phase transition at below 250 K. Several modes which are not Raman- and IR-active in the measured geometry in I4/m become clearly visible in I4 phase. Symmetry of the Se-Fe slab is broken at . At 160 K Raman vibration modes exhibit weak anomalies seen as small discontinuity of vibration frequencies and change in vibration intensity vs temperature dependencies. Raman vibration intensities of a few modes increases between and , saturating above the , except for three modes dominated by -axis atomic displacements: -axis structural distortions within the slab appear to build up on cooling down to 3 K. The low-frequency optical conductivity displays weak temperature dependence above followed by faster increase below the .
II EXPERIMENTAL
The crystal of iron-chalcogenide superconductors were grown by a self-melting method with nominal concentration of 0.8:2.1:2.0 (K:Fe:Se). The actual chemical composition was determined by EDXS as K0.75Fe1.75Se2 (KFS). Two-step transitions were seen in resistivity curve optics , a sharp drop at 42 K is followed by a major superconducting transition with 30 K. Further details of sample characterization can be found elsewhere. optics
KFS crystals were never exposed to air. Sealed vial was open under 99.999% N2, crystal removed and glued on replaceable copper sample holder of a helium Oxford Instruments cryostat, dried and cleaved along the ab-plane, transferred to the He-flow cryostat, and quickly cooled below water freezing temperature. Raman data were obtained on two single crystals. Data presented in this paper refer to the sample with more detail temperature dependence records. It is worth mentioning that results obtained on the second sample are consistent with findings reported here.
Raman spectra were excited with Kr+ laser line of 647.1 nm (1.92 eV) with less than 10 mW of incident laser power focused into a spot of 50x100 m2 on the freshly cleaved ab-plain crystal surface. The scattered light collected close to the backscattered geometry was focused to a 100x240 m2 entrance slits of a custom triple-stage spectrometer equipped with 1800 lines/mm gratings. The instrumental resolution was 1.4 cm-1. To record symmetry resolved Raman spectra we employed circularly polarized light with the optical configurations selecting either the same or opposite chirality for incident and scattered light. The former is referred to as right-right (RR) and the latter as to right-left (RL) configurations. For the point group the ( symmetry is probed in the RL (RR) scattering geometry. Temperature dependent Raman spectra were collected at 3, 45, 100, 150, 160, 180, 200, 260, and 300 K with - stability better than 0.1 K. An estimated local heating in the laser spot did not exceed 4 K.
Optical measurements were done by Bruker Vertex 80v spectrometer in the frequency range from 25 to 10000 cm-1. The sample was under vacuum of 2*10-5 Pa. An in-situ gold and aluminum over-coating technique was used to get the reflectance for light polarized in the KFS (ab)- planes. The real part of conductivity was obtained by the Kramers-Kronig transformation of the . Optical spectra were collected at 8, 35, 170, and 300 K.
III RESULTS
K0.8Fe1.6Se2 crystalizes into tetragonal structure I4/m (space group #87) Ref. [structure, ], resulting in the irreducible vibrational representation:
| (1) |
All -modes are Raman active, but only the and are selected with RR and RL polarizations under the measured geometry. The and vibrations are infrared active along the -axis and in the -plane. The modes are silent. The Fe(1)-vacancy related vibration modes are excluded. Throughout this paper we adopted commonly used site designation: K(1), K(2), Fe(1), Fe(2), Se(1) and Se(2) stand, respectively, for Wyckoff positions of 2, 8, 4, 16, 4, and 16, refer to a legend of Fig.1.
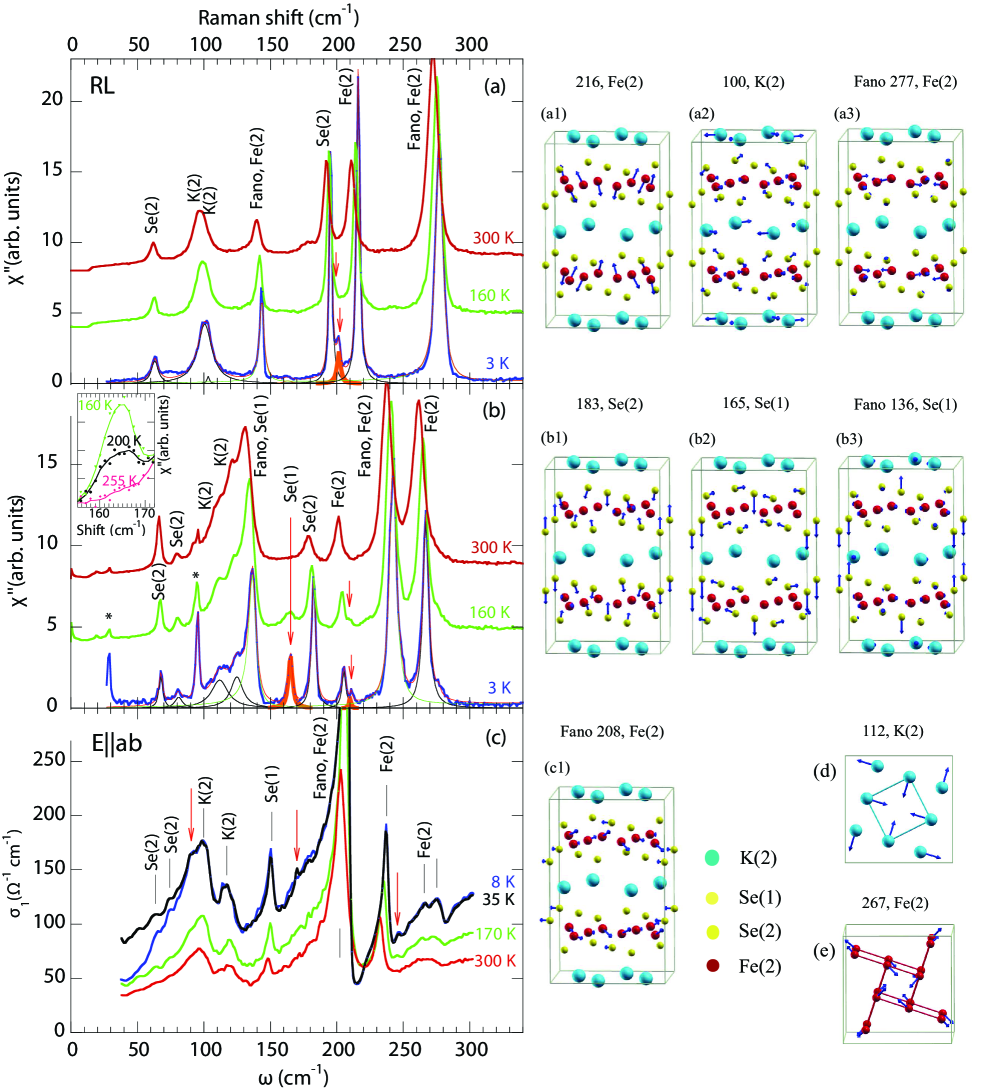
Raman spectra of K0.75Fe1.75Se2 are shown in Fig 1(a) and 1(b) for RL and RR polarizations, respectively. At 300 K, at least 7(9) modes are observed in RL (RR) in good agreement with 9+8 expected in the I4/m x cell of K0.8Fe1.6Se2 Raman1 . The modes at 112 and 267 cm-1 are dominated by both chiral and breathing displacements of K(2) and Fe(2) atoms, respectively, Fig. 1(d,e). Below 200 K new modes appear (marked with red arrows): at 201 cm-1 in RL and at 165 and 211 cm-1 in the RR. The 136 and 277 cm-1 phonons in the RL and 144 and 242 cm-1 phonons in RR exhibit Fano shapes in whole temperature range of this study. The Fano modes become more symmetric with temperature decrease. Phonon modes parameters are derived from least square fit to experimental data and are summarized in Table 1.
Low-frequency region of optical conductivity adopted from Fig. 2 in Ref. [optics, ] is shown in Fig 1(c). In agreement with previous studies optics ; optics2 , is small (characteristic of a poor metal) and it is dominated by the infrared-active vibrations and interband features at higher energies. At 170 and 300 K 9 IR-active modes are observed. The 208 cm-1 mode exhibits a Fano-like shape, becoming more asymmetric on cooling. At 170 K and below, at least three new modes (red arrows) are formed, Fig. 1(c). An inspection of the Table 1 reveled that Raman and IR modes reported in this work do not overlap. It’s therefore tempting to conclude that inversion symmetry is preserved. In Section IV we argue that inversion symmetry is actually broken below 250 K. The conductivity displays relatively weak temperature dependence above 170 K followed by about two-fold increase of the continuum as temperature drops from 170 to 35 K. In agreement with previous studies optics1 ; optics2 , a Drude-like peak is seen in 35 K data, shortly before sample becomes superconducting.
| AFM, I4/m | Raman (, | Ref.[Raman1, ] | IR (, | Ref.[optics2, ] |
|---|---|---|---|---|
| 63.6 | 67.6, 3.5 | 66.3 | ||
| 79.9 | 81.0, 6.1 | |||
| 89.0 | 111.8, 15.0 | |||
| 108.2 | 124.8, 11.1 | 123.8 | ||
| 126.0 | Fano 135.9 | 134.6 | ||
| 173.5 | 182.5, 3.4 | |||
| 211.1 | 205.3, 3.6 | 202.9 | ||
| 236.0 | Fano 242.3 | 239.4 | ||
| 265.9 | 267.0, 5.3 | 264.6 | ||
| 57.9 | 63.1, 6.2 | 61.4 | ||
| 66.4 | - - | |||
| 98.2 | 100.6, 12.8 | 100.6 | ||
| 117.3 | 103.3, 2.1 | |||
| 134.9 | Fano 143.6 | 141.7 | ||
| 206.0 | 195.3, 2.6 | |||
| 224.0 | 216.1, 3.0 | 214.3 | ||
| 262.7 | Fano 277.1 | 274.9 | ||
| 59.0 | ||||
| 79.9 | ||||
| 95.1 | 98.9, 8.2 | 102.3 | ||
| 104.5 | ||||
| 156.9 | 171.2, 4.9 | |||
| 206.5 | ||||
| 224.0 | ||||
| 251.3 | 246.3, 5. | |||
| 61.1 | ||||
| 92.7 | ||||
| 96.3 | ||||
| 172.4 | 165.2, 3.6 | |||
| 212.4 | 211.0, 1.4 | |||
| 249.7 | ||||
| 271.0 | ||||
| 67.7 | ||||
| 76.0 | ||||
| 89.3 | ||||
| 116.2 | ||||
| 181.9 | 200.5, 3.4 | |||
| 240.5 | ||||
| 273.0 | ||||
| 62.5 | 63.8, 7.1 | 65.2 | ||
| 73.9 | 74.2, 6.1 | 73.6 | ||
| 85.9 | 91.3, 16. | 93.7 | ||
| 96.5 | 118.5,10. | 121.9 | ||
| 140.7 | 150.1, 4.0 | 151.7 | ||
| 219.3 | Fano 207.6 | 208.3 | ||
| 233.3 | 236.6, 4.4 | 238.3 | ||
| 268.3 | 267.2, 6.1 | 267.1 | ||
| 276.1, 4.9 | 278.6 |
III.1 First-principles phonon modes analysis
We performed first-principles density functional theory (DFT) calculations using local density approximation (LDA) with Perdew Zunger (PZ) parameterization for the exchange-correlation energy functional as implemented in Quantum Espresso simulation package PWSCF . We used ultrasoft pseudopotentials USP for K, Fe and norm-conserving pseudopotential NCP for Se to describe the interaction between the ionic cores and the valence electrons. The pseudopotentials include 9 valence electrons for K (, , ), 16 for Fe (, , , ), and 6 for Se (, ) atoms. We used a plane wave basis with energy cutoff of 40 Ry for wave function and 360 Ry for the change density and a Monkhorst Pack mh-pack -point mesh for the Brillouin zone (BZ) integration.
We optimized structure of K0.8Fe1.6Se2 with a four spin cluster AFM ordering as discussed by Bao et al. structure using experimental lattice constants obtained at 11 K. The calculation was done using a primitive unit cell of 22 atoms with K(1) and Fe(1) vacancies at 2 and 4 Wyckoff sites of space group I4/m respectively. Structural optimization is carried through minimization of energy using Hellman-Feynman forces at each atoms in Broyden-Flecher-Goldfarb-Shanno scheme. The optimized structure shows a very good agreement with the experiment. We also allowed inversion symmetry breaking displacement and found that I4 structure has slightly lower energy ( 3.5 meV) compared to I4/m, however the splitting of atomic coordinates was very small. We find that both the structures exhibit a band gap of 0.4 eV.
Frequencies of the zone center phonons are determined using linear response method LR for the relaxed structures are listed in the first column of Table 1 for the AFM I4/m K0.8Fe1.6Se2. Since all nine modes anticipated in the parent AFM I4/m K0.8Fe1.6Se2 are observed at room temperature, there is a unique correspondence between computed and measured vibration frequencies summarized in Table 1. Computed mode at 66.4 cm-1 is not observed. The vibration at 117.3 cm-1 submerges to the broad mode at 100 cm-1, Fig. 1(a) and is revealed in the fit. Importantly, two modes at 79.9 and 89.0 cm-1cannot be reproduced in non-magnetic (NM) I4/m x structure either undoped K0.8Fe1.6Se2 or vacancy-free KFe2Se2 also computed in this work but not listed in the Table 1. Therefore, accounting for the spin degree of freedom is essential for accurate mapping of the observed Raman modes. The 8 out of 9 observed IR active modes at 300 K are assigned, Table 1 and Fig. 1(c). The remaining mode at 278 cm-1 is likely due to finite Fe(1) population in the superconducting sample: an extra mode appears in NM vacancy-free I4/m at 294 cm-1. In summary, the observed Raman and IR- vibration frequencies above 200 - 250 K are in good agreement with computed frequencies. Below 200 - 250 K, new Raman modes at 165, 201, and 211 cm-1 and IR-active modes at 99, 171, and 246 cm-1 show up. Their vibration frequencies corresponds well to the computed frequencies of Raman active A, B and IR active E in the I4 structure, Table 1.
Displacement patterns of selected vibration modes are illustrated in Fig. 1. Raman modes shown in (a1) and (b1) correspond to Fe B1g and As A1g vibrations in the 122 iron-arsenides modes122 . In AFM I4/m both modes got finite (,) displacements. The B 100 cm-1 mode is dominated by in-plane K displacements with some admixture of Se and Fe displacements. Its large -independent linewidth is related to static disorder associated with K(2) sites. The 172.4 cm-1 patterns are shown in (b2). Being non-Raman active in the AFM I4/m phase it becomes new Raman mode in the low- phase AFM I4, Fig. 1(b2). Fig. 1 visualizes atomic displacement of one IR-active (c1) and two out of four observed Raman active Fano modes (a3 and b3) discussed in this paper. The striking feature of all but Se-based 136 cm-1 is essential involvement of Fe(2) atomic displacements. In K0.8Fe1.6Se2 Fe atoms carry magnetic moment as large as 3.3 Ref. [structure, ], while electronic structure near is dominated by Fe -states gap . The Fano modes coupling to electronic and magnetic degrees of freedom are explored in the following section.
III.2 Origin of Fano vibration modes
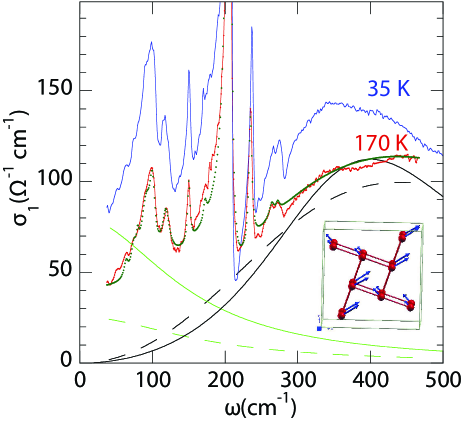
Asymmetric line shapes are characteristic of Fano resonances arising from coupling between the phonons and an electronic continuum, electronic or magnetic in origin. Dipole transition in the IR- absorption does not directly couple the AFM excitations, but couples charge carriers. Raman scattering probes both electronic and magnetic excitations. The 208 cm-1 IR- and 144, 242, and 277 cm-1 Raman Fano modes are dominated by Fe(2) atomic displacements. Interestingly, the IR mode gets more asymmetric [Fig. 2] while four Raman modes [Fig. 3(a-d)] become more symmetric on cooling.
The optical conductivity at 35 and 170 K is shown in Fig. 2. Taking 170 K spectrum as an example, the experimental conductivity is fitted as sum of Drude peak (dashed green), broad Lorentz component (dashed black) describing interband transition at 400 cm-1, the beginning of mid-infrared (MIR) peak, and eleven Lorentz and one Fano phonon modes. Both Drude and MIR become slightly more coherent and better pronounced as temperature decreases to 35 K. At frequency of Fano mode, the Dude contribution increases, while the MIR contribution slightly decreases. Therefore, enhancement in the IR Fano peak asymmetry is due to the vibration coupling to charge carriers in the Drude tail.
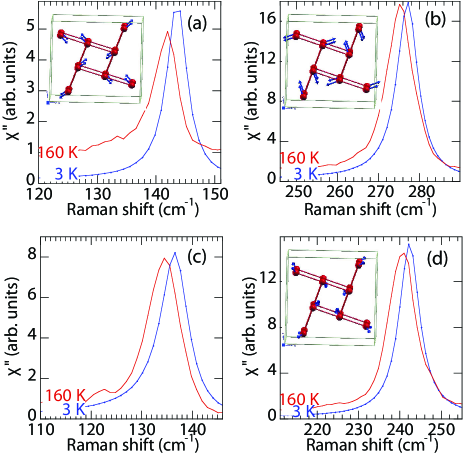
Four Fano Raman modes are presented in Fig. 3(a)-(d) at 3 and 160 K. They were obtained by removal of fitted in phonons from data shown in Fig 1(a,b). Clearly, all Raman modes exhibit similar dependence: (a) they are less symmetric, and (b) they characterized by larger background at 160 K than at 3 K. The observed behavior is reminiscent of -dependence of a new mode observed in AFM 122 systems. The mode appears at as a Fano-shaped one and it becomes progressively more symmetric with temperature decrease. The Fano peak derives from vibration coupling to magnetic continuum, the AFM spin fluctuations.
III.3 Temperature dependence of Raman mode linewidth and phonon frequencies
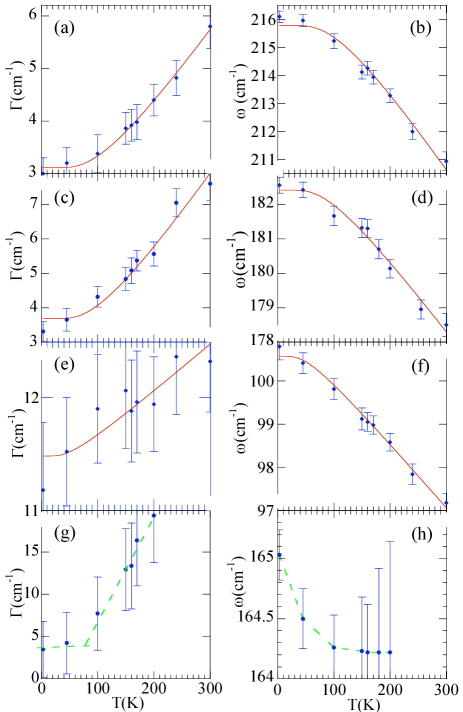
Selected linewidth and phonon frequencies as function of temperature are shown in Fig. 4. The -dependent phonon frequencies qualitatively agree with those reported by Zhang et al in K0.8Fe1.6Se2 (Fig 5 in Ref. [Raman1, ]) and by Lazarević et al in isostructural K0.88Fe1.63S2 (Fig. 3(b-j) in Ref. [Raman2, ]). In the latter work, the authors concluded that the Raman active phonon energies in the range of 80-300 K are fully driven by anharmonicity effects Raman2 . Interpretation offered in the present work is different: the residual linewidth is compatible [Fig. 4(a,c)] or larger [Fig. 4(e)] than the temperature dependent increment between 3 and 300 K. Therefore, self-energy of non-Fano phonons (i.e. at 195 and 216 cm-1 in and at 68, 205, and 267 cm-1 in channels) consist of approximately equal contributions of two-phonon lattice anharmonicity on one hand and bare self-energy and broadening due to intrinsic defects on the other. Self-energy of 100 cm-1 mode involving the K(2) atomic displacements is dominated by inhomogeneous broadening. The new 165 cm-1 mode appearing at in the range of 200 to 250 K becomes fully coherent below 40-60 K: the linewidth presented in Fig. 4(g) quickly reduces by 5 times as temperature decreases from 200 to 60 K, followed by saturation below 40 K. The mode hardens on cooling by 1.0 cm-1 [Fig. 4(h)] in the traceable -range.
IV DISCUSSION
The new 165 cm-1 mode appearing at in the range of 200-250 K, [insert of Fig. 1(b)], usually referred as seen at below 250 K throughout this paper, is not Raman active in the I4/m phase (Table 1), fully symmetric in character, and it quickly becomes coherent with -decrease [Fig. 3(g)]. The question arises whether this mode signifies crystal symmetry lowering on a structural phase transition. If it is associated with symmetry lowering, it would become allowed phonon mode in one of subgroups of . The encompass the (loss of inversion and rotation-reflection), (loss of 4th order rotation axis), (loss of inversion and 4th order rotation axis), C2 (loss of inversion, 4th order rotation axis, and rotation-reflection), and (primitive) subgroups. We did not observe leaking of four-fold axis symmetry that would results in the cross-polarization intensity leakages beyond small leakages of polarization optics which don’t correlate with temperature dependence of the 165 cm-1 mode. Thus, , , and subgroups are excluded. The (space group #82) is excluded because there is no new -type Se(1) mode associated with the transition. Therefore, I4/m (, space group #87) becomes I4 (, space group #79). From the factor-group analysis , , and modes in becomes, respectively , , and modes in . Instead of 98 Raman active and 8 infrared active modes in high- I4m phase one would expect to encounter 17+15 Raman and 17 IR-active modes in low- phase under the measured geometry. Here we excluded acoustic and Fe(1)-related modes, since the Fe(1)-site is mostly empty site in K0.75Fe1.75Se2. The Raman active modes do not overlap with ab-plane IR active modes, not only in high- but in low- phases. This explains seemingly puzzling absence of IR mode leakages into the Raman spectra noted in Section 3. Since new Raman modes (at 165, 201, and 211 cm-1 and IR-active modes (at 99, 171, and 246 cm appears below and those modes are non-Raman(non-IR) active or silent in I4m (Table 1) we suggest that K0.75Fe1.75Se2 undergoes I4/m I4 structural phase transition accompanied by loss of inversion symmetry at below 250 K. Our first-principles calculations utilizing pseudopotentials also narrowly favor I4 over the I4/m structure. The small total energy difference is likely because computations do not include all correlations and/or the calculations are performed for the undoped K0.8Fe1.6Se2.
Temperature dependence of selected phonon frequencies and intensities are shown in Fig. 5(a,b) and 5(c,d), respectively. Apart from the structural phase transition at below 250 K, clearly there is a second characteristic temperature, 160 K. At majority of phonon vibration frequencies exhibit consistent discontinuity up to 0.3 cm-1 [Fig. 5(a, b)], while quite a few modes display slop changes in their intensity vs temperature dependencies [Fig. 5(c, d)]. Since no new vibration modes (Raman or IR) are observed below the the is not constituent a structural phase transition, but rather referred as phonon anomaly temperature. Anomaly of a single mode at 66 cm-1 at 160 K was mentioned by Zhang et al. Raman1 . We would like to point out that the phonon anomalies seen at the 160 K involve majority of measured Raman modes.
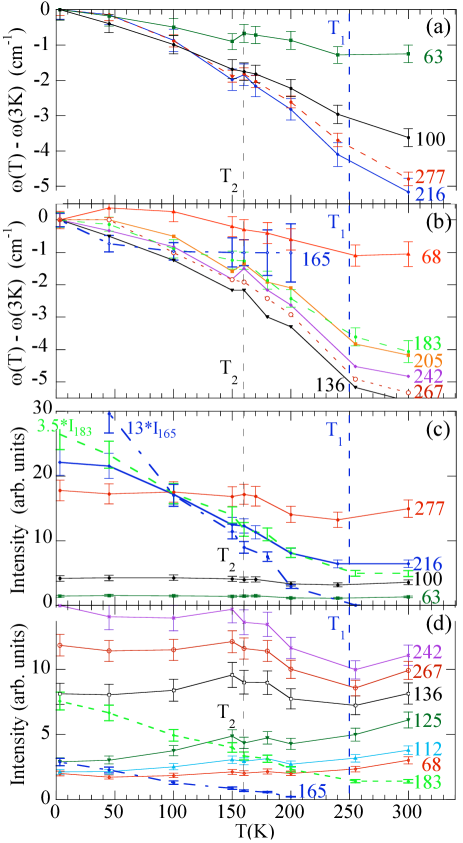
From experimental data at hand we could point out two implications of the observed structural phase transition on low- properties of K0.75Fe1.75Se2. First, symmetry of the Se(1,2)-Fe(2) slab is broken at , sample becomes ferroelectric, and -axis structural distortions within the stab appears to build up on cooling. This is seen in Raman phonon peak intensities, Fig. 5(c,d), which are directly proportional to polarizability tensor. As sample enters the low- phase (), polarizability of quite a few Raman-active modes build-up till , followed by saturation at (-symmetry at 63, 100.6, and 277; -symmetry at 81 and 267, Fano-shape 136 and 242 cm-1) or reduction (-symmetry at 68, 112, and 125 cm-1). However, polarizabilities of Fe(2)-based mode at 216, As(2)-based mode at 183, and As(1)-based mode at 165 cm-1 continue to build up till 45, 3, and 3 K, respectively. The scaling relationships among the three are shown in Fig. 5(c). The scaling is not surprising, giving to similar displacements patterns of the modes along the -axis [Fig.1(a1), (b1), and (b2)], so that their Raman activities are driven by polarizability of the electronic orbitals forming the Fe-Se slabs. In iron-arsenides (122-systems) the Fe-As slab is perfectly symmetric and the Raman-active As-based mode has extremely low intensity (polarizability) if measured in the same geometry modes122 . It becomes visible upon doping destroying the symmetry of the slab. In K0.75Fe1.75Se2, intrinsic population of Fe- and K- vacancies makes the Se(2)-based 183 cm-1 mode effortlessly visible at room temperature. The atomic displacements associated with the I4/m I4 phase transition which have sizable -plane components are likely quenched below , while - axis displacements continue to build up on cooling. Second implication concerns the temperature dependence of low-frequency optical conductivity shown in Fig. 1(c). The conductivity displays weak temperature dependence above followed by faster increase below the , in agreement with similar temperature dependence reported by Homes et al. optics2
Onset of superconductivity at 30 K has little effect on phonons. Using 3 and 45 K data points, the upper estimated phonon energy shifts are -0.3 0.4 cm-1 (||/ 0.44%) for 67.6 cm-1 and 0.6 0.4 cm-1 (||/ 0.36%) for 165.0 cm-1 modes. Small frequencies renormalization implies either weak e-ph interaction or that the phonons used in our analysis belongs to the AFM phase in the phase separated models TEM ; XRD ; optics ; NQR ; INS : spectator AFM phonons would not feel onset of the superconductivity, unless via the proximity effect.
V CONCLUSIONS
Raman scattering and optical conductivity were used to determine lattice vibration frequencies of superconducting crystal K0.75Fe1.75Se2 in temperature range from 3 to 300 K. 19 Raman-active and 12 IR-active modes are observed at 3 K. The 136, 143, 242, and 277 cm-1 Raman and 208 cm-1 IR mode exhibit Fano-like shape. The Raman Fano modes are due to the vibration coupling to AFM spin fluctuations, while the IR- mode is coupled to charge carriers in low-frequency part of optical conductivity. Raman phonon linewidths contain approximately equal contributions of two-phonon lattice anharmonicity on one hand and bare self-energy and broadening due to intrinsic defects on the other hand. The K0.75Fe1.75Se2 undergoes I4/m (space group #87) I4 (space group #79) structural phase transition at below 250 K. Several modes which are not Raman- and IR-active in the measured geometry in I4/m become visible in I4 phase including Raman modes at 165, 201, and 211 cm-1 and IR-active modes at 99, 171, and 246 cm-1. Weak phonon anomalies are also observed at at 160 K. Symmetry of the Se(1,2)-Fe(2) slab is broken at . -plane structural distortions are likely quenched below , while -axis structural distortions within the slab continues to build up on cooling down to 3 K.
VI ACKNOWLEDGMENTS
Research at Rutgers was supported by the U.S. DOE, office of BES, Division of Materials Science and Engineering under award DE-SC0005463. Research at Beijing National Laboratory for Condensed Matter Physics was supported by the NSFC and 973 projects of MOST (Grant No. 2011CB921701, 2012CB821403).
References
- (1) J. Guo, S. Jin, G. Wang, S. Wang, K. Zhu, T. Zhou, M. He, and X. Chen, Phys. Rev. B 82, 180520(R) (2010); A. F. Wang, J. J. Ying, Y. J. Yan, R. H. Liu, X. G. Luo, Z. Y. Li, X. F. Wang, M. Zhang, G. J. Ye, P. Cheng, Z. J. Xiang, and X. H. Chen, ibid. 83, 060512(R) (2011).
- (2) R. H. Liu, X.G. Luo, M. Zhang, A. F. Wang, J. J. Ying, X. F. Wang, Y. J. Yan, Z. J. Xiang, P. Cheng, G. J. Ye, Z. Y. Li, and X. H. Chen, Europhys. Lett. 94, 27008 (2011).
- (3) X.-W. Yan, M. Gao, Z.-Y. Lu, and T. Xiang, Phys. Rev. B 83, 233205 (2011).
- (4) W. Bao, Q.-Z. Huang, G.-F. Chen, M. A. Green, D.-M. Wang, J.-B. He, and Y.-M. Qiu, Chin. Phys. Lett. 28, 086104 (2011).
- (5) Y. J. Yan, M. Zhang, A. F. Wang, J. J. Ying, Z. Y. Li, W. Qin, X.G. Luo, J. Q. Li, J. Hu, and X. H. Chen, Sci. Rep. 2, 212 (2012).
- (6) Z. Wang, Y. J. Song, H. L. Shi, Z. W. Wang, Z. Chen, H. F. Tian, G. F. Chen, J. G. Guo, H. X. Yang, and J. Q. Li, Phys. Rev. B 83, 140505 (2011).
- (7) A. Ricci, N. Poccia, G. Campi, B. Joseph, G. Arrighetti, L. Barba, M. Reynolds, M. Burghammer, H. Takeya, Y. Mizuguchi, Y. Takano, M. Colapietro, N. L. Saini, and A. Bianconi, Phys. Rev. B 84, 060511 (2011).
- (8) Jun Zhao, Huibo Cao, E. Bourret-Courchesne, D. -H. Lee, and R. J. Birgeneau, arXiv:1205.5992.
- (9) D. A. Torchetti, M. Fu, D. C. Christensen, K. J. Nelson, T. Imai, H. C. Lei, and C. Petrovic, Phys. Rev. B 83, 104508 (2011).
- (10) R. H. Yuan, T. Dong, Y. J. Song, P. Zheng, G. F. Chen, J. P. Hu, J. Q. Li, and N. L. Wang, Sci. Rep. 2, 221 (2012).
- (11) A. Charnukha, A. Cvitkovic, T. Prokscha, D. Pröpper, N. Ocelic, A. Suter, Z. Salman, E. Morenzoni, J. Deisenhofer, V. Tsurkan, A. Loidl, B. Keimer, and A.V. Boris, Phys. Rev. Lett. 109, 017003 (2012).
- (12) Y. Texier, J. Deisenhofer, V. Tsurkan, A. Loidl, D. S. Inosov, G. Friemel, J. Bobroff, arXiv:1203.1834.
- (13) G. Friemel, J. T. Park, T. A. Maier, V. Tsurkan, Yuan Li, J. Deisenhofer, H.-A. Krug von Nidda, A. Loidl, A. Ivanov, B. Keimer, and D. S. Inosov, Phys. Rev. B 85, 140511(R) (2012).
- (14) Wei Li, Hao Ding, Peng Deng, Kai Chang, Canli Song, Ke He, Lili Wang, Xucun Ma, Jiang-Ping Hu, Xi Chen1, and Qi-Kun Xue, Nature Physics 8, 126 (2012).
- (15) A. M. Zhang, K. Liu, J. H. Xiao, J. B. He, D. M. Wang, G. F. Chen, B. Normand, and Q. M. Zhang, Phys. Rev. B 85, 024518 (2012).
- (16) N. Lazarević, Hechang Lei, C. Petrovic, and Z. V. Popović, Phys. Rev. B 84, 214305 (2011).
- (17) A. M. Zhang, K. Liu, J. H. Xiao, J. B. He, D. M. Wang, G. F. Chen, B. Normand, and Q. M. Zhang, arXiv:1105.1198.
- (18) Z. G. Chen, R. H. Yuan, T. Dong, G. Xu, Y. G. Shi, P. Zheng, J. L. Luo, J. G. Guo, X. L. Chen, and N. L. Wang, Phys. Rev. B 83, 220507(R) (2011).
- (19) C. C. Homes, Z. J. Xu, J. S. Wen, and G. D. Gu, Phys. Rev. B 85, 180510(R) (2012).
- (20) S. Baroni, A. Dal Corso, S. de Gironcoli, and P. Giannozzi, 2001, http://www.pwscf.org.
- (21) D. Vanderbilt, Phys. Rev. B 41, 7892(1990).
- (22) D. R. Hamann, M. Schlüter, and C. Chiang, Phys. Rev. Lett. 43, 1494 (1979).
- (23) H. J. Monkhorst and J. D. Pack, Phys. Rev. B 13, 5188 (1976); H. J. Monkhorst and J. D. Pack, ibid. 16, 1748 (1977).
- (24) S. Baroni, S. de Gironcoli, A. Dal Corso, and P. Giannozzi, Rev. Mod. Phys. 73, 515 (2001).
- (25) A. P. Litvinchuk, V. G. Hadjiev, M. N. Iliev, Bing Lv, A. M. Guloy, and C. W. Chu, Phys. Rev. B 78, 060503(R) (2008).
- (26) M. Balkanski, R. F. Wallis, and E. Haro, Phys. Rev. B 28, 1928 (1983).