The role of OH in the chemical evolution of protoplanetary disks
II. Gas-rich environments
Abstract
Context. We present a method for including gas extinction of cosmic-ray-generated UV photons in chemical models of the midplane of protoplanetary disks, focusing on its implications on ice formation and chemical evolution.
Aims. Our goal is to improve on chemical models by treating cosmic rays, the main source of ionization in the midplane of the disk, in a way that is consistent with current knowledge of the gas and grain environment present in those regions. We trace the effects of cosmic rays by identifying the main chemical reaction channels and also the main contributors to the gas opacity to cosmic-ray-induced UV photons. This information is crucial in implementing gas opacities for cosmic-ray-induced reactions in full 2D protoplanetary disk models.
Methods. We considered time-dependent chemical models within the range 1-10 AU in the midplane of a T Tauri disk. The extinction of cosmic-ray-induced UV photons by gaseous species was included in the calculation of photorates at each timestep. We integrated the ionization and dissociation cross sections of all atoms/molecules over the cosmic-ray-induced UV emission spectrum of H2. By analyzing the relative contribution of each gas phase species over time, we were able to identify the main contributors to the gas opacity in the midplane of protoplanetary disks.
Results. At 1 AU the gas opacity contributes up to 28.2% of the total opacity, including the dust contribution. At 3-5 AU the gas contribution is 14.5% of the total opacity, and at 7-8 AU it reaches a value of 12.2%. As expected, at 10-15 AU freeze-out of species causes the gas contribution to the total opacity to be very low (6%). The main contributors to the gas opacity are CO, CO2, S, SiO, and O2. OH also contributes to the gas opacity, but only at 10-15 AU.
Key Words.:
Astrochemistry; Protoplanetary disks; Molecular processes; (ISM:) cosmic rays1 Introduction
The midplane of protoplanetary disks has been considered a dead zone, because the lack of a source of ionization prevents the development of magneto-rotational instabilities, which are thought to drive the accretion process. The midplane of a disk corresponding to a Class II source around a T Tauri star is opaque to stellar and interstellar UV (van Zadelhoff et al., 2001; Woitke et al., 2009) and X-ray (Glassgold et al., 2007; Aresu et al., 2011) photons, which corresponds to a region located at 0.05 and AU. However, most regions of the midplane are far from being dead zones because of cosmic rays, which directly ionize the gas and heat the dust grains. An important consequence of the interaction of cosmic rays and H2 molecules is the emission of a locally generated UV field that can ionize/dissociate species. More specifically, regions that have a value for of a few are dominated by cosmic-ray processing, since they can penetrate column densities of 150 g cm-2 (Umebayashi & Nakano, 1981).
Hence, the midplane of the disk between 1 and 10 AU can be viewed as a cosmic-ray dominated region, where cosmic rays are the main source of ionization and therefore the main driver of the chemical evolution. Steady-state chemical models applied to these regions cannot fully describe the chemical evolution of the midplane, as the chemical relaxation timescale can be as long as 108 yr (Woitke et al., 2009), which is longer than the lifetime of the disk (Fedele et al., 2010; Haisch et al., 2010; Semenov & Wiebe, 2011). For this reason it is necessary to approach the study of the chemical evolution of the disk from a time-dependent model. One of the main catalysts of the cosmic-ray driven chemistry in these regions is OH (Chaparro Molano & Kamp, 2012), especially for the formation of CO and H2O.
Current chemical models of protoplanetary disks include to a large extent the effects of cosmic rays, whether they model the chemistry using steady-state (Woitke et al., 2009; Willacy & Woods, 2009; Gorti et al., 2011; Thi et al., 2011) or time-dependent (Visser et al., 2009, 2011; Walsh et al., 2010; Semenov et al., 2010) solutions. However, the effects of the local gas opacity and grain growth in cosmic-ray-induced UV processes are largely overlooked, as the parameters for estimating cosmic-ray-induced photoionization/dissociation rates are usually taken from molecular cloud literature (Gredel et al., 1989; Woodall et al., 2007).
In molecular cloud modeling (Cecchi-Pestellini & Aiello, 1992; Shen et al., 2004) it is customary to ignore those effects, as they are not relevant for the cold, gas-poor environment present deep inside molecular clouds and the interstellar medium (ISM). Another important factor to consider is grain growth in protoplanetary disks, which reduces dust UV opacity compared to molecular clouds111See D’Alessio et al. (2001) for evidence of grain growth from spectral energy distributions of protoplanetary disks. This leads to an enhancement in the cosmic-ray-induced UV flux (Chaparro Molano & Kamp, 2012) with respect to previous ISM based estimates (Shen et al., 2004), especially in gas-poor regions. This field, which is enhanced by a factor 40 at 10 AU, drives gas phase formation pathways for saturated molecules that can later freeze on the dust surface. Wherever the physical conditions allow for penetration of cosmic rays in disks, our analysis of cosmic-ray driven chemistry applies. Since we aim to perform a quantitative analysis, we chose the physical conditions from a particular disk model. However, our results do not depend on that particular choice.
This paper is structured as follows. The strategy to implement our model in Sect. 2 is followed by a discussion of the physical conditions in gas-rich regions of the disk midplane in Sect. 3. In Sect. 4 we discuss our treatment of cosmic-ray-induced UV photoprocesses including the effects of gas opacity. Sect. 5 deals with the particulars of our chemical model, followed by a summary (Sect. 6) and a discussion (Sect. 7) of our results. Finally, the main conclusions from our work are summarized in Sect. 8.
| (AU) | (K) | () |
|---|---|---|
| 1 | 80 | |
| 3-4 | 65 | |
| 7-8 | 40 | |
| 10-15 | 20 |
2 Methodology
Our goal is to identify the main chemical contributors to the extinction of cosmic-ray-induced UV (CRUV) photons in different regions of the midplane of a T Tauri disk. The temperature in the disk midplane can be high enough to prevent species from freezing onto the surface of grains immediately after their gas phase formation. This general freeze-out of chemical species is found to happen at distances beyond approximately 10 AU (Chaparro Molano & Kamp, 2012). Thus, we chose the 1-10 AU range of the disk midplane in this work, becuase the temperature and density conditions are ideal for studying regions with very different gas compositions. For example, the temperature at 7-8 AU (see Table 1) coincides with the onset of thermal desorption of CO, which will evaporate from the surface of grains while leaving the abundances of other frozen species for the most part unchanged.
The physical input conditions for our chemical evolution models are given by a ProDiMo model (Woitke et al., 2009), and are listed in Tables 1 and 2. We implemented a time-dependent calculation of the CRUV photorates that includes the extinction provided by the dust and also by gas species, which depends on their abundance. For this reason, we recomputed the CRUV photorate at each timestep of the simulation to account for the changes in gas phase abundances. This extinction was then integrated over the wavelength range and emission probability of CRUV photons. The emission probability was obtained from Lyman and Werner emission lines of H2 that is excited either by direct cosmic-ray interactions or by secondary electrons generated in cosmic-ray excitation of H2 (Prasad & Tarafdar, 1983).
Using this scheme, we can trace species that have a strong impact on the absorption of CRUV photons for the midplane of T Tauri disks. By taking into account the extinction contribution of dust grains, we can compare it to the gas extinction, thus obtaining a time-dependent value for the opacities over the CRUV wavelength range. We implemented this method in our time-dependent chemical rate equation solver chem_compact, which we previously used for studying ice formation in the comet formation zone (Chaparro Molano & Kamp, 2012) of a passive T Tauri disk with a low accretion rate. This code was benchmarked against steady-state chemical abundances from the ProDiMo simulation from Woitke et al. (2009).
2.1 Gas-rich regions
| Parameter | Symbol | Value |
|---|---|---|
| Stellar mass | 1 | |
| Effective temperature | 5770 K | |
| Stellar luminosity | 1 | |
| Disk mass | 0.01 | |
| Inner disk radius | 0.5 AU | |
| Outer disk radius | 500 AU | |
| Gas surface density power law index | 1.5 | |
| Dust-to-gas mass ratio | 0.01 | |
| Minimum dust grain size | 0.1 m | |
| Maximum dust grain size | 10 m | |
| Mean molecular weight | 1.35 | |
| Dust grain size power law index | 3.5 | |
| Dust material mass density | 2.5 gcm-3 | |
| Dust grain albedo (UV) | 0.57 | |
| Dust opacity (UV) | 6.8 cmg-1 | |
| Cosmic ray ionization rate (H2) | ||
| Number of active layers | 2 | |
| Adsorption site area | cm2 | |
| C adsorption energy | 630 K | |
| CO adsorption energy | 960 K | |
| CO2 adsorption energy | 2000 K | |
| CH3 adsorption energy | 920 K | |
| CH4 adsorption energy | 1100 K | |
| O adsorption energy | 630 K | |
| O2 adsorption energy | 960 K | |
| OH adsorption energy | 1000 K | |
| H2O adsorption energy | 4800 K | |
| Si adsorption energy | 2100 K | |
| SiH adsorption energy | 2300 K | |
| SiO adsorption energy | 2800 K | |
| Fe adsorption energy | 3300 K | |
| Mg adsorption energy | 4200 K |
Cosmic ray-induced UV photons can be absorbed by the material in the local environment where they are generated. Both gas and dust can absorb these photons and become a source of local extinction, but this depends on the local density and temperature conditions. For instance, at 10 AU most of the material is frozen onto the surface of dust grains, which means that the extinction of CRUV depends entirely on the local dust properties. In the absence of gas extinction, grain aggregation in protoplanetary disks can lead to an enhanced CRUV flux (Chaparro Molano & Kamp, 2012). In these gas-poor environments CRUV photoprocesses will not be affected by the composition of the gas and the chemistry can be described in a fairly straightforward fashion.
By contrast, in regions closer to the central star the environment is heated up and most of the chemical species will stay in the gas phase while leaving significantly reduced layers of frozen species. Any change in the chemical composition of the gas will either enhance the CRUV field or quench it efficiently, depending on the CRUV cross section of the dominant species in the gas. Thus, if we aim to understand the complex coupling effects between chemistry and CRUV photons, we need to fully incorporate the contribution of the gas in the local CRUV extinction.
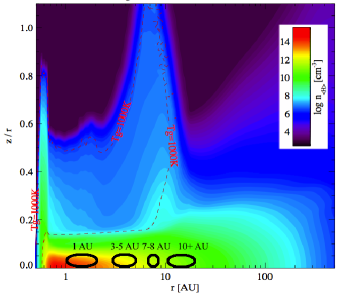
In Fig. 1 we show the regions under study in a plot of the density structure of the disk obtained using ProDiMo (Woitke et al., 2009), which provides us with a self-consistent hydrostatic structure from which we obtain parameters such as temperature, density, and intensity of the local UV field compared to the ISM Draine field. By studying regions at different distances from the star, we can identify the species that are locally dominant in their CRUV opacity.
The specific temperature and density conditions for each specific region of the disk midplane are found in Table 1. Near the inner rim (at 1 AU from the star) we focus on the role of CRUV photoprocesses in the highly efficient OH forming region near the inner rim. Moving farther away from the star, the temperature and the density decrease, which causes more material to freeze onto the surface of dust grains. To understand the role of freeze-out, we probed the disk at two more regions: at 3-4 AU and 7-8 AU. For the 10 AU region we refer the reader to part I of our paper (Chaparro Molano & Kamp, 2012).
3 Cosmic-ray-induced processes
Cosmic rays penetrate to the disk midplane predominantly from the vertical direction because the column density along all other directions is too high. From the analysis of cosmic-ray penetration in Semenov et al. (2004), it follows that in the midplane of the particular generic T Tauri disk chosen in this study (see Table 2 for a list of parameters), at radial distances larger than 1 AU cosmic rays can penetrate almost unhindered. Recent work by Padovani & Galli (2011) on the penetration of cosmic rays in molecular clouds suggests that interaction with magnetic fields is more important than previously thought. However, those results do not necessarily apply for the particular magnetic field geometry of protoplanetary disks, and more detailed modeling is necessary to clear the picture of cosmic-ray and magnetic field interactions.
The main chemical byproducts of direct cosmic-ray ionization are H (from H) and He+ (Herbst & Klemperer, 1973). While He+ is very good at dissociating molecules and passing on its charge to the products of the reaction, H hydrogenates and ionizes CH compounds, and helps create water from atomic oxygen (Chaparro Molano & Kamp, 2012).
Cosmic rays can also ionize the medium in a more subtle way: by inducing a UV field that comes from secondary ionization of molecular hydrogen. The process, known as the Prasad Tarafdar mechanism (Prasad & Tarafdar, 1983), starts when an electron with a typical energy of 30 eV is released after the cosmic-ray ionization of an H2 molecule. This secondary electron can also ionize another H2 molecule. A value for the total rate of both direct and secondary ionization of H2 is not entirely agreed upon, but a conservative value of
| (1) |
has been obtained both for H measurements in the ISM (Indriolo et al., 2007) and from theoretical estimations based on measured cosmic-ray spectra (Cecchi-Pestellini & Aiello, 1992; Micelotta et al., 2011).
The emitted electron then hits another (neutral) H2 molecule, which leaves it in an excited electronic state (Sternberg et al., 1987; Riahi et al., 2006), after which it spontaneously decays to the excited vibrational states of the and levels. In the subsequent decay to excited vibrational states of the ground electronic level of H2, Lyman and Werner photons are emitted in the 90-170 nm range. These cosmic-ray-induced UV photons can then either ionize/dissociate a gas species or hit a dust grain.
We define the CRUV photoprocess efficiency as the fraction of CRUV photons that dissociate a species and are not locally absorbed by the gas or dust:
| (2) |
Here is the emission probability profile of a CRUV photon, is the photoprocess cross section (in cm2 per species), and is the total (gas+dust) cross section, which is a measure of the local extinction. If a given species with a high CRUV cross section is very abundant in the gas phase, the photo rate of that species will have a maximum value and will be low for all other species in the gas. This shielding effect cannot be ignored in regions where high-density/temperature combinations create a gas-rich environment.
Finally, cosmic rays can directly heat dust grains and cause desorption of ices. We took this effect into account, but it is more predominant in outer regions of the disk.
3.1 CRUV emission probability profile
The emission probability profile of CRUV is obtained from the transition probability of the first three electronic levels ( and ) of molecular hydrogen. The cross section for excitation of H2 into a level is proportional to the optical band oscillator strength .
| (3) |
We use proportionality here, as it is enough to obtain a normalized emission probability profile. The oscillator strength is
| (4) |
Here is the statistical weight. The emission probability for a transition from the level of an electronically excited state to the level of the ground electronic state is then proportional to the Einstein coefficient for emission and the cross section for excitation:
| (5) |
This probability is normalized over all transitions to levels of the ground electronic state:
| (6) |
Each transition probability is then convolved into a Voigt line profile to account for both natural and thermal broadening:
| (7) |
The emission probability profile for each excited electronic state is then
| (8) |
Thus, the probability that a CRUV photon will be emitted after an H2 cosmic-ray ionization process is
| (9) |
This probability is normalized over the frequency range (90-170 nm). We obtained the Einstein coefficients and the frequencies for the relevant transitions from the tables of Abgrall et al. (2000), and the statistical weights were calculated from the guidelines in Appendix A of Ochkin & Kittell (2009).
3.2 CRUV gas opacity
The total cross section in Eq. (2) is (in cm2 per hydrogen atom)
| (10) |
Here is the grain albedo, is the abundance of the species , and is the grain UV extinction cross section per hydrogen atom. We refer the reader to Eq. (10) in Chaparro Molano & Kamp (2012) to see how the cross section relates to the dust UV opacity and other dust parameters in Table 2. Since the dust UV extinction curve is fairly flat in the CRUV frequency range, we used a frequency average for this value. Due to photon conservation, the previous expression leads to the following relation:
| (11) |
Here is
| (12) |
Thus measures the fractional contribution from the species to the CRUV extinction. The shape of the radiation field that dissociates or ionizes a species not only depends on the CRUV emission probability, but also on the CRUV extinction of all other species :
| (13) |
The frequency-dependent opacity for a species can be written as
| (14) |
Here =, with being the mean molecular weight (see Table 2). We can now define a “gray” (frequency averaged) opacity as
| (15) |
Using Eqs. (13) and (14) this expression can be rewritten as
| (16) |
With this expression, we can accurately measure the opacity of each species throughout a time-dependent chemistry run. The variables , and are calculated at every timestep of the simulation as part of the CRUV photoprocess rate calculation. Given that the CRUV photoprocess rate constant , the resulting rate is then coupled to the abundance of all other species that contribute to the opacity.
| Type | Symbol |
|---|---|
| Atoms | H, He, C, O, S, Si, Mg, Fe |
| Ions | He+, Si+, Fe+, H-, H+, C+, |
| O+, S+, Mg+ | |
| Molecules | H2, H2O, CH2, HCO, SiO, CO2, |
| SiH, CH3, CH4, OH, O2, CO, CH, H2CO | |
| Molecular | HCO+, CH, H, SiH+, SiO+, |
| Ions | CH, H3O+, H3O+, SiH, CH, |
| CH, H2O+, SiOH+, CH+, H, | |
| O, CO+, OH+, CO | |
| Ice | C#, CO#, CO2#, CH3#, CH4#, |
| O#, O2#, OH#, H2O#, | |
| Si#, SiH#, SiO#, Fe#, Mg# |
Since photoionization/dissociation of species can be continuum and/or line processes, we convolved the line photoprocess cross sections with a Voigt profile in order for both natural and Doppler line broadening. The total cross section is then the sum of the line and continuum processes for each molecule. Values for the cross sections were obtained from the tables in the Leiden photoprocess database hosted by E. van Dishoeck http://www.strw.leidenuniv.nl/~ewine/photo/ (van Dishoeck et al., 2006).
It is safe to consider only the effects of dust CRUV extinction if we know a priori that most of the gas species are frozen onto the surface of grains. This means that if gas phase abundances are low enough to be neglected in Eq. (10), dust grains will be the sole contributor to opacity. This approach is frequently taken in models that include CRUV photoprocesses (Sternberg et al., 1987; Gredel et al., 1987, 1989; Woodall et al., 2007), mostly because it is valid for ISM and molecular cloud conditions (low molecular gas abundances).
At 10 AU the environment is cold enough (=20 K, =1010 cm-3) to study the chemical evolution without taking into account the gas opacity (Chaparro Molano & Kamp, 2012). Under these conditions, the CRUV rate constant takes a simplified form that does not depend on species abundances.
4 Chemical model
The code chem_compact, described in our previous paper (Chaparro Molano & Kamp, 2012), is our VODE based (Brown et al., 1989) gas/grain chemical rate equation solver. In it we include a reaction network based on the Umist06 database for astrochemistry (Woodall et al., 2007) including H2 formation on grains (Cazaux & Tielens, 2002) and ad/desorption reactions: Adsorption and thermal and stellar UV photodesorption from Aikawa et al. (1996); Leger et al. (1985); Öberg et al. (2009), cosmic-ray direct desorption from Hasegawa & Herbst (1993) and cosmic-ray-induced photodesorption from Roberts et al. (2007). Surface reactions are not considered because they are beyond the scope of this paper.
Table 3 lists all gas and ice species considered in our model. In this work we use the low metal initial abundances from Jenkins (2009), where absorption lines of these metals are measured222Despite assuming significant metal depletion, the metal abundances here are about a factor 10 higher than in Graedel et al. (1982) or Lee et al. (1996). from various clouds against a bright background star. The low abundances imply that Si, Fe, and Mg condense into dust grains before the formation of the disk. This is particularly relevant for the formation of SiO and its maximum abundance levels, although formation of CO and H2O is not affected.
Initial conditions for our disk model were obtained by running our chemical evolution code under molecular cloud conditions ( K, cm-3) from atomic low-metallicity abundances. The resulting abundances after 107 yr were used as initial conditions. Table 4 lists the initial abundances for the molecular cloud run (atomic) and those for the disk model. Atomic abundances (column 2 in Table 4) were used as input for the molecular cloud run, which yielded the molecular abundances (column 4 in Table 4) that we took as initial abundances for our disk model.
We decided to ignore sulphur chemistry beyond ionization of atomic S because its chemical network is only weakly coupled to CO formation and is decoupled from other species considered here (Sternberg & Dalgarno, 1995). Atomic sulphur was included as it contributes to the metallicity, and its ionization can be an important source of charge exchange for other species. By ignoring other S-bearing species, we can still arrive at an upper limit for the importance of atomic S in the CRUV gas opacity.
To estimate the effects of gas opacity in the CRUV photoprocess rates and therefore in the chemical evolution, we replaced the relevant rates from the umist (Woodall et al., 2007) database with our own rates (Sect. 3). As these rates depend on , we recalculated them at every timestep, using the new values for the gas abundances. This means that at every timestep, the integral in Eq. (2) needs to be evaluated from the previous timestep.
5 Results
| Species | Abundance | Species | Abundance |
|---|---|---|---|
| (Atomic) | (Molecular) | ||
| H | 1 | H2 | 5.00 |
| He | 8.51 | He | 8.51 |
| O | 3.31 | CO | 1.76 |
| C | 1.78 | H2O# | 1.09 |
| Fe | 5.01 | O | 3.55 |
| Mg | 2.24 | OH | 5.66 |
| S | 1.90 | Fe# | 5.01 |
| Si | 1.78 | H | 2.56 |
| H2O | 2.55 | ||
| Mg# | 2.24 | ||
| S | 1.73 | ||
| H2CO# | 1.63 | ||
| SiO# | 1.02 |
| Species | (cm2) | Req. | Req. |
|---|---|---|---|
| (i) | (90-170 nm) | (PPD) | (ISM) |
| C | 3.85 | 3.98 | 5.20 |
| CH | 6.61 | 2.31 | 1.68 |
| CH+ | 4.86 | 3.15 | 4.12 |
| CH2 | 1.50 | 1.02 | 9.47 |
| CH3 | 1.32 | 1.16 | 1.52 |
| CH4 | 6.13 | 2.50 | 3.26 |
| OH | 7.82 | 1.96 | 2.56 |
| H2O | 4.00 | 3.83 | 2.87 |
| Fe | 1.80 | 8.49 | 1.11 |
| Mg | 9.20 | 1.66 | 4.12 |
| CO | 1.82 | 8.40 | 1.10 |
| Si | 2.14 | 7.14 | 9.33 |
| HCO | 2.99 | 5.12 | 6.69 |
| SiH | 6.35 | 2.41 | 3.15 |
| H2CO | 3.58 | 4.27 | 5.59 |
| O2 | 7.20 | 2.13 | 5.77 |
| S | 3.36 | 4.55 | 5.95 |
| CO2 | 9.10 | 1.68 | 5.81 |
| SiO | 2.07 | 7.41 | 9.68 |
To estimate the relevance of gas opacity for protoplanetary disks, we used an estimate of the gas ionization and photodissociation cross sections from Gredel et al. (1989) to compute the mean photo dissociation cross section for various species in the wavelength range of CRUV photons (90-170 nm). Using this value, we computed the abundance that is required for an individual species to produce a gas opacity equal to the dust opacity. We did this for both molecular cloud and protoplanetary disk dust properties.
H2 does not contribute to the opacity because most of it is in the fundamental vibrational level of the ground electronic state . Therefore it is unable to absorb CRUV that are generated in transitions from excited electronic states to vibrationally excited levels of the state.
Using the results from Table 5, we can check to which extent the simplifying assumption holds that gas opacity is negligible compared to that of the dust for CRUV photoprocesses. At regions located at distances of r8 AU chemical abundances of the listed molecules easily exceed the boundary values of Table 5. This means that the effects of gas opacity have to be included in chemical models of the midplane of protoplanetary disks inside 10 AU.
5.1 Chemistry at 1 AU
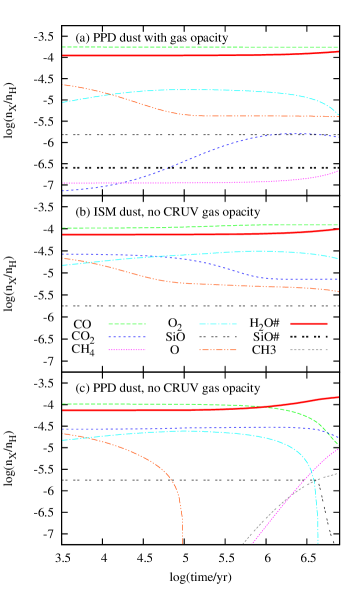
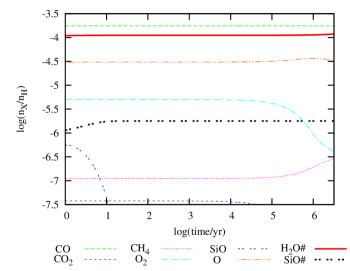
In this region, the moderately high temperature (80 K) ensures that most of the chemical species stay in the gas phase. Adsorption of gas phase H2O is much more efficient than thermal desorption, which causes gas phase H2O to have a very low abundance. CO, O2, CO2, SiO, CH4, and oxygen in atomic form are the dominant species in the gas phase, whereas H2O and to a lesser extent SiO are the only species with a significant ice abundance. Fig. 2a shows the time-dependent evolution of the species abundances when considering an appropriate protoplanetary disk dust size distribution333Our choice of dust size distribution parameters is typical of a Class II source, but limited to current knowledge based on observations. and including the effects of CRUV gas opacity.
CO is very abundant in the initial conditions run, and remains the most abundant species besides H2. CO is kept at this level through two main pathways. It can be photodissociated by CRUV into C and O, which later recombine in the following way:
| (17) |
CO is mainly formed via electron recombination of HCO+. However, SiO also acts as a catalyst for the formation of CO because its reaction with HCO+ is very rapid. Hence, whenever SiO is present, it efficiently converts HCO into CO, without SiO having to be very abundant itself. The OH to SiO to CO chemical pathway is the following:
| (18) |
HCO+ is formed in the reaction of CO with H, which as noted above in Section 3 is a byproduct of cosmic-ray ionization of H2. This cycle ensures a steady supply of OH as a primer for sustained formation of SiO and CO, as seen in Fig. 2ab.
CH4 is also steadily formed from He+ ionization of CO:
| (19) |
although at a very low abundance (10-7). The latter part of that reaction is curbed because the first step is reversed by O2:
| (20) |
Atomic oxygen is depleted after 104 yr, favoring the formation of O2 and CO2. Abundances of CO2 along with OH are enhanced due to the reactions
| (21) |
The OH enhancement is also curbed by the very efficient O2/CO2 formation reactions, which help keep the atomix oxygen abundance low:
| (22) |
| (23) |
Atomic oxygen is constantly generated thanks to the steady CRUV photodissociation of CO, O2, and CO2. This atomic oxygen partly goes into the formation of water vapor, which is promptly adsorbed onto the grain surface due to the temperature and density conditions at 1 AU:
| (24) |
This water vapor formation pathway explains the long-term ability of the system to keep forming water ice, through which it becomes the main oxygen reservoir at very long timescales. OH is recovered partly from SiOH+ and also from the following H3O+ reaction, which can form water or OH at the same branching ratio:
| (25) |
Combining reactions (18) and (25) we can see how near the end, the oxygen in O2 transfers to H2O :
| (26) |
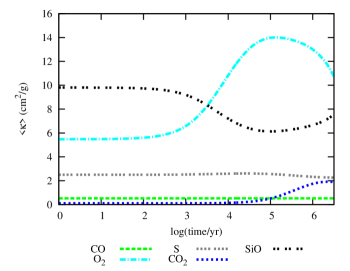
Gas-phase water created in the previous reaction freezes out almost immediately, as mentioned above (see Fig. 2a). In Fig. 3 we can see that after 104 yr the gas opacities reach a maximum of about 40% with respect to the dust opacity, which remains constant444For simplicity, we did not include self-consistent grain growth models here.. The late O2 enhancement (Fig. 2a) implies that it is providing most of the CRUV gas extinction, and consequently SiO absorbs fewer CRUV photons. Thus O2 slows down atomic oxygen formation via photodissociation of SiO, which is a more efficient formation mechanism than the CRUV photodissociation of O2. This causes a rebound effect after 105 yr, as O2 needs a constant supply of atomic oxygen to form. Because OH is free to react with CO (instead of reacting with O), CO2 formation is enhanced. However, CRUV photodissociated atomic oxygen from SiO and CO is necessary to sustain CO2 production via reaction (21). This causes CO2 to reach a saturation level near the end of the simulation.
| Ratio | With gas | No gas opacity | |
|---|---|---|---|
| opacity, yr | |||
| H2O#/CO | 0.69 | 1 | 0.66 |
| O2/CO | 0.09 | 0.19 | 0.28 |
| CO2/CO | 0.01 | 0.33 | 0.07 |
| CH4/CO | 710-4 | 210-3 | 10-5 |
5.1.1 Comparison to our previous work
To understand the effects of gas opacity, we also ran the simulation considering dust as the only sink for CRUV photons. We used the simplified formula for CRUV photoprocess rates from Chaparro Molano & Kamp (2012), where the total extinction cross section is simply the grain extinction cross section. Since this calculation is not dependent on the gas phase abundances, the rate coefficients are constant throughout the simulation.
When considering a UV extinction cross section based on a protoplanetary disk dust size distribution, the CRUV photon flux is higher than for ISM dust parameters (Chaparro Molano & Kamp, 2012). This is because dust coagulation processes in protoplanetary disks increase the average size of dust grains, which in turn decreases the effective area for dust absorption of UV photons. For protoplanetary disk conditions the UV extinction cross section is 13.5 times lower than the typical ISM value, cm-1.
Fig. 2b shows the time-dependent evolution of the chemical abundances for the ISM-like dust parameters used adopted for the calculation of CRUV rates in Umist. Here, the main carriers of carbon are CO and CO2, followed by the slightly less abundant CH4 and CH3. After a few 105 years the carbon is almost equally divided among CH4, CO, and CO2. SiO is the second most important gas phase oxygen carrier up to a few Myr, when it stops to form. This is because the grains are cool enough to hold a large amount of water ice on their surface, effectively stopping OH formation and the SiO formation pathway (18). As the oxygen in CO, CO2, and SiO is transfered to water ice near the end of the disk lifetime, carbon binds with H and H2, which enhances the formation rates of molecules such as CH3 and CH4.
When comparing the chemical evolution obtained when using ISM dust parameters (Fig. 2b) vs. appropriate protoplanetary disk dust parameters (Fig. 2c), the impact of the larger CRUV flux on the abundance of various species is evidenced. As mentioned above, CRUV photodissociation processes are up to 13.5 times more efficient in protoplanetary disks than when estimated using the interstellar UV extinction cross section value used in Umist (Chaparro Molano & Kamp, 2012). Because the effects of gas extinction are neglected, the CRUV flux is enhanced uniformly for all species. This affects specifically the long-term formation of SiO, O2, and hydrocarbons. For instance, CH3 and CH4 are not efficiently formed because they are very sensitive to CRUV photoprocesses. CH4 photodissociates into CH2, and CH3 photodissociates into CH, CH2 and CH. If the CRUV field is strong enough, CH3 and CH4 will be destroyed at the expense of CO on a timescale similar to their formation timescale.
The CRUV photodissociation of CO, SiO, and CO2 is very efficient for high CRUV fluxes. These photoprocesses steadily produce atomic oxygen at a higher rate than when considering the effects of gas opacity. This efficient formation of atomic oxygen forms OH from HCO in reaction (21) and preserves the OH, SiO cycle in reaction (18). This means that SiO is never depleted even at extremely long timescales (below 108 yr). Even though CO2 is also created from OH at the expense of CO, it never reaches a high abundance because it is destroyed via CRUV photodissociation, which ensures that the CO2 abundances stay low compared to those seen in Fig. 2a.
Most notably, the CO2/CO, O2/CO, and CO/CH3,4 ratios change enormously between the three cases, as shown in Table 6. This shows that the chemical evolution obtained when considering the effects of gas opacity cannot be obtained by a simple interpolation between a low and a high CRUV field, but it has to be studied for each species separately.
5.2 Chemistry at 3-5 AU
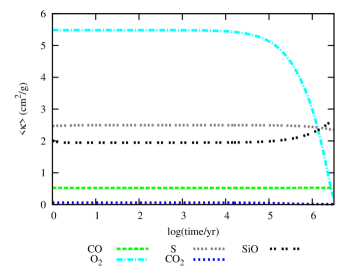
Figure 4 shows the chemical evolution in a region located at 3-5 AU from the central star, where =1012 cm-3 and =65 K (Woitke et al., 2009). In this region, reactions (17) ,(19), (26), and (24) still take place. However, as the temperature here is lower than at 1 AU, SiO is now mostly in the ice phase, and retains a small gas phase abundance. It is kept at a stable but low level throughout the simulation by the following feedback reaction, similar to reaction (18):
| (27) |
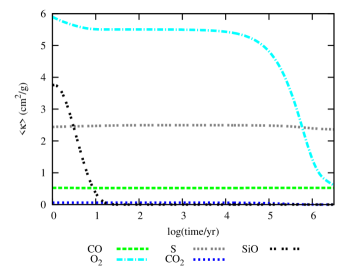
Therfore, OH formation is not as efficient as it was at 1 AU. The low OH formation rate cannot sustain the formation of O2 in reaction (22) when it is forming H2O, and the oxygen in O2 transfers to H2O via reaction 26. As the O2 abundance starts to decrease, the backwards reaction (20) is stopped, which allows CO to form CH4 more efficiently via reaction 19 (see Fig. 4). The consequent decrease in O2 opacity seen in Fig. 5 causes the CRUV photorates to increase for other molecules, as it allows more CRUV photons to dissociate or ionize other species. This is shown in Fig 5, where the SiO opacity increases as the O2 opacity decreases. Now CH4 CRUV photodissociation becomes very efficient at forming CH2, which causes the following reaction
| (28) |
to be favored over reaction (22). This exacerbates the depletion of O2, as seen at the end of the simulation in Fig. 4. The gas opacity in this region (Fig. 5) is less than half the value at 1 AU (Fig. 3, note the different vertical scale), which is caused by the lack of efficient O2 formation and the freeze-out of SiO. The first part of reaction (21) is reversed by the following reaction:
| (29) |
which keeps the CO2 levels low. This is enabled by an increase in effectivity of electron recombination reactions vs. neutral reactions brought about by the low-density conditions, compared to the 1 AU region.
5.3 Chemistry at 7-8 AU
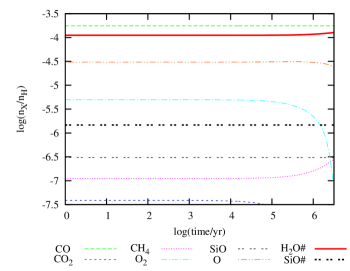
In this region, the physical conditions are =1011 cm-3 and =50 K (Woitke et al., 2009). As we can see from the chemical evolution plot in Fig. 6, H2O and SiO are completely frozen after only 1 yr, with negligible gas phase abundances. However, the chemical evolution for the other significant species remains more or less the same. The lack of SiO in the gas phase impacts the late formation of H2O that appears at 1-5 AU. Since O2 is not consumed via reaction (26, its depletion is not as dramatic as in the 3-5 AU region. Now the main reaction that removes O2 from the gas is
| (30) |
This reaction, which does not have an activation energy barrier and is very rapid at very low temperatures (Smith et al., 2004), allows reaction (19) to form CH4 very late in the simulation in the same way that we observed for the previous region (3-5 AU). Reactions (17,22,24) are also responsible for the formation of CO, O2, and H2O, respectively. Just as in the 3-5 AU region, CO2 is not efficiently formed because its formation via reaction (21) is stopped by the backreaction (29). The gas opacity here (Fig. 7) is very similar to that observed at 3-5 AU (Fig. 5). The absence of SiO opacity due to freeze-out enhances the CRUV rates for all other species, including CO.
6 Discussion
We have included the gas opacity of all atoms and molecules that are photoprocessed by cosmic-ray-induced UV photons in our chemical evolution model. By doing this, we were able to assess whether a given species is relevant for the extinction of CRUV in the midplane of a protoplanetary disks. By studying the impact that the gas opacity of individual species has on the chemistry and vice versa, we can simplify the chemical model by including only the most important species. As some opacities increase, an important shielding effect appears and changes the CRUV photoprocess rates. This affects the chemical formation pathways for both gas- and ice-phase species.
As discussed in Section 4, the most important species that contribute to the gas opacity are O2, SiO, S, CO, and CO2 consistently throughout the 1-10 AU region of the disk midplane. We found that the opacities of O2, SiO (and CO2 in the warm regions around 1 AU) are the most variable in time and hence are the ones that require most attention. As the CO abundance remains more or less constant in those regions, its opacity remains fairly constant as well. Even though we did not include sulphur chemistry beyond ionization, its CRUV opacity ranges from 2.5 to 3.5 cm2/g gas (see Figs. 3, 5, 7 and 8), reaching its highest contribution with respect to the total gas opacity (70%) and with respect to the total dust and gas opacity (3.4%) at 10-15 AU.
When comparing the gas opacity to the total CRUV opacity in Table 7, it is evident that its effect cannot be easily dismissed. In the region 1-2 AU the contribution from the gas is up to 30% of the combined gas and dust opacity. At 7-8 AU, the contribution is up to 10%, mostly because of SiO freeze-out. Finally, at 10 AU the temperature becomes sufficiently low to freeze CO, CO2 and CH4 onto the grain surface, and the contribution of the gas opacity becomes very low (5%). Therefore, future chemical models that aim to include this treatment of CRUV gas and dust opacity can consider the contribution of the most significant species that our models yield for the probed regions of the disk.
The general chemical composition of the disk midplane obtained using our models compare favorably to that in Walsh et al. (2010), particularly in the freeze-out of water at distances above 1 AU, and in the significant gas phase presence of CO (and CO2 to a lesser degree) throughout the studied region. We notice the same low abundances of H2CO and OH. These similarities are caused by the temperature structure, which controls the adsorption and desorption processes.
6.1 The role of OH
The availability of OH caused by the high and steady abundance of SiO at 1 AU causes a late O and O2 enhancement. The products of SiO dissociation later form H3O+, which via dissociative recombinations (Si, e-) forms water vapor. Atomic oxygen is very abundant at 1 AU thanks to cosmic-ray-induced dissociation of CO and SiO. However, oxygen-driven OH formation acts as a catalyst for steady CO formation. A rebound effect is observed at a late stage (105 yr), as O2 self-shields the CRUV photons that drive the OH driven pathways for its formation.
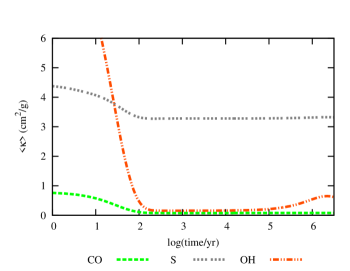
Even though SiO is formed in reaction (18) at 3-5 AU, under these conditions it is very efficiently adsorbed onto the grain surface. This affects the formation of OH and thus O2 is depleted at long timescales, favoring CO formation via CH4 and later CH2 reactions with O. As the gas phase SiO is depleted, no O2 is transformed into H2O, which avoids the complete depletion of O2. At 7-8 AU there is an overall enhancement of CRUV rates because of this. After 10 AU, the total gas opacity is sufficiently low for OH to drive the chemistry. Indeed, Fig. 8 shows the gas opacity at 10 AU, in which OH is seen to contribute. This agrees with the results from our previous research paper (Chaparro Molano & Kamp, 2012).
| Distance | Total gas opacity (cm2/g gas) | ||
|---|---|---|---|
| 104 yr | 105 yr | 106 yr | |
| 1 AU | 23.6 (25.8%) | 25.4 (27.2%) | 26.7 (28.2%) |
| 3-5 AU | 11.5 (14.5%) | 11.1 (14%) | 9.2 (12%) |
| 7-8 AU | 9.5 (12.3%) | 9 (11.7%) | 5.4 (7.4%) |
| 10-15 AU | 3.6 (5%) | 3.7 (5.2%) | 4.2 (5.8%) |
6.2 Survival of SiO in the region
The longevity of SiO in our models of the disk midplane (see Figs. 2a and 4) could have potential consequences beyond the midplane of the disk. We explored the chemistry at 1 AU in a direction perpendicular to the disk plane upwards to densities of cm-3. We saw that the abundance of SiO remains steadily high, meaning that SiO can be formed even above the midplane.
Following Aikawa (2007), the vertical drift timescale of a molecule formed in the midplane of the disk that moves up to a distance above the midplane can be estimated via the disk viscosity555The value of depends on the sound speed , the scale height of the disk and the Shakura Sunyaev parameter, for which we chose a value of 0.1 corresponding to a young disk with . This mass accretion rate value suggests an age for the disk in the range 105.5-106.5 yr, according to Hartmann et al. (1998). (Shakura & Sunyaev, 1973):
| (31) |
A simple calculation for AU, corresponding to the region (at AU) of the disk, yields
| (32) |
If the SiO photodissociation timescale at is longer than the vertical drift timescale, it should be possible for SiO to accumulate on the surface where it could be observed. We can roughly estimate this timescale, which depends on the strength of the local UV field . Using the detailed radiative transfer model of Woitke et al. (2009), we derive a value for in the range 1-10 at the line. Accordingly, an SiO molecule can survive for approximately 103 yr if . This means that it may be possible for SiO to accumulate around and be detectable. For example, SiO masers are detected in the circumstellar regions around asymptotic giant branch (AGB) stars, and their maser lines are found to originate from regions below the dust evaporation radius (Habing, 1996). More recently, gas phase SiO has been detected in the debris disk around Corvi (Lisse et al., 2012). Hence it should be possible to detect accumulated SiO even if there are dust grains present. Our low ISM metal abundances already take Si incorporation into dust grains into account. Given that the region where SiO is being formed has a small radial extent ( AU), detection of SiO could prove to be very difficult in the near future, except for high-sensitivity, high-spatial-resolution observations that ALMA could carry out.
7 Conclusions
We have developed a tool for including the effects of gas extinction of cosmic-ray-induced UV photons in the chemical evolution in the disk midplane. The most important species that contribute to the gas opacity in the 1-8 AU region of the disk midplane are O2, SiO, S, CO, and CO2. Because the CO abundance is steady in those regions, its opacity remains fairly constant as well. Even though CO competes with water ice for being the most abundant species, CO is not a major contributor to the opacity, whereas CO2 play a more important role in the opacity while not being as chemically abundant as CO.
We find that the opacities of O2, SiO (and CO2 in the warm regions around 1 AU) are highly variable in time, and their effects on the gas and ice chemistry cannot be easily dismissed. Therefore, future models should include the gas opacity of these species in the calculation of CRUV photoprocess rates.
As most of the emission in recent IR observations of OH and H2O in disks (Carr & Najita, 2008; Najita et al., 2010; Fedele et al., 2011; Meeus et al., 2012) is likely coming from layers well above the midplane, the catalytic role of OH in the midplane is not necessarily something we can prove by observing its surface abundance.
Finally, we found that if SiO is steadily created in the midplane at long timescales, it can drift vertically upwards and accumulate around the region, which suggests a possibility for future detections of SiO in protoplanetary disks.
Appendix A Cross section data
| Species | Proc. | Products | Source | Type |
|---|---|---|---|---|
| C | Ion. | C++e- | Leiden | Cont. |
| CH | Dis. | C+H | Leiden | Line/Cont. |
| CH+ | Dis. | C++H | Leiden | Line/Cont. |
| CH2 | Ion. | CH+e- | UMIST06 | Cont. |
| (Gredel et al., 1989) | ||||
| CH2 | Dis. | CH+H | Leiden | Line/Cont. |
| CH3 | Ion. | CH+e- | UMIST06 | Cont. |
| (No ref. data) | ||||
| CH3 | Dis. | CH2+H | Leiden | Line |
| CH3 | Dis. | CH+H2 | Leiden | Line |
| CH4 | Dis. | CH2+H2 | Leiden | Line/Cont. |
| OH | Dis. | O+H | Leiden | Line/Cont. |
| H2O | Dis. | OH+H | Leiden | Cont. |
| Mg | Ion. | Mg++e- | Leiden | Line/Cont. |
| CO | Dis. | C+O | Leiden | Line |
| Si | Ion. | Si++e- | Leiden | Cont. |
| HCO | Dis. | CO+H | Leiden | Line |
| HCO | Ion. | HCO++e- | UMIST06 | Cont. |
| (Gredel et al., 1989) | ||||
| SiH | Dis. | Si+H | Leiden | Line |
| H2CO | Dis. | CO+H2 | Leiden | Line/Cont. |
| O2 | Dis. | O+O | Leiden | Line/Cont. |
| O2 | Ion. | O+e- | Leiden | Line |
| S | Ion. | S++e- | Leiden | Cont. |
| CO2 | Dis. | CO+O | Leiden | Line/Cont. |
| SiO | Dis. | Si+O | Leiden | Line |
| Fe | Ion. | Fe++e- | Leiden | Cont. |
Table 8 presents the information on all CRUV photoprocesses considered here, based on the UMIST06 reaction database (Woodall et al., 2007). Column 2 lists whether the photoprocess ionizes or dissociates the species. Column 3 shows the products of the reaction. Column 4 references the source for the photoprocess cross section, which for most of them is Ewine van Dishoeck’s Leiden photoprocess database http://www.strw.leidenuniv.nl/ ewine/photo/ (van Dishoeck et al., 2006). Column 5 refers to whether the photoprocess is a discrete and/or continuum absorption process.
Acknowledgements.
We would like to thank Malcolm Walmsley for asking the basic question that triggered this research.References
- Abgrall et al. (2000) Abgrall, H., Roueff, E., & Drira, I. 2000, A&AS, 141, 297
- Aikawa (2007) Aikawa, Y. 2007, ApJ, 656, L93
- Aikawa et al. (1996) Aikawa, Y., Miyama, S. M., Nakano, T., & Umebayashi, T. 1996, ApJ, 467, 684
- Aresu et al. (2011) Aresu, G., Kamp, I., Meijerink, R., et al. 2011, A&A, 526, A163
- Brown et al. (1989) Brown, P. N., Byrne, G. D., & Hindmarsh, A. C. 1989, SIAM J. Sci. Stat. Comput., 10, 1038
- Carr & Najita (2008) Carr, J. S. & Najita, J. R. 2008, Science, 319, 1504
- Cazaux & Tielens (2002) Cazaux, S. & Tielens, A. G. G. M. 2002, ApJ, 575, L29
- Cecchi-Pestellini & Aiello (1992) Cecchi-Pestellini, C. & Aiello, S. 1992, MNRAS, 258, 125
- Chaparro Molano & Kamp (2012) Chaparro Molano, G. & Kamp, I. 2012, A&A, 537, A138
- D’Alessio et al. (2001) D’Alessio, P., Calvet, N., & Hartmann, L. 2001, ApJ, 553, 321
- Fedele et al. (2011) Fedele, D., Pascucci, I., Brittain, S., et al. 2011, ApJ, 732, 106
- Fedele et al. (2010) Fedele, D., van den Ancker, M. E., Henning, T., Jayawardhana, R., & Oliveira, J. M. 2010, A&A, 510, A72
- Glassgold et al. (2007) Glassgold, A. E., Najita, J. R., & Igea, J. 2007, ApJ, 656, 515
- Gorti et al. (2011) Gorti, U., Hollenbach, D., Najita, J., & Pascucci, I. 2011, ApJ, 735, 90
- Graedel et al. (1982) Graedel, T. E., Langer, W. D., & Frerking, M. A. 1982, ApJS, 48, 321
- Gredel et al. (1987) Gredel, R., Lepp, S., & Dalgarno, A. 1987, ApJ, 323, L137
- Gredel et al. (1989) Gredel, R., Lepp, S., Dalgarno, A., & Herbst, E. 1989, ApJ, 347, 289
- Habing (1996) Habing, H. J. 1996, A&A Rev., 7, 97
- Haisch et al. (2010) Haisch, Jr., K. E., Barsony, M., & Tinney, C. 2010, ApJ, 719, L90
- Hartmann et al. (1998) Hartmann, L., Calvet, N., Gullbring, E., & D’Alessio, P. 1998, ApJ, 495, 385
- Hasegawa & Herbst (1993) Hasegawa, T. I. & Herbst, E. 1993, MNRAS, 261, 83
- Herbst & Klemperer (1973) Herbst, E. & Klemperer, W. 1973, ApJ, 185, 505
- Indriolo et al. (2007) Indriolo, N., Geballe, T. R., Oka, T., & McCall, B. J. 2007, ApJ, 671, 1736
- Jenkins (2009) Jenkins, E. B. 2009, ApJ, 700, 1299
- Lee et al. (1996) Lee, H.-H., Bettens, R. P. A., & Herbst, E. 1996, A&AS, 119, 111
- Leger et al. (1985) Leger, A., Jura, M., & Omont, A. 1985, A&A, 144, 147
- Lisse et al. (2012) Lisse, C. M., Wyatt, M. C., Chen, C. H., et al. 2012, ApJ, 747, 93
- Meeus et al. (2012) Meeus, G., Montesinos, B., Mendigutía, I., et al. 2012, A&A, 544, A78
- Micelotta et al. (2011) Micelotta, E. R., Jones, A. P., & Tielens, A. G. G. M. 2011, A&A, 526, A52
- Najita et al. (2010) Najita, J. R., Carr, J. S., Strom, S. E., et al. 2010, ApJ, 712, 274
- Öberg et al. (2009) Öberg, K. I., van Dishoeck, E. F., & Linnartz, H. 2009, A&A, 496, 281
- Ochkin & Kittell (2009) Ochkin, V. & Kittell, S. 2009, Spectroscopy of low temperature plasma (Wiley-VCH)
- Padovani & Galli (2011) Padovani, M. & Galli, D. 2011, A&A, 530, A109
- Prasad & Tarafdar (1983) Prasad, S. S. & Tarafdar, S. P. 1983, ApJ, 267, 603
- Riahi et al. (2006) Riahi, R., Teulet, P., Ben Lakhdar, Z., & Gleizes, A. 2006, Eur. Phys. J. D, 40, 223
- Roberts et al. (2007) Roberts, J. F., Rawlings, J. M. C., Viti, S., & Williams, D. A. 2007, MNRAS, 382, 733
- Semenov et al. (2010) Semenov, D., Hersant, F., Wakelam, V., et al. 2010, A&A, 522, A42
- Semenov & Wiebe (2011) Semenov, D. & Wiebe, D. 2011, ApJS, 196, 25
- Semenov et al. (2004) Semenov, D., Wiebe, D., & Henning, T. 2004, A&A, 417, 93
- Shakura & Sunyaev (1973) Shakura, N. I. & Sunyaev, R. A. 1973, A&A, 24, 337
- Shen et al. (2004) Shen, C. J., Greenberg, J. M., Schutte, W. A., & van Dishoeck, E. F. 2004, A&A, 415, 203
- Smith et al. (2004) Smith, I. W. M., Herbst, E., & Chang, Q. 2004, MNRAS, 350, 323
- Sternberg & Dalgarno (1995) Sternberg, A. & Dalgarno, A. 1995, ApJS, 99, 565
- Sternberg et al. (1987) Sternberg, A., Dalgarno, A., & Lepp, S. 1987, ApJ, 320, 676
- Thi et al. (2011) Thi, W.-F., Woitke, P., & Kamp, I. 2011, MNRAS, 412, 711
- Umebayashi & Nakano (1981) Umebayashi, T. & Nakano, T. 1981, PASJ, 33, 617
- van Dishoeck et al. (2006) van Dishoeck, E. F., Jonkheid, B., & van Hemert, M. C. 2006, Faraday Discussions, 133, 231
- van Zadelhoff et al. (2001) van Zadelhoff, G.-J., van Dishoeck, E. F., Thi, W.-F., & Blake, G. A. 2001, A&A, 377, 566
- Visser et al. (2011) Visser, R., Doty, S. D., & van Dishoeck, E. F. 2011, A&A, 534, A132
- Visser et al. (2009) Visser, R., van Dishoeck, E. F., Doty, S. D., & Dullemond, C. P. 2009, A&A, 495, 881
- Walsh et al. (2010) Walsh, C., Millar, T. J., & Nomura, H. 2010, ApJ, 722, 1607
- Willacy & Woods (2009) Willacy, K. & Woods, P. M. 2009, ApJ, 703, 479
- Woitke et al. (2009) Woitke, P., Kamp, I., & Thi, W. 2009, A&A, 501, 383
- Woodall et al. (2007) Woodall, J., Agúndez, M., Markwick-Kemper, A. J., & Millar, T. J. 2007, A&A, 466, 1197