Updated Analysis of a “Dark” Galaxy and its Blue Companion
in the Virgo Cloud H I 122501
Abstract
H I 122501 is an intergalactic gas cloud located on the outskirts of Virgo cluster. Its main components are two large clumps of comparable H I masses () separated by about 100 kpc. One of the clumps hosts a blue low-surface-brightness galaxy 12270136, while the other has no identified stellar emission and is sometimes referred to as a promising candidate of a “dark galaxy”, an optically invisible massive intergalactic system. We present a deep optical image covering the whole H I 122501 structure for the first time, as well as a collection of archival data from ultraviolet to far-infrared (IR) spectral region of the brightest knot “R1” in 12270136. We find that R1 has a young stellar population of age 10–100 Myr and mass , near-IR excess brightness which may point to the presence of hot dust with color temperature K, and relatively faint mid- to far-IR fluxes corresponding to the dust mass of up to . Overall, it seems to share the general properties with low-metallicity blue compact dwarf galaxies. On the other hand, no optical counterpart to the other clump is found in our deepest-ever image. Now the limiting surface brightness reaches down to mag arcsec-2 for any emission extended over 10″ (comparable to R1), which is more than one hundred times fainter than the brightest part of the companion galaxy 12270136.
Subject headings:
Galaxies: dwarf — Galaxies: individual: 12270136 — Galaxies: ISM — Galaxies: star formation — intergalactic medium — Radio lines: galaxies1. Introduction
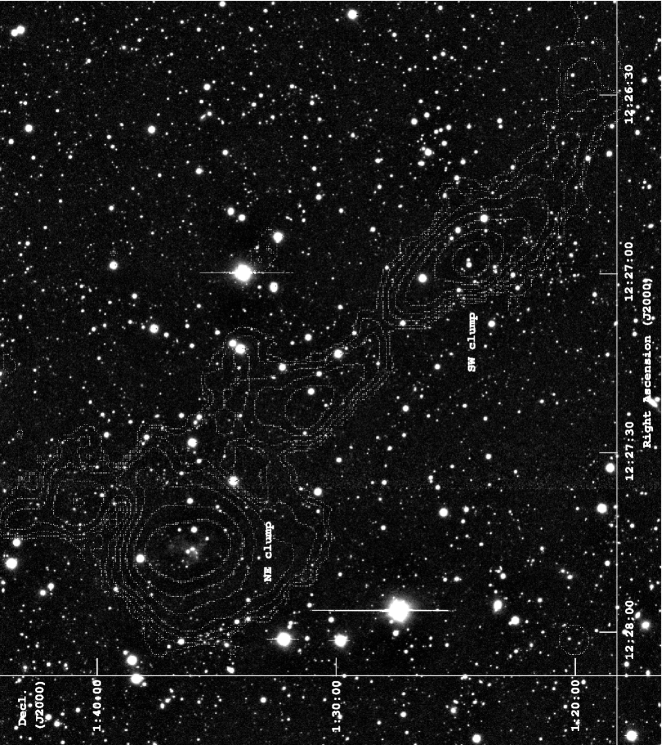
The intergalactic gas cloud H I 122501 was discovered serendipitously in early 1989 during routine 21 cm line observations at the Arecibo 305 m telescope (Giovanelli & Haynes, 1989). It was found at a supposedly blank patch of sky, toward a location which is on the outskirts of Virgo cluster and is close to the supergalactic plane. The systematic redshift was precisely measured (1280 km s-1), but the distance of the cloud is uncertain due to its non-trivial infall motion into Virgo. Giovanelli et al. (1991) proposed it is away by 0.7–1.5 times the distance of Virgo (16 Mpc), depending on model assumptions. H I 122501 has an extended structure across ′, corresponding to the physical scale of kpc where is the distance of the cloud in units of 20 Mpc. It consists of two (NE and SW) clumps separated by 17′, or kpc, and a bridge component connecting them (see Figure 1). A subsequent Very Large Array (VLA) observation (Chengalur et al., 1995) showed that the two clumps have similar peak column densities of about 1 1021 atoms cm-2. The NE clump has a larger H I mass of 2.4 109 , which accounts for a half of the total H I mass in H I 122501. The SW clump has 1.3 109 , and the rest of the mass is contained in the bridge and surrounding faint components.
In spite of the similarity in H I emission features, the two clumps have a crucial difference in their optical counterparts (OCs). Shortly after the discovery of H I 122501, the OC to the NE clump was identified independently by Djorgovski (1990), Impey et al. (1990), and McMahon et al. (1990) on the Second Palomar Sky Survey and the United Kingdom Schmidt Telescope plates. Salzer et al. (1991) presented a detailed optical imaging and spectroscopic study and confirmed that the OC is a blue irregular galaxy with an H II-region like spectrum. The measured oxygen abundance (12 log (O/H) = ) is less than a tenth of the solar value. We call it 12270136 (simply from its J2000.0 coordinate) throughout this paper. The galaxy is very faint, with the central -band surface brightness mag arcsec-2, and is indeed reported as one of the local low-surface-brightness (LSB) galaxies found in deg2 around the celestial equator (Impey et al., 1996). On the other hand, no OC to the SW clump has been identified to date. The latest attempt in search was presented by Turner & MacFadyen (1997), who reached down to 27.2 mag arcsec-2 by modal filtering an -band image obtained by 4.6 hr exposure with the Nickel 1.0 m telescope at Lick observatory. Although the achieved depth is about 4 mag arcsec-2 fainter than the brightest part of 12270136, they failed to detect any optical emission associated with the SW clump. Thus it represents a suggestive candidate of a “dark galaxy”, which may be an optically invisible precursor of a dwarf galaxy as suggested by Salzer et al. (1991).
It is still not clear whether truly dark galaxies, intergalactic large gas clouds without any stellar emission, are existent or not. There are both positive and negative predictions from theoretical models (e.g., Verde et al., 2002; Taylor & Webster, 2005). Their contribution in number and mass to the local Universe provides vital information for structure formation models based on the CDM theory, which are usually tested with (intrinsically) optically visible galaxies (e.g., Matsuoka & Kawara, 2010; Matsuoka et al., 2011a), active galactic nuclei (e.g., Matsuoka et al., 2008; Matsuoka, 2012), and others. Based on the past observations, Briggs (1990) showed that dark galaxies should be extremely rare; space density of objects like H I 122501 is estimated to be a factor of one hundred less than that of galaxies of comparable H I mass. Hunting for such a population is one of the scientific drivers in latest blind H I surveys such as the H I Parkes All Sky Survey (HIPASS) and the Arecibo Legacy Fast Arecibo -band Feed Array (ALFALFA) survey. Although several attempts have been made (e.g., Doyle et al., 2005; Haynes et al., 2011), no secure identification of dark galaxies has been reported yet. In this regard, we note that some of these searches focus on “isolated” dark galaxies without any dynamical companions and do not target clouds like H I 122501. Nonetheless, the SW clump is usually referred to as the current best example of a dark galaxy candidate, therefore its follow-up studies are of great importance as a benchmark for future surveys. Investigations of the companion galaxy 12270136 as well as any optical emission throughout the gas structure are also crucial to resolve the nature of H I 122501 as a whole.
In this paper, we present an updated analysis of the two clumps by exploiting an original deep optical image and a collection of archival data from ultraviolet (UV) to far-infrared (IR) spectral region. Although there are other two clumps, one called the bridge and another to the NNW of the NE clump by 5′, they have not been subjects of intensive studies historically. It is simply because of their less H I mass and lower peak column density by a factor of a few than the main (NE and SW) clumps, and their proximity to the largest (NE) clump which may indicate that they are more likely tidal features of the NE clump. However, we do not intend to deny the possibility that the smaller clumps are intrinsically isolated systems and can be regarded as precursors of dwarf galaxies.
All magnitudes measured in this work are presented on the AB system, while the - and -band magnitudes taken from the literature are based on the Vega system. The distance of H I 122501 is in units of 20 Mpc.
2. Observation
The original deep optical image was obtained as part of our ongoing project (Matsuoka et al., 2011b) to search for 1 excess sources in the United Kingdom Infrared Telescope (UKIRT) Infrared Deep Sky Survey (UKIDSS; Lawrence et al., 2007). We used a wide-field mosaic CCD camera MOA-cam3 mounted at the prime focus of the Microlensing Observations in Astrophysics (MOA) 1.8 m telescope (Sumi et al., 2011). The telescope has been build on Mt. John Observatory, New Zealand, by Nagoya University in collaboration with the University of Canterbury. MOA-cam3 is equipped with ten 2k 4k CCD chips and provides very wide field of view of 2.18 deg2 with 0″.58 pixel scale (Sako et al., 2008). Our project utilizes a special -band filter characterized by broad spectral coverage from = 6200 Å to 8700 Å with the similar effective wavelength to that of the Sloan Digital Sky Survey (SDSS; York et al., 2000) -band filter.
The observations of the H I 122501 field were carried out on nine nights in 2012 January and February. The average seeing was 2″.9 with a significant night-to-night variation (up to 5″). The poor seeing condition is acceptable in this work focusing on extended emission with relatively large (5″) apparent sizes. We obtained 83 shots of 5 minute exposure, for total integration of 6.9 hr. In order to minimize the effects of large scale non-uniformity of the detector sensitivity and fringing, we configured the telescope dithering pattern so that a given field was observed on several different CCD chips.
Data reduction was performed in a standard manner. Dark current signals have been measured on each night of the observations, and were subtracted from the science frames. Flat fielding was achieved by using dome flat images. Fringing patterns of the CCD chips were estimated by stacking flat-fielded science frames without offsetting (that would compensate for the telescope dithering), and removed. Finally the science frames were stacked into a final deep image, after manually removing artifacts such as satellite trails. Photometric calibration was achieved by referring to SDSS -band magnitudes of bright (15–18 mag) stars within the observed field of view. Thanks to the similarity in effective wavelengths of the MOA and SDSS filters, we found a very good linear correlation between the two sets of magnitudes with less than 0.1 mag scatter (root mean square).
3. Results and Discussion
The reduced image of the H I 122501 field (31′ 28′) is presented in Figure 1. On top of the stellar (and nebular) distribution, we show the VLA H I emission map obtained by Chengalur et al. (1995). Our data cover the whole H I structure and provide, to our knowledge, the deepest-ever image of the field. We first derive some physical properties of the OC to the NE clump, 12270136, and then present the results on a search for optical emission from other regions.
3.1. NE clump
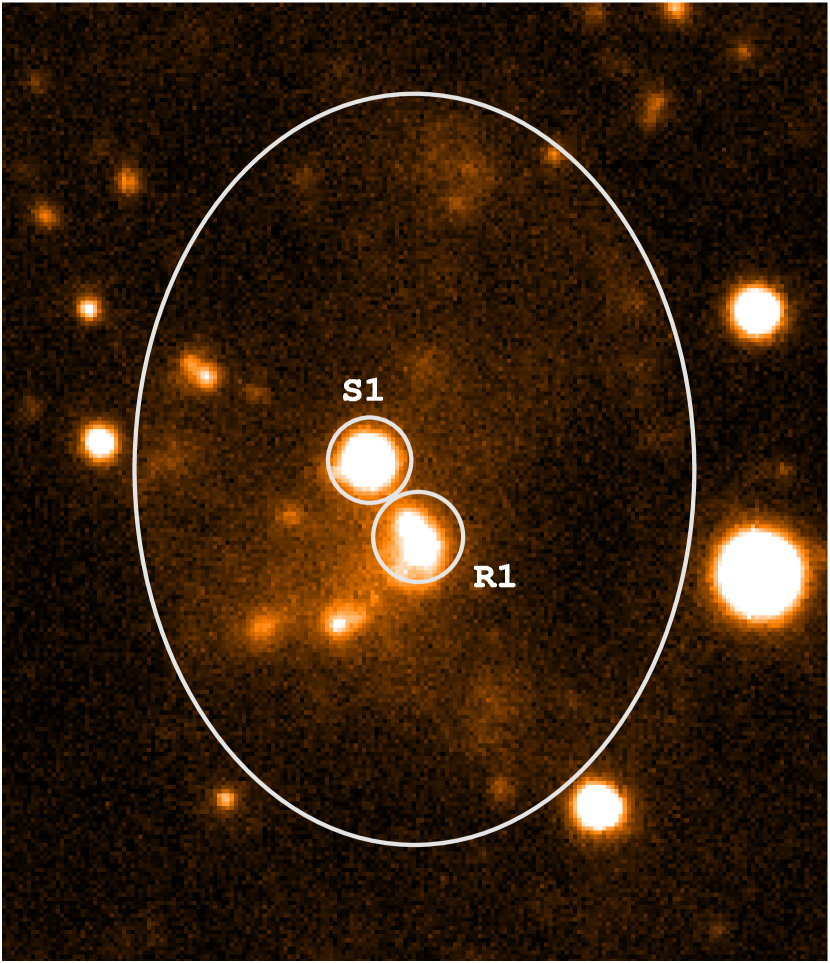
The galaxy 12270136 is clearly detected at the H I peak position of the NE clump. Its close-up view is given in Figure 2. As is previously known, the galaxy has a highly irregular morphology with the brightest knot, which we call “R1” hereafter, at close to the galactic center. The J2000.0 coordinate of R1 is R.A. 12h27m46s.1, decl. +01∘36m01s. We carried out photometry of the galaxy within an elliptical aperture of 140″ 100″, so that most of the visible diffuse light is collected and contamination from surrounding sources is minimized. A point source “S1” marked in Figure 2 is excluded since its much redder color than the rest of the emission in the aperture indicates it is a foreground star (Salzer et al., 1991). We estimated the underlying sky brightness and its uncertainty from mean and scatter of the background levels measured at several, relatively blank fields outside the aperture. The obtained total and surface brightness are 16.02 0.04 mag and 25.51 0.04 mag arcsec-2, respectively. We also measured brightness of R1 within a circular 12″ aperture, which results in 17.93 0.01 mag and 23.08 0.01 mag arcsec-2. The presented magnitudes have been corrected for the Galactic extinction assuming mag at the line-of-sight to the galaxy (Schlegel et al., 1998) and the extinction curve presented by Pei (1992).
12270136 has also been imaged by the SDSS111 Funding for the SDSS and SDSS-II has been provided by the Alfred P. Sloan Foundation, the Participating Institutions, the National Science Foundation, the U.S. Department of Energy, the National Aeronautics and Space Administration, the Japanese Monbukagakusho, the Max Planck Society, and the Higher Education Funding Council for England. The SDSS Web Site is http://www.sdss.org/. The SDSS is managed by the Astrophysical Research Consortium for the Participating Institutions. The Participating Institutions are the American Museum of Natural History, Astrophysical Institute Potsdam, University of Basel, University of Cambridge, Case Western Reserve University, University of Chicago, Drexel University, Fermilab, the Institute for Advanced Study, the Japan Participation Group, Johns Hopkins University, the Joint Institute for Nuclear Astrophysics, the Kavli Institute for Particle Astrophysics and Cosmology, the Korean Scientist Group, the Chinese Academy of Sciences (LAMOST), Los Alamos National Laboratory, the Max-Planck-Institute for Astronomy (MPIA), the Max-Planck-Institute for Astrophysics (MPA), New Mexico State University, Ohio State University, University of Pittsburgh, University of Portsmouth, Princeton University, the United States Naval Observatory, and the University of Washington. and the UKIDSS222 This work is based in part on data obtained as part of the UKIRT Infrared Deep Sky Survey. Large Area Survey. We inspected the images retrieved from the archives and found that, although they are much shallower than the MOA image, the brightest knot R1 is visible in all but UKIDSS band data. The measured magnitudes of R1 within the circular 12″ aperture are summarized in Table 1. The Galactic extinction has been corrected as above. In addition, we found that the galaxy was observed in 2006 June and July by the Spitzer Space Telescope333 This work is based in part on observations made with the Spitzer Space Telescope, obtained from the NASA/ IPAC Infrared Science Archive, both of which are operated by the Jet Propulsion Laboratory, California Institute of Technology under a contract with the National Aeronautics and Space Administration. (Spitzer) with the Infrared Array Camera (IRAC; Fazio et al., 2004) and the Multiband Imaging Photometer for Spitzer (MIPS; Rieke et al., 2004). The AOR keys are 17567232 and 17574144 for the IRAC and MIPS observations, respectively. R1 is detected only in the two shorter-wavelength IRAC bands (3.6 and 4.5 m), in which the brightness was measured as listed in Table 1. We provide 3 upper limits of flux in IRAC 5.8, 8.0 m and MIPS 24, 70 m bands where no robust detection was confirmed. We used the 12″ aperture in all but the MIPS 70 m band, in which an alternative 32″ aperture was used in consideration of the relatively poor angular resolution. Appropriate aperture corrections were applied to these Spitzer magnitudes by referring to the IRAC and MIPS Handbooks.
| Magnitude | Flux | ||
|---|---|---|---|
| Band | (AB mag) | (mJy) | |
| SDSS | 18.14 0.06 | 0.20 0.01 | |
| 17.89 0.06 | 0.25 0.01 | ||
| 17.89 0.06 | 0.25 0.01 | ||
| 18.11 0.09 | 0.21 0.02 | ||
| 18.22 0.23 | 0.19 0.04 | ||
| UKIDSS | 18.16 0.12 | 0.20 0.02 | |
| 18.15 0.23 | 0.20 0.04 | ||
| 18.29 0.26 | 0.18 0.04 | ||
| 17.8 | 0.27 | ||
| IRAC | 3.6 | 18.97 0.07 | 0.094 0.006 |
| 4.5 | 19.00 0.07 | 0.091 0.006 | |
| 5.8 | 18.5 | 0.14 | |
| 8.0 | 18.4 | 0.16 | |
| MIPS | 24 | 17.0 | 0.60 |
| 70 | 12.2 | 48 |
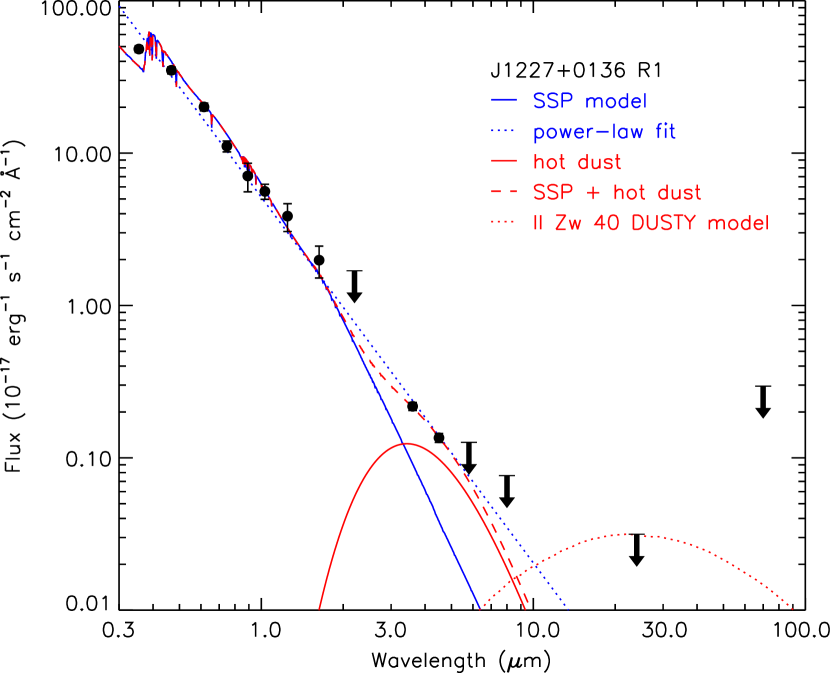
It is evident from Figure 3 that 12270136 R1 has a very blue spectral energy distribution (SED). The 0.3–5.0 m SED is well described by a single power-law function, . We estimated its stellar properties by comparing the SDSS and UKIDSS magnitudes to a stellar population synthesis (SPS) model provided by the GALAXEV (Bruzual & Charlot, 2003) code. A simple stellar population, in which all stars are formed in an instantaneous starburst, is assumed in the SPS calculations. We adopt two values of metallicity, = 0.02 and 0.2 , in consideration of the gas-phase metallicity 0.07 found by Salzer et al. (1991). The age grid was = 0.001, 0.003, 0.01, 0.03, 0.1, 0.3, 1, 3, and 10 Gyr. The fitting results based on the least- method are summarized in Table 2. The best-fit parameters without dust extinction are = 0.02 , = 100 Myr, and the stellar mass . The reduced value, , indicates a reasonable agreement between the observed and model SEDs. We show the best-fit SPS model in Figure 3. The higher metallicity = 0.2 results in a slightly worse fit and younger age solution ( = 10 Myr), due to the notorious age-metallicity degeneracy. When the effect of dust extinction is incorporated into the SPS calculations, assuming the Calzetti et al. (2000) extinction law and variable values between 0.0 and 0.5 mag, we obtain = 10–30 Myr with the derived mass . Therefore, we conservatively conclude that R1 has stellar age of 10–100 Myr and mass of . The age is consistent with the result of Salzer et al. (1991) who derived Myr for the diffuse LSB portions (not R1) of the galaxy. The whole galaxy seems to contain 10 times larger mass () based on their analysis.
| Dust | Metallicity | Age | Mass | ||
|---|---|---|---|---|---|
| Extinction? | () | (Myr) | (mag) | () | () |
| No | 0.02 | 100 | 3.5 | 1.5 (10.7) | |
| 0.2 | 10 | 0.5 | 1.8 (12.9) | ||
| Yes | 0.02 | 30 | 0.4 | 2.5 | 0.8 (5.9) |
| 0.2 | 10 | 0.0 | 0.5 | 1.8 (12.9) |
At near-IR wavelengths beyond the UKIDSS bands, the observed SED becomes apparently red compared to the stellar emission model: the predicted and observed [3.6][4.5] colors are 0.5 and 0.0 mag (AB), respectively. The presence of such a red excess component in galaxies has been known and discussed for the last several years. Lu et al. (2003) showed that the excess, found in a sample of star-forming disk galaxies, is best explained by hot dust emission with color temperature = 750–1000 K, rather than dust reddening of stellar continuum. They suggested that this emission may be the same component that is seen in reflection nebulae and the large-scale interstellar medium of the Milky Way. Hot dust in dwarf and irregular galaxies has also been indicated and studied by mostly exploiting the near- to mid-IR imaging capability of Spitzer (e.g., Engelbracht et al., 2005; Hunter et al., 2006). We found that the excess brightness of 12270136 R1 at 3.6 and 4.5 points to the color temperature of K (a modified blackbody with emissivity is assumed; see Figure 3), in agreement with the hot dust origin for this component. The estimated mass in this dust population is (mass absorption coefficients were taken from Li & Draine, 2001). Meanwhile, we note that other mechanisms such as strong Br line and nebular continuum emissions are also suggested as non-negligible contributors to these IRAC bands (e.g., Smith & Hancock, 2009).
We could not detect the galaxy at beyond (up to ), where normal starburst SEDs are dominated by warm dust and polycyclic aromatic hydrocarbon emissions. This (and longer wavelength) spectral region of low-metallicity blue compact dwarf galaxies (BCDs), which are most analogous to R1 in terms of stellar content, metallicity, and size ( 1 kpc), is being intensively studied as a testbed for star formation and dust evolution processes in high-redshift Universe (e.g., Hunt et al., 2005). While dust is produced predominantly in the envelopes of asymptotic giant branch stars in old (stellar age 1 Gyr) systems, low-metallicity BCDs have not evolved enough to have such a production channel, and hence Type II supernovae are thought to be the main source of dust in these objects. Evidence of supernova origin for dust is also seen in larger systems such as luminous high-redshift quasars (e.g., Maiolino et al., 2004) and young ultraluminous IR galaxies (e.g., Kawara et al., 2011).
Although a detailed analysis is hampered by the faintness of the galaxy at IR wavelengths, here we try to provide the upper limits of mass in warm dust () based on the observed flux upper limits. For this purpose, we assume the to (monochromatic luminosity at 24 ) ratio found in a low-metallicity BCD II Zw 40. The dust mass in II Zw 40 was estimated by Hunt et al. (2005) by comparing its mid-IR to radio fluxes to the model SEDs constructed from the DUSTY (Ivezic et al., 1999) code, which is designed to perform an appropriate radiative transfer calculation in dusty environments. The monochromatic luminosity at 24 was chosen because the observed upper limit puts the strongest constraint on the amplitude of the model SED (see Figure 3). The derived mass is , thus the whole galaxy may contain up to if we adopt the same scaling factor as for stellar content ( and for R1 and the whole galaxy, respectively; see above). This is rather low compared to other BCDs of comparable or smaller H I masses (e.g., Hirashita et al., 2008), a part of which may be due to the fact that 12270136 has lower metallicity than most of known BCDs. However, the current result is based only on the brightness in a single mid-IR band and could be significantly altered with future far-IR observations.
3.2. SW clump
No diffuse emission associated with the SW clump or any H I components other than the NE clump is found in the MOA image (Figure 1). The 3 limiting surface brightness is 25.2 mag arcsec-2, which is slightly deeper than that achieved in the previous attempt (only for the SW region) by Turner & MacFadyen (1997). We smoothed the image on a 10″ 10″ box by taking the mode value in each of the boxes, which improved the limiting depth to 28.3 mag arcsec-2, but did not find any diffuse emission as well in the relevant fields. Therefore the OC to the SW clump, if it is present and extended over 10″ (comparable to R1), should have the surface brightness of more than one hundred times fainter than the brightest part of the companion galaxy 12270136. At the same time, we cannot reject the possibility that star formation in the SW clump is prevented/delayed for some reasons and the clump is truly invisible in optical light.
The formation process of H I 122501 and the nature of the SW clump is still not well understood. Chengalur et al. (1995) concluded that the SW clump is an edge-on rotating disk which is kinematically separated from other H I components, based on its geometry, high central column density, and velocity distribution. Indeed, its position - velocity diagram is very similar to those along the major axis of disk galaxies. The inferred rotation velocity is rather small, 13 km s-1 (a few times smaller than that of the NE clump). They suggested that the entire H I 122501 structure was formed via tidal interactions between the NE and SW clumps, which have comparable H I mass and density and were once dynamically distinct. In that case, the clear contrast between the two clumps in their stellar contents may hint at some key ingredients of star formation process. Impey & Bothun (1997) showed that, on the diagram of surface mass density and velocity dispersion, the NE clump departs significantly from the locus of normal dwarf/irregular galaxies toward the region in which the energy dissipation and subsequent star formation are not allowed (based on Efstathiou & Silk, 1983). Qualitatively, at the velocity dispersion found in the NE clump, the surface brightness (corresponding to surface mass) of normal galaxies and the NE clump are and 29 mag arcsec-2, respectively, while no dissipation is allowed at mag arcsec-2 for primordial gas. The SW clump has the similar H I mass density and velocity dispersion to the NE counterpart, but some small (but critical) difference may have prevented it from setting out to the dissipation process. Alternatively, the SW clump might be an intimately associated structure with the NE clump, such as a large tidal tail created in a past merger event that the NE clump has undergone (Turner & MacFadyen, 1997).
Meanwhile, some theoretical and observational studies suggest that dark galaxies cannot live long. Taylor & Webster (2005) found that, in the absence of an internal radiation field, the gas in a galaxy with baryonic mass greater than becomes gravothermally unstable via H2 cooling and leads inevitably to star formation. Their model shows that the fraction of the unstable (to star formation) gas is smaller in galaxies with lower baryonic mass. In fact, Warren et al. (2007) found that the stellar to baryonic mass ratio decreases toward lower baryonic mass in 40 late-type galaxies observed in the local Universe, which is consistent with the above prediction. They concluded that galaxies with very high H I mass to optical light ratios are extremely rare because such systems can only be produced with a combination of the physical conditions such as low initial mass, shallow dark matter potential, and low-density environment. These studies seem to deny the possibility that the SW clump, located in the relatively high-density environment within the Virgo cluster, is a dark galaxy that has persisted and will persist for very long time.
The fact that the SW clump of H I 122501 remains as (one of) the best example(s) of dark galaxy candidates, if it is not a tidal feature of the NE clump, for more than 20 years since its discovery may indicate that they are in fact extremely rare, as suggested by Briggs (1990). Future studies on such a population will benefit greatly from the coming deep and wide optical surveys, e.g., the planned Hyper-Suprime Cam survey with Subaru telescope (Takada, 2010), in combination with the existing H I surveys such as the HIPASS and the ALFALFA.
References
- Briggs (1990) Briggs, F. H. 1990, AJ, 100, 999
- Bruzual & Charlot (2003) Bruzual, G., & Charlot, S. 2003, MNRAS, 344, 1000
- Calzetti et al. (2000) Calzetti, D., Armus, L., Bohlin, R. C., et al. 2000, ApJ, 533, 682
- Chengalur et al. (1995) Chengalur, J. N., Giovanelli, R., & Haynes, M. P. 1995, AJ, 109, 2415
- Doyle et al. (2005) Doyle, M. T., Drinkwater, M. J., Rohde, D. J., et al. 2005, MNRAS, 361, 34
- Djorgovski (1990) Djorgovski, S. 1990, AJ, 99, 31
- Efstathiou & Silk (1983) Efstathiou, G., & Silk, J. 1983, Fund. Cosmic Phys., 9, 1
- Engelbracht et al. (2005) Engelbracht, C. W., Gordon, K. D., Rieke, G. H., et al. 2005, ApJ, 628, L29
- Fazio et al. (2004) Fazio, G. G., Hora, J. L., Allen, L. E., et al. 2004, ApJS, 154, 10
- Giovanelli & Haynes (1989) Giovanelli, R., & Haynes, M. P. 1989, ApJ, 346, L5
- Giovanelli et al. (1991) Giovanelli, R., Williams, J. P., & Haynes, M. P. 1991, AJ, 101, 1242
- Haynes et al. (2011) Haynes, M. P., Giovanelli, R., Martin, A. M., et al. 2011, AJ, 142, 170
- Hirashita et al. (2008) Hirashita, H., Kaneda, H., Onaka, T., & Suzuki, T. 2008, PASJ, 60, 477
- Hunt et al. (2005) Hunt, L., Bianchi, S., & Maiolino, R. 2005, A&A, 434, 849
- Hunter et al. (2006) Hunter, D. A., Elmegreen, B. G., & Martin, E. 2006, AJ, 132, 801
- Impey & Bothun (1997) Impey, C., & Bothun, G. 1997, ARA&A, 35, 267
- Impey et al. (1990) Impey, C., Bothun, G., Malin, D., & Staveley-Smith, L. 1990, ApJ, 351, L33
- Impey et al. (1996) Impey, C. D., Sprayberry, D., Irwin, M. J., & Bothun, G. D. 1996, ApJS, 105, 209
- Ivezic et al. (1999) Ivezic, Z., Nenkova, M., & Elitzur, M. 1999, arXiv:astro-ph/9910475
- Kawara et al. (2011) Kawara, K., Hirashita, H., Nozawa, T., et al. 2011, MNRAS, 412, 1070
- Lawrence et al. (2007) Lawrence, A., Warren, S. J., Almaini, O., et al. 2007, MNRAS, 379, 1599
- Li & Draine (2001) Li, A., & Draine, B. T. 2001, ApJ, 554, 778
- Lu et al. (2003) Lu, N., Helou, G., Werner, M. W., et al. 2003, ApJ, 588, 199
- Maiolino et al. (2004) Maiolino, R., Schneider, R., Oliva, E., et al. 2004, Nature, 431, 533
- Matsuoka (2012) Matsuoka, Y. 2012, ApJ, 750, 54
- Matsuoka et al. (2011a) Matsuoka, Y., Ienaka, N., Kawara, K., & Oyabu, S. 2011a, ApJ, 736, 119
- Matsuoka & Kawara (2010) Matsuoka, Y., & Kawara, K. 2010, MNRAS, 405, 100
- Matsuoka et al. (2008) Matsuoka, Y., Kawara, K., & Oyabu, S. 2008, ApJ, 673, 62
- Matsuoka et al. (2011b) Matsuoka, Y., Peterson, B. A., Murata, K. L., et al. 2011b, AJ, 142, 64
- McMahon et al. (1990) McMahon, R. G., Irwin, M. J., Giovanelli, R., et al. 1990, ApJ, 359, 302
- Pei (1992) Pei, Y. C. 1992, ApJ, 395, 130
- Rieke et al. (2004) Rieke, G. H., Young, E. T., Engelbracht, C. W., et al. 2004, ApJS, 154, 25
- Sako et al. (2008) Sako, T., Sekiguchi, T., Sasaki, M., et al. 2008, Experimental Astronomy, 22, 51
- Salzer et al. (1991) Salzer, J. J., di Serego Alighieri, S., Matteucci, F., Giovanelli, R., & Haynes, M. P. 1991, AJ, 101, 1258
- Schlegel et al. (1998) Schlegel, D. J., Finkbeiner, D. P., & Davis, M. 1998, ApJ, 500, 525
- Smith & Hancock (2009) Smith, B. J., & Hancock, M. 2009, AJ, 138, 130
- Sumi et al. (2011) Sumi, T., Kamiya, K., Bennett, D. P., et al. 2011, Nature, 473, 349
- Takada (2010) Takada, M. 2010, American Institute of Physics Conference Series, 1279, 120
- Taylor & Webster (2005) Taylor, E. N., & Webster, R. L. 2005, ApJ, 634, 1067
- Turner & MacFadyen (1997) Turner, N. J. J., & MacFadyen, A. 1997, MNRAS, 285, 125
- Verde et al. (2002) Verde, L., Oh, S. P., & Jimenez, R. 2002, MNRAS, 336, 541
- Warren et al. (2007) Warren, B. E., Jerjen, H., & Koribalski, B. S. 2007, AJ, 134, 1849
- York et al. (2000) York, D. G., Adelman, J., Anderson, J. E., Jr., et al. 2000, AJ, 120, 1579