Cosmic Evolution of Star-Formation Enhancement in Close Major-Merger Galaxy Pairs Since
Abstract
The infrared (IR) emission of “ galaxies” () in galaxy pairs, derived using data obtained in Herschel (PEP/HerMES) and Spitzer (S-COSMOS) surveys, is compared to that of single disk galaxies in well matched control samples to study the cosmic evolution of the star-formation enhancement induced by galaxy-galaxy interaction. Both the mean IR SED and mean IR luminosity of star-forming galaxies (SFGs) in SFG+SFG (S+S) pairs in the redshift bin of are consistent with no star-formation enhancement. SFGs in S+S pairs in a lower redshift bin of show marginal evidence for a weak star-formation enhancement. Together with the significant and strong sSFR enhancement shown by SFGs in a local sample of S+S pairs (obtained using previously published Spitzer observations), our results reveal a trend for the star-formation enhancement in S+S pairs to decrease with increasing redshift. Between and , this decline of interaction-induced star-formation enhancement occurs in parallel with the dramatic increase (by a factor of ) of the sSFR of single SFGs, both can be explained by the higher gas fraction in higher z disks. SFGs in mixed pairs (S+E pairs) do not show any significant star-formation enhancement at any redshift. The difference between SFGs in S+S pairs and in S+E pairs suggests a modulation of the sSFR by the inter-galactic medium (IGM) in the dark matter halos (DMH) hosting these pairs.
Subject headings:
galaxies: interactions — galaxies: evolution — galaxies: starburst — galaxies: general1. Introduction
In some cosmological simulations (Guiderdoni et al., 1998; Somerville et al., 2000; Baugh et al., 2005), it is assumed that merger-induced star-formation is the major (or even the dominant) contribution to the high star-formation rate (SFR) at – 2, the epoch when the SFR density in the universe peaks. Results of early HST surveys (Driver et al., 1995; Glazebrook et al., 1995; Abraham et al., 1996; Brinchmann et al., 1998; LeFévre et al., 2000; Conselice et al., 2003) were indeed consistent with this assumption. However, more recent observations (Bell et al., 2005; Noeske et al., 2007; Elbaz et al., 2007; Daddi et al., 2007; Lotz et al., 2008; Pannella et al., 2009; Rodighiero et al., 2011; Peng et al., 2010; Elbaz et al., 2011; Wuyts et al., 2011) have favored a scenario in which the so-called “main sequence” (MS) normal star-forming galaxies (SFG), continuously fueled by smooth accretion of cold intergalactic gas (“cold flows”, Dekel et al. 2009; Keres et al. 2009), dominate the cosmic SFR ever since z while the contribution from merger-induced starbursts (the outliers in the SFR- plot) plays only a minor role (Rodighiero et al. 2011, but see Bridge et al. 2007; Shi et al. 2009).
On the other hand, it is possible that much of the SFR in the MS galaxies could be associated with galaxy mergers. Many recent studies on merger rate evolution found that the fraction of galaxies in mergers increases significantly from z=0 to z=1 (Kartaltepe et al. 2007; Conselice et al. 2009; Bridge et al. 2010; Xu et al. 2012, and galaxies with are in close major-merger pairs (see Lin et al. 2008; Lotz et al. 2008 for different results). In the local universe, the average SFR of merging galaxies (as found in optical/NIR selected pairs) is only a factor of – 3 of that of single disk galaxies (Kennicutt et al., 1987; Ellison et al., 2008; Xu et al., 2010). Therefore most of these galaxies belong to the MS population, while extreme starbursts such as those in local ultra-luminous galaxies (ULIRGs) are very rare (Sanders & Mirabel, 1996). If mergers of higher redshifts have similar or higher level of SFR enhancement, then of the SFR associated with MS galaxies could be due to mergers.
In this work, exploiting the infrared (IR) data obtained using Herschel Space Observatory (Pilbratt et al., 2010) and Spitzer Space Telescope (Werner et al., 2004), we study the star-formation enhancement of SFGs in close major-merger pairs since z=1. Throughout this paper, we adopt the -cosmology with and , and .
2. Samples in the COSMOS Field
Two samples of paired SFGs with are studied in this work, both are confined to “ galaxies” with stellar mass in the range of . According to Ilbert et al. (2010), the “” (the turning point in the galaxy stellar mass function) of SFGs is rather constant against redshift since : for “intermediate active” galaxies and for “high active” galaxies. The “S+S” sample includes 124 SFGs in 62 SFG+SFG pairs and the “S+E” sample 44 SFGs in 44 mixed pairs, all having redshifts in the range of [0.2,1.0].
Galaxies in both samples are taken from the sample of close () major-merger pairs () in the COSMOS field (CPAIR, Xu et al. 2012). The parent sample of CPAIR was selected from the photo- catalog of the COSMOS field (Capak et al., 2007; Ilbert et al., 2009; Drory et al., 2009) with stellar mass limits of in four redshift bins that equally divide the redshift range of [0.2,1.0], respectively. These limits are above the completeness limits for the stellar mass of the photo- sample (Drory et al., 2009). It was required in the CPAIR selection that the photo-z’s of the two galaxies in a pair candidate satisfy the following criterion: , where and are the photo-z’s of the primary and secondary, respectively. The redshifts of both galaxies in a pair are then assumed to be the same, estimated by the mean of the two photo-z’s. The classification of SFGs (S) or “passive galaxies” (E) was based on the SED fitting and taken from Drory et al. (2009).
Both samples are divided into 2 redshift bins: [0.2,0.6] (low- bin) and [0.6,1.0] (high- bin). These bins are 2 times wider than those in the original CPAIR sample. Making the size of subsamples in redshift bins larger allows better statistics. Since for most pairs the beams of IR observations () cannot resolve a pair into two component galaxies, the S+S sample selection was carried out on pairs instead of on individual galaxies: a pair will be included in the sample if is in the range of [10.4, 11]. The S+E sample includes only the SFGs in the mixed pairs and excludes the early-type galaxies. There are 7 (11) S+S pairs (S+E pairs) in the low- bin with the median redshift of 0.45 (0.41), and 55 (33) in the high- bin with the median redshift of 0.81 (0.82).
The two control samples, one for each sample of paired SFGs, are selected from the same parent sample of CPAIR. In order to minimize the statistical errors in our final results that are due to the controls, each paired galaxy was matched by 10 control galaxies (none being included more than once). The following criteria were used in the selection of the controls: (1) redshift match: , where is the photo- of the control candidate, and the photo- of the paired galaxy to be matched; (2) mass match: , where is the stellar mass of the control candidate, and the stellar mass of the paired galaxy to be matched; (3) type match: all control galaxies are SFGs; (4) local density match: , where is the neighbor counts (for neighbor galaxies of ) within (comoving) of the control candidate, and the neighbor counts around the paired galaxy. Here, in order to have adequate numbers of control candidates for paired galaxies with very low local densities, we set a minimum () to the density match limit which is otherwise equal to the Poisson error of .
In order to exclude interacting galaxies, the following two additional criteria were applied to the selection of control candidates: (5) no companion within the projected distance that has and more massive than ; (6) and , where is the asymmetry parameter (Conselice et al., 2000) and the Gini Coefficient (Lotz et al., 2008). The criterion (6) excludes morphologically disturbed galaxies that are generally associated with mergers (Lotz et al., 2008; Conselice et al., 2009). Visual inspections of 100 galaxies randomly picked from the control samples showed no obvious merger candidates except for a few ambiguous cases of galaxies with possible weak and faint distortion features.
3. Local Samples
In order to provide the local benchmarks for the evolutionary study, two local samples of paired SFGs, one for those in S+S pairs and another for those in S+E pairs, and their corresponding control samples are also studied. These samples are adopted from Xu et al. (2010), who observed a nearly complete K-band selected pair sample (KPAIR) using Spitzer in the 3.6, 4.5, 5.8, 8, 24, 70, and 160 bands. The sample was selected from cross-matches between 2MASS and SDSS-DR3 galaxies, including 27 S+S and S+E pairs that have and mass ratio of . The selection criteria are nearly the same to those for the CPAIR sample. The paired galaxies are then one-to-one matched (according to the stellar mass and redshift) by a sample of control galaxies selected from the SWIRE survey (Lonsdale et al., 2003) and the SINGS survey (Kennicutt et al., 2003). There are 39 non-AGN SFGs in the pair sample of Xu et al. (2010). Among them, all paired SFGs (and their controls) in the mass range of (stellar mass estimated from the K-band luminosity using Kroupa IMF) are included in the local samples of this study. There are 20 (7) SFGs in the local S+S (S+E) sample, and the same number of galaxies in the corresponding control sample.
| Bands | Insta | FWHM b | sensitivity | detection rate () | ||||||||||||||||||||
|---|---|---|---|---|---|---|---|---|---|---|---|---|---|---|---|---|---|---|---|---|---|---|---|---|
| c | d | S+S pair | S+S contr | S+E pair | S+E contr | |||||||||||||||||||
| (arcsec) | (mJy) | l-ze | h-zf | l-z | h-z | l-z | h-z | l-z | h-z | |||||||||||||||
| 24 | MIPS | 6.1 | 0.08 | 4.4 | 6/7 | 40/55 | 107/140 | 663/1110 | 9/11 | 15/33 | 90/110 | 196/330 | ||||||||||||
| 100 | PACS | 7.5 | 5.0 | 3.0 | 3/7 | 13/55 | 54/140 | 93/1110 | 5/11 | 2/33 | 54/110 | 27/330 | ||||||||||||
| 160 | PACS | 11.2 | 10.2 | 3.0 | 3/7 | 12/55 | 48/140 | 84/1110 | 4/11 | 3/33 | 44/110 | 23/330 | ||||||||||||
| 250 | SPIRE | 18.2 | 17.4 | 3.0 | 2/7 | 11/55 | 28/140 | 56/1110 | 3/11 | 1/33 | 31/110 | 13/330 | ||||||||||||
| 350 | SPIRE | 24.9 | 18.8 | 3.0 | 3/7 | 3/55 | 4/140 | 27/1110 | 1/11 | 1/33 | 7/110 | 4/330 | ||||||||||||
| 500 | SPIRE | 36.3 | 20.4 | 3.0 | 0/7 | 0/55 | 1/140 | 10/1110 | 0/11 | 0/33 | 3/110 | 2/330 | ||||||||||||
Note. — Insrument; full width at half maximum of the point spread function (PSF); flux limit; signal-to-noise ratio at the flux limit; low- bin (); high- bin ().
4. The IR Data
The COSMOS field was surveyed by the PACS Evolutionary Probe (PEP, Lutz et al. 2011) using PACS photometer arrays (Poglitsch et al., 2010). The 3- sensitivities in the PACS 100 and 160 maps are 5.0 mJy and 10.2 mJy, respectively (Berta et al., 2011). The 250, 350 and 500 observations were carried out by Herschel Multi-tiered Extragalactic Survey111http://hermes.sussex.ac.uk (HerMES, Oliver et al. 2012) using SPIRE photometer arrays (Griffin et al., 2010; Swinyard et al., 2010). The maps in the three SPIRE bands (Levenson et al., 2010) are confusion limited at 3- level of 17.4, 18.8, and 20.4 mJy, respectively (Nguyen et al., 2010). In addition, we also included the Spitzer 24 data from the S-COSMOS survey (Sanders et al., 2007). The 24 source catalog of the COSMOS field (LeFloc′h et al., 2009) is flux limited at .
We assume that the IR emission in an S+E pair is due to the SFG component only, ignoring the contribution from the E component (Domingue et al., 2003). Because most S+S pairs (median angular separation ) are not resolved in the IR bands, each S+S pair is treated as a single source. Table 1 provides the main characteristics of the IR data. In general, the detection rates of our samples in the 5 Herschel bands are rather low. In particular, except for S+S pairs, sources in the high- bin () have detection rates in all Herschel samples. The S+S pairs have slightly higher detection rates because most of them are not resolved by Herschel, therefore each Herschel source includes contributions from both component galaxies. The detection rates in the MIPS 24 band are between 45.5% and 85.7%.
| sample | b | ||||||||||||||||
|---|---|---|---|---|---|---|---|---|---|---|---|---|---|---|---|---|---|
| (mJy) | (mJy) | (mJy) | (mJy) | (mJy) | (mJy) | () | |||||||||||
| S+S d | 7 | 0.45 | c | ||||||||||||||
| 55 | 0.81 | ||||||||||||||||
| Control | 140 | 0.45 | |||||||||||||||
| 1100 | 0.82 | ||||||||||||||||
| S+E | 11 | 0.41 | c | ||||||||||||||
| 33 | 0.82 | c | c | ||||||||||||||
| Control | 110 | 0.41 | |||||||||||||||
| 330 | 0.82 |
Note. — Mean IR fluxes were estimated through stacking, and the errors through bootstrapping; mean sSFR enhancement index; 3- upper-limit (, where is the 3- sensitivity limit of the band, and N the size of the sample); mean IR fluxes, errors and upper-limits for paired SFGs were derived by dividing corresponding values of S+S pairs by 2.
5. Stacking Analyses and Results
Because of the low IR detection rates, we studied the IR emission of our sources through stacking. Two stacking methods are considered. The first is a modified version of “cleaned stacking”. In its original form (Zheng et al., 2007), there are four steps in this method: (1) detect and extract all bright sources above a given detection threshold from the observational image; (2) separate the target sources into detected and undetected by matching them with the catalog of detected sources; (3) stack the images of undetected sources, which are cut from the residual map with the detected sources extracted, and measure the flux; (4) derive the mean flux of target sources , where is the flux of the i-th detected source, the flux measured in the stacked image, and the total number of sources in the target sample. Compared to uncleaned stacking (Dole et al., 2006), cleaned stacking suffers less confusion problems due to unrelated background sources. However, the result might be biased due to flux boosting for detected sources, in particular if the detection limit is set at a low level. In order to avoid this bias, we made the following modifications. First, the detection thresholds were set relatively high (at ) when doing the detection and extraction on observed images using StarFinder (Diolaiti et al., 2000). Then, the extractions corresponding to detected target sources were restored back to the residual map; the subsequent stacking, using the residual map with detected background sources extracted, went through all target sources including both detected and undetected. Finally, the mean flux of a given band for a given sample was derived by .
Some sources in our samples are marginally resolved in the IR images, in particular the S+S pairs with ( of all S+S pairs). In order to ensure that a stacked image includes all fluxes from all sources, we searched in the catalog of detected sources for all matches to a given S+S pair using a searching radius of . For SFGs in the S+E sample and two control samples, which are generally point sources in all IR bands (e.g. the mean Petrosian radius of galaxies in the S+S control sample is with a dispersion of ), the searching radius is . In the photometry of the stacked images, we choose to use a constant aperture of radius for the three MIPS and PEP bands at 24, 100 and 160 . The corresponding aperture corrections are 1.09, 1.05, 1.21, respectively, according to our empirical tests using StarFinder.
In the second method, the “covariance” method (Marsden et al., 2009), the mean flux of a sample of target sources is estimated by , where is the measured flux density (in units of Jy/beam) in the map pixel that contains the k-th source in the target sample. The map, without any cleaning of unrelated sources, is background subtracted with zero mean. The method explicitly assumes that target sources are randomly distributed in the sky according to the Poisson statistics, which is certainly not valid for paired galaxies, therefore it should not be applied to individual galaxies in S+S pairs. Also, this method may significantly under-estimate the mean flux of target sources if some of them are resolved (even only partially).
Our experiments showed that for SPIRE images at 250, 350 and 500 , which are predominantly confusion limited (Oliver et al., 2012), the mean fluxes derived using the covariance method and cleaned stacking are all consistent with each other within 1 error; and results of the covariance method generally have slightly lower errors than those of cleaned stacking. On the other hand, in the MIPS 24 and PACS 100 bands, the mean fluxes of S+S pairs derived using the covariance method are systematically lower than those obtained using cleaned stacking, presumably due to missing flux of resolved sources in the former. Therefore, in the final analyses, we chose to use the cleaned stacking method for the 24, 100 and 160 bands, and the covariance method for the 250, 350 and 500 bands.
The results are listed in Table 2. All errors were estimated by bootstrapping (Efron, 1979). For a given sample and band, the error includes both the statistical dispersion of the sample and the measurement noise (instrumental and confusion noise). A 3- upper-limit is assigned to a mean flux if it is less than , where is the 3- sensitivity limit of the band, and N the size of the sample. For the S+S sample, N is the number of pairs; for other samples, N is the number of galaxies. For SFGs in the S+S sample, the mean fluxes, errors, and upper-limits were all obtained by dividing corresponding values of the pairs by a factor of 2.
We neglected the bias due to clustering of IR sources (Béthermin et al., 2012). Our experiments using simulations based on the algorithm described in Béthermin et al. (2012) showed that for our (mass-selected) samples the clustering bias is not strong, for the mean fluxes in the 500 band and for those in other bands, without significant dependence on redshift. Because of the local density match between the control samples and the pair samples (Section 2), the biases for pairs and for controls should be the same and therefore cancel each other out in the star-formation enhancement analysis. On the same ground, any other possible systematic biases in the mean fluxes (e.g. due to filtering of the maps) have also been neglected.
6. Star-Formation Enhancement in Paired SFGs
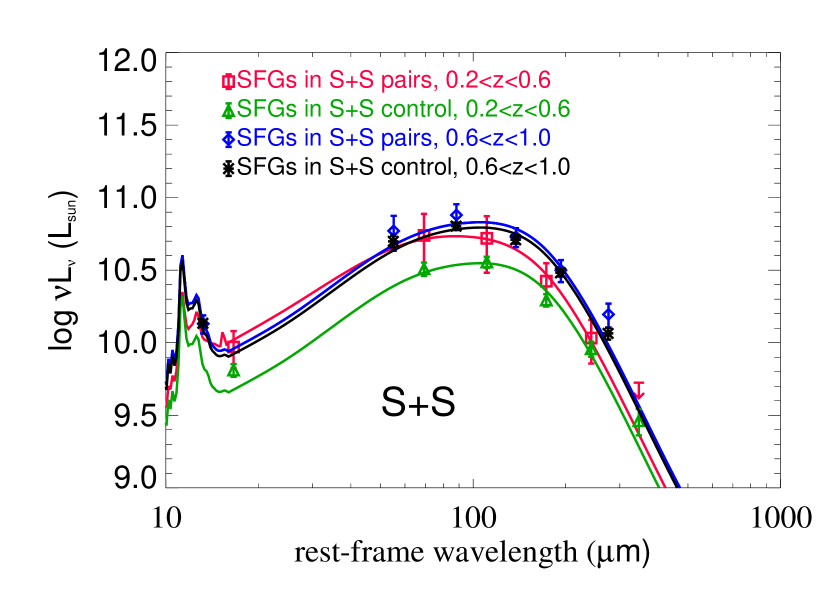
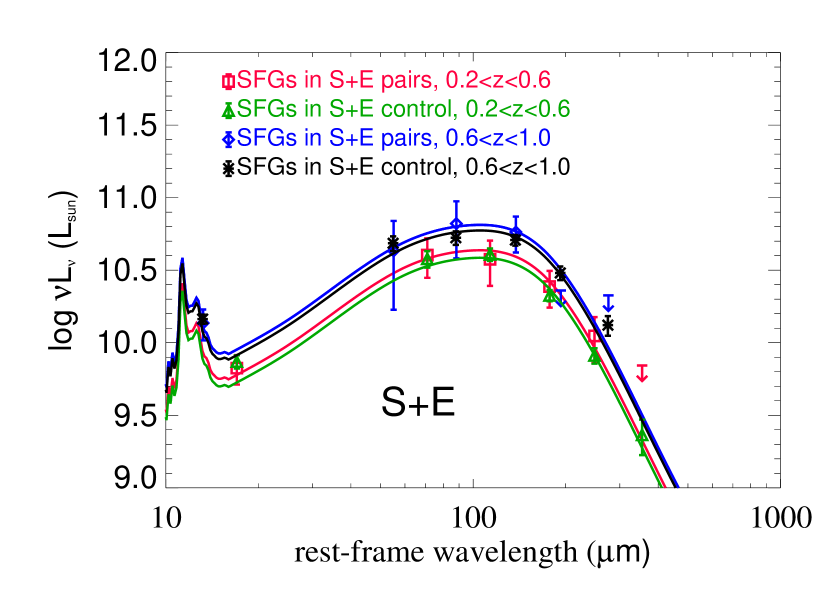
Using the median redshift of each subsample, the mean IR fluxes obtained by stacking are converted to the rest-frame and plotted in Fig. 1. The semi-empirical SEDs in the SED library of Xu et al. (2001) were searched for the best fits to these data. The SED library222 http://spider.ipac.caltech.edu/staff/cxu/sed_lib/intro_sed_lib.html is based on the IRAS, ISO, and ground based sub-mm observations of 837 IRAS 25 band selected galaxies. Among bright FIR sources ( Jy) in the library, we found that the SED of local merger Arp 244 (the Antennae Galaxies) fits best the data of SFGs in S+S sample in the low- bin (). Interestingly, the mean SEDs of all other subsamples, including the high- bin () of the S+S sample and both redshift bins of the S+E sample, have similar shapes and can be best fitted by the SED of the same local normal Sc galaxy NGC 6181 (Fig. 1).
The inverse variance weighted least-squares fit to data in the 100, 160, 250, 350 bands (i.e. data close to the IR peak), using the corresponding best-fit SED, was carried out for each subsample to determine the mean total IR luminosity . The variance of was estimated by
| (1) |
where all summations are over the four bands at 100, 160, 250, 350 , and is the covariance between band and band . If the errors in different bands were independent with each other, i.e. for , the variance of could have been estimated by . However for our data we found rather significant covariance between different bands (also estimated using bootstrapping).
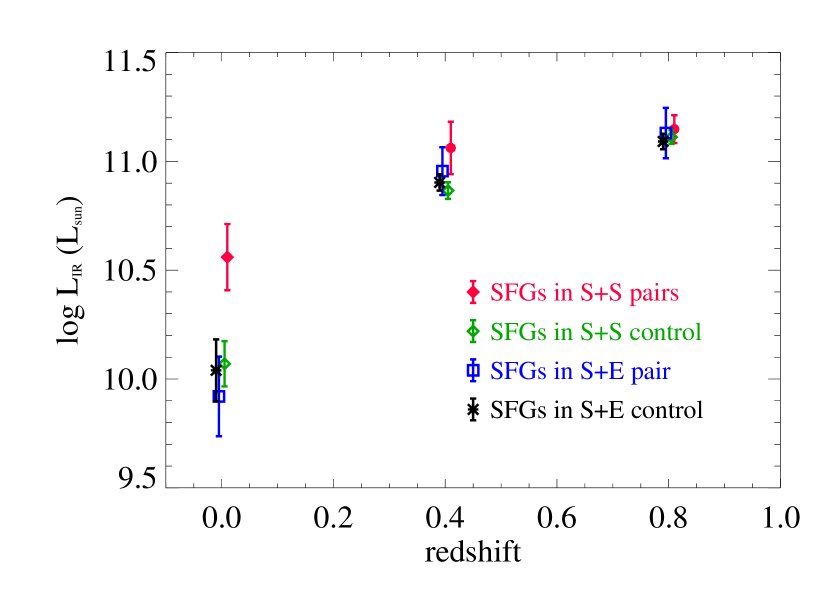

Resulting ’s are listed in Table 2 and plotted in Fig. 2 against redshift. Also plotted are mean IR luminosities of SFGs in the local samples. The mean ’s of the local samples are derived using Spitzer data at 8, 24, 70, and 160 (Xu et al., 2010). Fig. 3 shows the sSFR enhancement of SFGs in S+S pairs and in S+E pairs. The sSFR enhancement index is defined as
| (2) | |||||
| (3) |
The last equation is valid because, by design, each pair sample and its control sample have the same mean stellar mass. Also, we neglected the uncertainties of the as an SFR indicator that are due either to the dust heating by old stars or to the UV radiation of young stars escaping the dust absorption. These uncertainties should not affect the calculation of because the effects on the paired SFGs and on the controls should be the same and therefore should cancel each other out.
For SFGs in S+S pairs, data are consistent with un-enhanced star-formation in paired galaxies in the high- bin (). They show an average sSFR enhancement index of , and their mean SED and that of their controls are both best-fitted by the same SED of a normal disk galaxy (NGC 6181). In the low- bin (), mainly because of the small number of S+S pairs in the bin, the results are less clear-cut: their average sSFR enhancement index is , indicating a weak enhancement at rather low significance level of 87% (i.e. at 1.5- level). The mean SED is best fitted by that of a galaxy merger (Arp 244) but, given the large error bars of individual data points, a fit with the SED of the normal spiral NGC 6181 cannot be ruled out. For SFGs in S+E pairs in both the low- and high- bins, results on both the sSFR enhancement and the SED comparison are consistent with no enhancement in their star-formation activities.
7. Discussion
7.1. S+S Pairs: Less Star-Formation Enhancement at Higher
The non-enhancement of the star-formation in SFGs in S+S pairs with and the rather weak star-formation enhancement in those with , in contrast with the strong and significant star-formation enhancement () in the local sample (Fig. 3), reveal a clear trend for the star-formation enhancement to decrease with redshift. It is unlikely that this trend is due to an increase of the spurious pairs fraction (SPF) with redshift. The probability for selecting (unphysical) projected pairs is significantly reduced by CPAIR selection criteria and , confining the companion search to a very small sky area () and a narrow mass range. Indeed, as shown by the Monte Carlo simulations (Xu et al., 2012), the spurious pair fraction due to projected pairs (given the photo-z error of the COSMOS survey and the pair selection criterion ) is only % at z=0.3 and % at . Even after including the effect of galaxy clustering and counting pairs with as spurious pairs, the spurious pair fraction is still rather low in the CPAIR sample: at and at . The local () pairs were selected based on spectroscopic redshifts (Xu et al., 2010). For them, (Xu et al., 2012), due to unbound galaxies that are clustered together (therefore having recession velocity difference as low as ). Statistically, the effect of the contamination of spurious pairs can be corrected as following
| (4) |
For SFGs in S+S pairs in the high- bin (), this correction results in a small change in the mean enhancement index, from to . In summary, the low spurious pair fractions in our pair samples shall not affect the results on the sSFR enhancement significantly.
In parallel to the decline of the sSFR enhancement in S+S pairs, mean of normal SFGs in the control sample increases rapidly with redshift (Fig. 2). Strong SFR evolution in normal disk galaxies since has been well documented (Bell et al., 2005; Zheng et al., 2007; Elbaz et al., 2007; Noeske et al., 2007), and has been attributed to the increase of gas fraction with redshift in these galaxies. Indeed, CO observations of massive SFGs at show significantly higher molecular gas content compared to local disk galaxies (Tacconi et al., 2010). According to Hopkins et al. (2009), the ratio between mass of gas consumed by an interaction-induced nuclear starburst and the disk gas mass decreases with increasing disk gas fraction as , where is the gas fraction (among the total baryonic mass) consumed by the starburst and the disk gas fraction. This is because the gravitational torque imposed by the stellar disk to the gas disk is less effective when is high, therefore less disk gas can sink to the nuclear region by losing angular momentum to stars. We argue that the negative cosmic evolution of the sSFR enhancement in S+S pairs is due to the increase of with redshift.
The sSFR enhancement in local () close major-merger pairs has been well established (Kennicutt et al., 1987; Xu & Sulentic, 1991; Barton et al., 2000; Nikolic et al., 2004; Ellison et al., 2008). Meanwhile, Xu et al. (2010) found that the enhancement only occurs in massive SFGs () in S+S pairs. Paired SFGs with low have in general higher than massive SFGs and show no significant sSFR enhancement. It is worth noting that studies of B-band selected interacting galaxies, which are biased for low mass SFGs, found no or very weak sSFR enhancement (Bergvall et al., 2003; Knapen & James, 2009). It is plausible that the high () plays a significant role in the non-enhancement of the sSFR in low mass paired SFGs.
There have only been a few previous statistical studies of the SFR of interacting galaxies in the universe at . Using UV and optical SFR indicators, which are prone to dust attenuation, both LeFévre et al. (2000) and Bridge et al. (2010) found that the SFR of interacting galaxies at are enhanced by a factor of compared to the field galaxies, and the SFR enhancement increases with the redshift. On the other hand, LeFévre et al. (2000) noticed a difference between “upcoming major-mergers” and “ongoing major-mergers”; the former do not show significant SFR enhancement (as measured by [OII] equivalent width). Bridge et al. (2010) also found that, in their sample of morphologically selected mergers, early stage mergers (close pairs with tidal bridges) have SFRs similar to field galaxies. These are consistent with our results of the non-enhancement for paired SFG at , because our pair selection favors early stage mergers. However, different from early stage mergers in LeFévre et al. (2000) and Bridge et al. (2010), SFGs in S+S pairs at do show significant sSFR enhancement in this study. Given that our pairs at different redshifts are selected using the same selection criteria, it is unlikely that the ratio between the early stage and late stage mergers changes with the redshift. Lin et al. (2007), comparing the median ( being derived from the 24 flux) of a sample of close pairs and that of pseudo-pairs constructed using conrol galaxies, found an enhancement of a factor of for pairs in the redshift range . However, by assigning a very low value () to undetected control galaxies, Lin et al. (2007) may have under-estimated the median of control pairs and over-estimated the enhancement of the close pairs (most being unresolved in the 24 survey). Our result on the mean 24 emission of S+S pairs in the high- bin differs from that of Lin et al. (2007), showing no enhancement compared to the controls (Table 2). Jogee et al. (2009) studied the SFR of morphologically selected mergers with , using both the UV and MIR (24 ) data, and found modest enhancement compared to normal galaxies. Studying an IR selected sample observed by Herschel, Hwang et al. (2011) found a factor of 1.8 – 4.0 sSFR enhancement for galaxies in close SFG-SFG pairs with redshifts between 0 and 1.2, with little variation in the enhancement versus redshift. However, given the blending effect, the true enhancement indicated by results of Hwang et al. (2011) is significantly less (by a factor of ). Also their results are consistent with a decreasing star formation enhancement at higher because higher sources are likely to be affected more severely by blending.
7.2. Cosmic Evolution of Extreme Starbursts
According to simulations (Scudder et al., 2012), samples of close pairs () include mostly merging galaxies undergoing the first close encounter and those just before the final coalescence, both stages lasting years. They miss final stage mergers (with the time scale of years) that are too close to be identified as binaries, and those already coalesced. Early IRAS observations (Kennicutt et al., 1987; Sanders & Mirabel, 1996) already revealed that final stage mergers show much stronger star-formation enhancement than paired galaxies, and extreme starbursts such as ULIRGs occur almost exclusively within these final stage mergers. Given the selection effects for pair samples, the cosmic evolution of these extreme starbursts is not probed by the data in this study.
On the other hand, there are indications in the literature that properties of extreme starbursts in final stage mergers might also change with redshift. Rujopakarn et al. (2011) found that ULIRGs at and sub-millimeter galaxies (SMGs) at have much more extended star-formation distributions than local ULIRGs, and argued that these are isolated galaxies with high . However, studying the morphology of 70 sources in the S-COSMOS survey, Kartaltepe et al. (2010) concluded that major mergers dominate the ULIRG population at . The CO and radio continuum observations of Biggs & Ivison (2008) and Engel et al. (2010) demonstrate that SMGs are also dominated by major mergers even though, different from local ULIRGs that typically have sizes of kpc (Rujopakarn et al., 2011), the extreme starbursts in high- mergers are much more extended ( kpc). These authors suggested that the difference between the size of local ULIRGs and that of high- SMGs is due to the selection effect in the sense that SMGs are preferentially earlier stage mergers than local ULIRGs. However, it is possible that the star-formation in high- SMGs (and high- ULIRGs) is less centrally peaked because the strength of the nuclear starburst is suppressed due to the higher gas fraction in the disk, according to the same physical mechanism (Hopkins et al., 2009) that we invoked in the interpretation for the weakening of the sSFR enhancement in higher z S+S pairs. It will be interesting to check in future studies whether the percentage of extreme starbursts (with sSFR enhancement a factor of 100) among major mergers also decreases with redshift.
7.3. SFGs in S+E Pairs: No sSFR Enhancement
For SFGs in S+E pairs, the sSFR enhancement index is consistent with 0 at all redshifts. This agrees with the Spitzer results of Xu et al. (2010) which showed no sSFR enhancement for SFGs in S+E pairs in any stellar mass bin in a local close major-merger pair sample. Hwang et al. (2011) also found that SFGs with close early-type neighbors are not sSFR enhanced. The difference between SFGs in S+S pairs and in S+E pairs indicates that, in addition to gravitational tidal effects, the sSFR in a paired galaxy is influenced by the immediate surrounding environment. This hypothesis is in agreement with the correlation between sSFR’s of the primaries and secondaries in major-merger S+S pairs (i.e. the “Holmberg effect”, Kennicutt et al. 1987; Xu et al. 2010). On the other hand, Xu et al. (2010) found no significant difference between the local densities around S+S and S+E pairs in their local pair sample, which is confirmed again here for pairs with – 1.0; the average counts of neighbors of within 1 Mpc projected distance and with (the 1 error of photo-z, Ilbert et al. 2009) are and for S+S pairs and S+E pairs, respectively. Therefore, the linear scale of the environment effect must be less than 1 Mpc. Because most galaxies in close major-merger pairs have entered the virial radius of the companions a long time ago, the two galaxies in a pair are likely to share the same IGM gas in a common dark matter halo (DMH). The non-enhancement of the sSFR in SFGs in S+E pairs and the “Holmberg effect” for S+S pairs suggest a significant role of the IGM within a DMH to the sSFR of galaxies residing in the DMH. For example, when a DMH has strong (weak) “cold flows” (Dekel et al., 2009; Keres et al., 2009), galaxies inside it may have abundant (scarce) cold gas supply to fuel active star-formation. This hypotheses seems particularly attractive because it can explain both the “Holmberg effect” for S+S pairs and the non-enhancement of the SFG in S+E pairs. Another scenario for the IGM modulation of the sSFR involves the hot IGM gas which can strip the cold ISM gas in embedded galaxies (Park & Choi, 2005), though this may have difficulty in explaining the “Holmberg effect” for S+S pairs because detections of the hot IGM gas around spiral galaxies are very rare (Bensen et al., 2000; Anderson & Bregman, 2011).
Acknowledgments: Dr Xianzhong Zheng is thanked for kindly providing the software and instructions for the “clean stacking”. We acknowledge support from the Science and Technology Facilities Council (grant number ST/I000976/1). PACS has been developed by a consortium of institutes led by MPE (Germany) and including UVIE (Austria); KU Leuven, CSL, IMEC (Belgium); CEA, LAM (France); MPIA (Germany); INAF-IFSI/OAA/OAP/OAT, LENS, SISSA (Italy); IAC (Spain). This development has been supported by the funding agencies BMVIT (Austria), ESA-PRODEX (Belgium), CEA/CNES (France), DLR (Germany), ASI/INAF (Italy), and CICYT/MCYT (Spain). SPIRE has been developed by a consortium of institutes led by Cardiff Univ. (UK) and including: Univ. Lethbridge (Canada); NAOC (China); CEA, LAM (France); IFSI, Univ. Padua (Italy); IAC (Spain); Stockholm Observatory (Sweden); Imperial College London, RAL, UCL-MSSL, UKATC, Univ. Sussex (UK); and Caltech, JPL, NHSC, Univ. Colorado (USA). This development has been supported by national funding agencies: CSA (Canada); NAOC (China); CEA, CNES, CNRS (France); ASI (Italy); MCINN (Spain); SNSB (Sweden); STFC, UKSA (UK); and NASA (USA). The data presented in this paper will be released through the Herschel Database in Marseille (HeDaM, http://hedam.oamp.fr/HerMES).
References
- Abraham et al. (1996) Abraham, R., Tanvir, N. K., Santiago, B. X., et al. 1996, MNRAS, 279
- Anderson & Bregman (2011) Anderson, M. E. & Bregman, J. 2011, ApJ, 737, 22
- Barton et al. (2000) Barton, E. J., Geller, M. J., & Kenyon, S. J. 2000, ApJ, 530, 660
- Baugh et al. (2005) Baugh, C. M. et al. 2005, MNRAS, 359, 119
- Bell et al. (2005) Bell, E. F., Papovich, C., Wolf, C., et al. 2005, ApJ, 625, 23
- Bensen et al. (2000) Bensen, A. J., Bower, B. G., Frenk, C. S., & White, S. D. M. 2000, MNRAS, 314, 555
- Bergvall et al. (2003) Bergvall, N., Laurikainen, E., & Aalto, S. 2003, A&A, 405, 31
- Berta et al. (2011) Berta, S., Magnelli, B., Nordon, R., et al. 2011, A&A, 532, 49
- Béthermin et al. (2012) Béthermin, M., LeFloc′h, E., Ilbert, O., et al. 2012
- Biggs & Ivison (2008) Biggs, A. D. & Ivison, R. J. 2008, MNRAS, 385, 893
- Bridge et al. (2007) Bridge, C. R., Appleton, P. N., Conselice, C. J., et al. 2007, ApJ, 659, 931
- Bridge et al. (2010) Bridge, C. R., Carlberg, R. G., & Sullivan, M. 2010, ApJ, 709, 1067
- Brinchmann et al. (1998) Brinchmann, J., Abraham, R., Shade, D., et al. 1998, ApJ, 499, 112
- Capak et al. (2007) Capak, P. et al. 2007, ApJS, 172, 284
- Conselice et al. (2000) Conselice, C. J., Bershady, M. A., & Jangren, A. 2000, ApJ, 529, 886
- Conselice et al. (2003) Conselice, C. J., Bershady, M. A., et al. 2003, AJ, 126, 1183
- Conselice et al. (2009) Conselice, C. J., Yang, C., C., & Bluck, A. F. L. 2009, MNRAS, 394, 1956
- Daddi et al. (2007) Daddi, E., Dickinson, M., Morrison, G., et al. 2007, ApJ, 670, 156
- Dekel et al. (2009) Dekel, A. et al. 2009, Nature, 475, 451
- Diolaiti et al. (2000) Diolaiti, E. et al. 2000, SPIE, 4007, 879
- Dole et al. (2006) Dole, H., Lagache, G., Puget, J.-L., et al. 2006, A&A, 451, 417
- Domingue et al. (2003) Domingue, D. L., Sulentic, J. W., Xu, C., et al. 2003, AJ, 125, 555
- Driver et al. (1995) Driver, S., Windhorst, R., Ostrander, E. J., et al. 1995, ApJL, 449
- Drory et al. (2009) Drory, N. et al. 2009, ApJ, 707, 1995
- Efron (1979) Efron, B. 1979, The Annals of Statistics, 7, 1
- Elbaz et al. (2007) Elbaz, D., Daddi, E., Borgne, D. L., et al. 2007, A&A, 468, 33
- Elbaz et al. (2011) Elbaz, D., Dickinson, M., Hwang, H. S., et al. 2011, A&A, 533, 119
- Ellison et al. (2008) Ellison, S. L., Patton, D. R., Simard, L., et al. 2008, AJ, 135, 1877
- Engel et al. (2010) Engel, H., Taconi, L. L., I.Davis, R., et al. 2010, ApJ, 724, 233
- Glazebrook et al. (1995) Glazebrook, K., Ellis, R., Santiago, B., & Griffiths, R. 1995, MNRAS, 275
- Griffin et al. (2010) Griffin, M. et al. 2010, A&A, 518
- Guiderdoni et al. (1998) Guiderdoni, B. et al. 1998, MNRAS, 295, 877
- Hopkins et al. (2009) Hopkins, P. F. et al. 2009, ApJ, 691, 1186
- Hwang et al. (2011) Hwang, H. S., Elbaz, D., Dickinson, M., et al. 2011, A&A, 535, 60
- Ilbert et al. (2009) Ilbert, O. et al. 2009, ApJ, 690, 1236
- Ilbert et al. (2010) —. 2010, ApJ, 709, 644
- Jogee et al. (2009) Jogee, S., Miller, S. H., Penner, K., et al. 2009, ApJ, 697, 1971
- Kartaltepe et al. (2007) Kartaltepe, J. S. et al. 2007, ApJS, 172, 320
- Kartaltepe et al. (2010) —. 2010, ApJ, 721, 98
- Kennicutt et al. (1987) Kennicutt, R. C., Keel, W., van der Hulst, J., et al. 1987, AJ, 93, 1001
- Kennicutt et al. (2003) Kennicutt, R. C. et al. 2003, PASP, 115, 928
- Keres et al. (2009) Keres, D. et al. 2009, MNRAS, 309, 160
- Knapen & James (2009) Knapen, J. H. & James, P. 2009, ApJ, 698, 1437
- LeFévre et al. (2000) LeFévre, O., Abraham, R., & Lilly, S. J. 2000, MNRAS, 311, 565
- LeFloc′h et al. (2009) LeFloc′h, E., Aussel, H., Ilbert, O., et al. 2009, ApJ, 703, 222
- Levenson et al. (2010) Levenson, L., Marsden, G., Zemvov, M., et al. 2010, ApJ, 709, 97
- Lin et al. (2007) Lin, L., Koo, D. C., Weiner, B. J., et al. 2007, ApJL, 660, 51
- Lin et al. (2008) Lin, L., Patton, D. R., & Koo, D. C. 2008, ApJ, 681, 232
- Lonsdale et al. (2003) Lonsdale, C. J. et al. 2003, PASP, 115, 897
- Lotz et al. (2008) Lotz, J. M., Davis, M., Faber, S. M., et al. 2008, ApJ, 672, 177
- Lutz et al. (2011) Lutz, D. et al. 2011, A&A, 532, 90
- Marsden et al. (2009) Marsden, G., Ade, P. A., Bock, J. J., et al. 2009, ApJ, 707, 1729
- Nguyen et al. (2010) Nguyen, H. T. et al. 2010, A&A, 518
- Nikolic et al. (2004) Nikolic, B., Cullen, H., & Alexander, P. 2004, MNRAS, 355, 874
- Noeske et al. (2007) Noeske, K. G., Weiner, B. J., Faber, S. M., et al. 2007, ApJL, 660, 43
- Oliver et al. (2012) Oliver, S. et al. 2012, arXiv: 1203.2562
- Pannella et al. (2009) Pannella, M., Carilli, C. L., Daddi, E., et al. 2009, ApJ, 698, 116
- Park & Choi (2005) Park, C. & Choi, Y.-Y. 2005, ApJ, 635
- Peng et al. (2010) Peng, Y. et al. 2010, ApJ, 721, 193
- Pilbratt et al. (2010) Pilbratt, G. L. et al. 2010, A&A, 518
- Poglitsch et al. (2010) Poglitsch, A. et al. 2010, A&A, 518
- Rodighiero et al. (2011) Rodighiero, G., Daddi, E., Baronchelli, I., et al. 2011, ApJ, 739, 40
- Rujopakarn et al. (2011) Rujopakarn, W., Rieke, G. H., Eisenstein, D. I., & Juneau, S. 2011, ApJ, 726, 93
- Sanders & Mirabel (1996) Sanders, D. B. & Mirabel, I. F. 1996, ARA&A, 34, 749
- Sanders et al. (2007) Sanders, D. B. et al. 2007, ApJS, 172
- Scudder et al. (2012) Scudder, J. M. et al. 2012, arXiv: 1207.4791
- Shi et al. (2009) Shi, Y., Rieke, G., Lotz, J., et al. 2009, ApJ, 697, 1764
- Somerville et al. (2000) Somerville, R. S. et al. 2000, MNRAS, 320, 504
- Swinyard et al. (2010) Swinyard, B. et al. 2010, A&A, 518
- Tacconi et al. (2010) Tacconi, L. J. et al. 2010, Nature, 463, 387
- Werner et al. (2004) Werner, M. W. et al. 2004, ApJS, 154, 1
- Wuyts et al. (2011) Wuyts, S., Forster, S., Natascha, M., et al. 2011, ApJ, 738, 106
- Xu et al. (2001) Xu, C., Lonsdale, C. J., Shupe, D. L., O’Linger, J., & Masci, F. 2001, ApJ, 562, 179
- Xu & Sulentic (1991) Xu, C. & Sulentic, J. W. 1991, ApJ, 374, 407
- Xu et al. (2010) Xu, C. K., Domingue, D., Cheng, Y., et al. 2010, ApJ, 713, 330
- Xu et al. (2012) Xu, C. K., Zhao, Y., Scoville, N., et al. 2012, ApJ, 747, 85
- Zheng et al. (2007) Zheng, X. Z., Bell, E. F., Papovich, C., et al. 2007, ApJL, 661, 41