Modelling Observational Constraints for Dark Matter Halos
Abstract
Observations show that the underlying rotation curves at intermediate radii in spiral and low-surface brightness galaxies are nearly universal. Further, in these same galaxies, the product of the central density and the core radius () is constant. An empirically motivated model for dark matter halos which incorporates these observational constraints is presented and shown to be in accord with the observations. A model fit to the observations of the galaxy cluster Abell 611 shows that for the dark matter halo in this more massive structure is larger by a factor of over that assumed for the galaxies. The model maintains the successful NFW form in the outer regions although the well defined differences in the inner regions suggest that modifications to the standard CDM picture are required.
1 Introduction
Recent observations suggest that many spiral galaxies possess constant density cores whose central densities are related to their core radii. In addition these same galaxies possess nearly universal rotation curves at intermediate radii after removal of the baryonic component. These observations are used to construct a simple empirical model for the density distribution of dark matter halos. This is done without prejudice for any specific model of structure formation although the model is designed to retain the sucessful NFW form (Navarro et al. 1997) in the outer regions.
For many years we have relied on sophisticated cosmological simulations to provide guidance on the distribution of dark matter (hence the NFW profile). Only relatively recently has observational data on the distribution of dark matter over a large range in radius become available (e.g. the data on the galaxy cluster Abell 611 from Newman et al. 2009). If the empirical model derived from the galaxy sample above is to describe all dark matter halos and hence to provide constraints on the properties of the dark matter particle itself then it is important to test it on as many scales and morphologies as possible. For this reason we include an application of our model to the observations of the galaxy cluster Abell 611.
2 The Model
The model is motivated by two independent observational results. The first is from Donato et al. (2009) who showed that the product of the central dark matter density and its core radius (the radius within which the density remains approximately constant) is a constant with a value of . Salucci et al. (2011) emphasize that this result extends to the dwarf spheroidal galaxies as well. This result builds upon earlier work by Kormendy & Freeman (2004). The second observational result is from the work of McGaugh et al. (2007). Here an apparently universal relation between rotational velocity and radius at intermediate radii in 60 spiral galaxies is found after removal of the contributions from the stars and gas. Walker et al. (2010) then extend the same relation to dwarf spheroidal and low-surface-brightness (LSB) galaxies.
In order to account for the above observational results the following density profile is proposed
| (1) |
where is the constant central density, is a scale factor, and is a second scale factor and is defined as where . The core radius () is defined as that radius where the density has fallen to . (This is the definition of core radius from the Burkert (1995) profile). The observations show that is a constant so that for a given assumed value of and , found from a solution of the following cubic equation will satisfy this constraint.
| (2) |
Note that with given by the observations the problem contains only the two free parameters and .
The mass enclosed within radius is given by
| (3) |
where and .
The outer boundary of the model occurs when ( assumed). Given that this boundary condition is the same as that assumed for standard CDM, the predicted baryonic Tully-Fisher relation here is also the same (i.e. ), (e.g. Steinmetz & Navarro 1999).
In order to tie the above density distribution to a solution of the Jean’s equation we use the pseudo-phase-space density as the second variable. This variable has interesting properties which could be relevant to the structure formation problem (Hogan & Dalcanton, 2000; Dalcanton & Hogan , 2001). was shown by Taylor and Navarro (2001) to vary with radius as in the NFW model. In order to maintain this behaviour in the outer region of the above model and to keep the problem simple we assume the following form for the radial dependence of
| (4) |
With the spherical Jean’s equation written in terms of and (Hartwick, 2008) and the above differentiable analytical expressions for both variables the solution is the run of the anisotropy parameter (Binney & Tremaine, 1987) i.e.
| (5) |
with and as free paramters (for fixed and ). By choosing and varying until at solutions were found where rose smoothly from zero at the center to a maximum of followed by a not so smooth descent to zero at the outer boundary (e.g. Navarro et al. 2010, Fig. 10). Adding an extra parameter to (4) (e.g. equ’n (1) of Hartwick, 2008) results in some smoothing and changes by even if is allowed to remain at or higher than its maximum value at the outer boundary. Ultimately the observations must show the true behaviour of the run of . was determined by iteration using the secant method.
Under the assumption that as approaches unity a minimum mass is found for each value of assumed. In the case of , for example, this minimum is with . As the mass is increased at fixed central density (by increasing ) slowly decreases. At this minimum mass increases to with . More solutions are shown in the next section where they are compared to the observations.
3 Comparison with the Observations
In this section we show a comparison between the model and a sample of observations. Unless otherwise stated the models were computed assuming that .
3.1 The Fornax Dwarf Spheroidal
Figure 1 shows the results of several analyses of the stellar kinematics of Fornax. Plotted in the plane are results from Strigari et al. (2007); Strigari et al. (2008); Walker et al. (2010) & Amorisco & Evans (2011) plotted as filled circles. The two open circles are from the work of Walker & Penarrubia (2011) whose analysis makes use of two independent stellar populations within the galaxy. Parameters of the model shown (solid line) are .
3.2 Spiral and LSB Galaxies
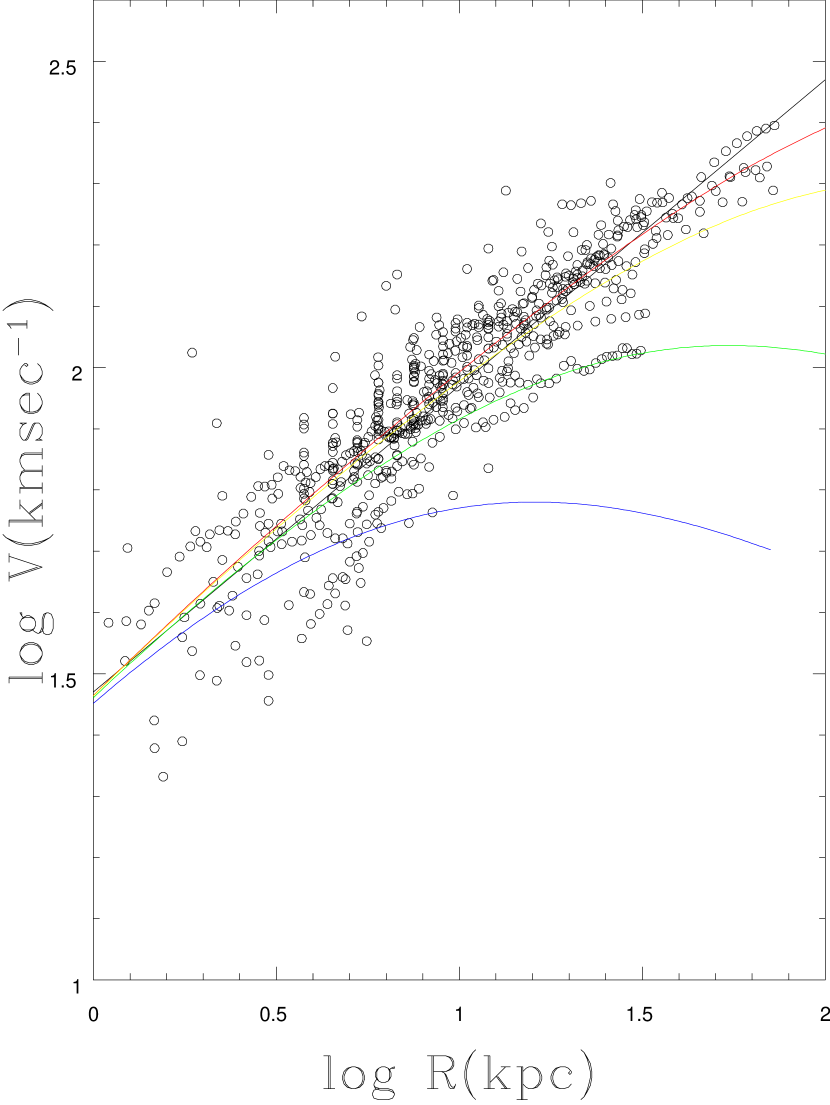
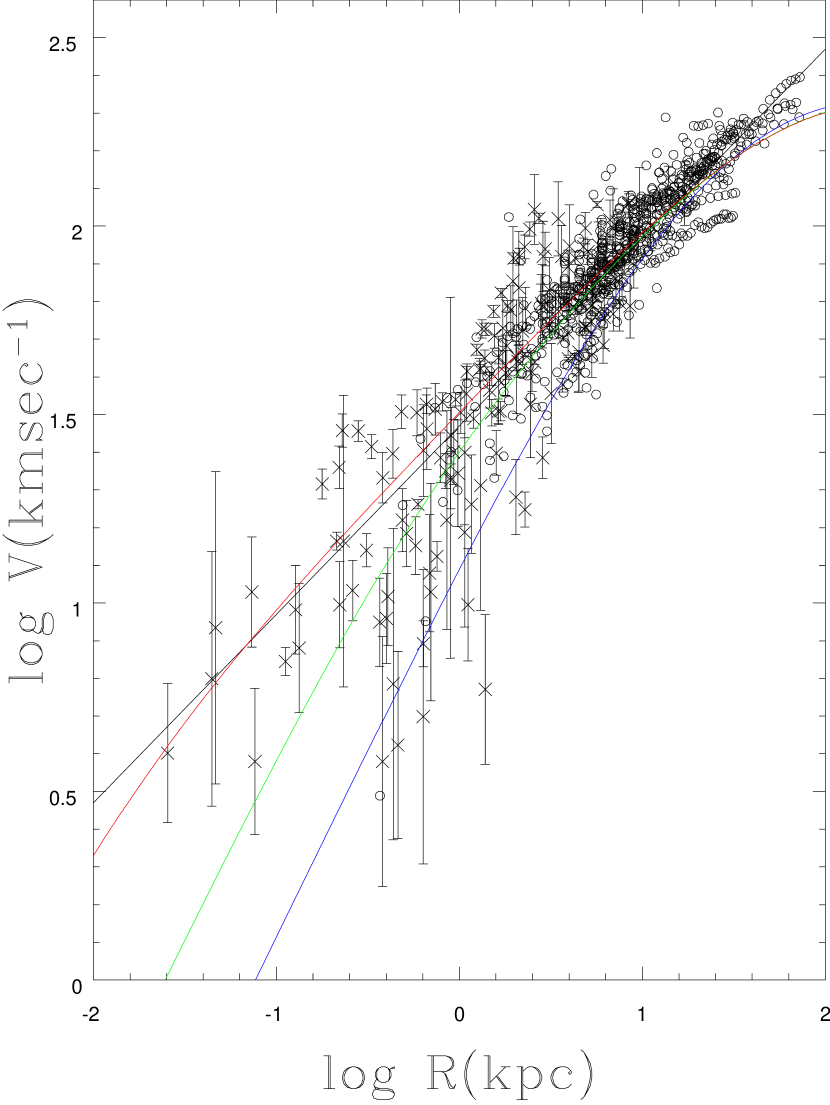
Figures 2 & 3 show the models superimposed on the observations of McGaugh et al. (2007) of spiral galaxies (open circles) and a sample of LSB galaxies (crosses) Kuzio de Naray et al. (2010). The spiral galaxy sample has had the mass in stars and gas removed. Figure 2 shows 4 models with density and values of indicated . This is to be compared to the upper Figure 3 of McGaugh et al. (2007) where NFW models are superimposed on the same data. Note how the relation between concentration index (c) and mass cause each NFW solution to be separated from the other whereas the solutions here are approximately asymptotic about the solid black line. This line shown extended in Fig. 3 is a least squares fit to the spiral data alone and has a logarithmic slope of 0.5 (McGaugh et al. 2007). Figure 3 shows the same data superimposed by 3 models all with but different central densities (red, 5.0; green, 0.1 & blue, ) which illustrates the point that models with the same mass can have different dark matter distributions.
3.3 Clusters of Galaxies
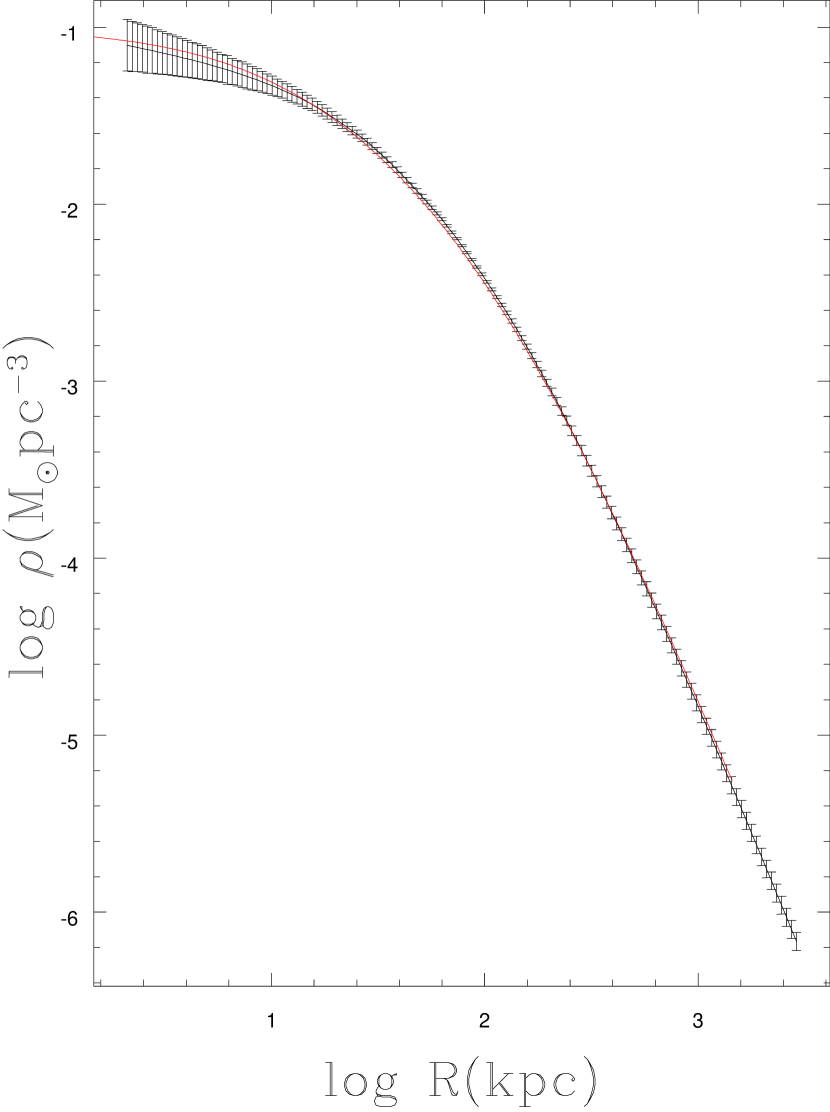
Up to this point, all model results have been obtained by assuming . This assumption appears to break down when attempting to fit the model to the observations of the galaxy cluster Abell 611 (Newman et al. 2009). These authors used a combination of weak and strong lensing along with spectroscopy of the central galaxy to obtain the dark matter distribution over a very large range in radius. In order to obtain a reasonable fit to the above observations, the model required that (i.e. roughly times the value assumed for the galaxies).
Recently Newman et al. (2012) have presented the results of a similar analysis for 7 massive clusters including Abell 611. The authors fit to each cluster a density profile similar to equ’n (1) but with a different parameterization. Their paper does not contain enough information to compute individual values of . However from their Fig. 3, we estimate that the central densities are and with mean core sizes (their generally will be less than our ) of appears to be at least 10 times higher than the galaxy value. Observations of intermediate mass structures are needed to determine whether the relation between and dark halo mass is continuous.
Our model fit to Abell 611 is shown in Figure 4 as the red line. The model parameters are and a mass .
4 Summary
The observations show that many spiral, and LSB galaxies exhibit a nearly universal relation between the underlying rotational velocity and radius at intermediate radii and a relation between the central density and core radius such that their product is a constant. A model is constructed based on these contraints and results are shown to be consistent with the observations and to differ in the inner region from predictions based on the NFW profile of CDM. Specifically, in addition to the galaxies possessing a dark matter core, the mass-concentration relation appears to be absent and for central densities above a mass dependent threshold density dark halos of the same total mass can have different internal structures i.e. larger central densities and smaller core radii.
The model was also fit to the observations of the galaxy cluster Abell 611. It was found that the central density-core radius relation had to be times higher than that found for the galaxy sample. A recent study of the density profile of 7 massive clusters by Newman et al. (2012) also suggests a significantly higher value. Additional observations are required to determine if varies continuously between the masses of the dark matter halos of the galaxies and those of the galaxy clusters.
The model provides an empirically-motivated cored template which may be useful for disentangling the relative contributions of dark matter and baryons in other types of galaxies such as the ellipticals.
Should the observational constraints which define the model be shown to be compatible with other galaxy types (e.g. the ellipticals) then accounting for them will strengthen the need for major modifications to the standard CDM picture.
One way to modify CDM is to invoke the idea that the dark matter particles are self interacting (e.g. Spergel & Steinhardt 2000). If the mean free path of the particles is of the order of the core size , then the scattering coefficient will be . In the case of Abell 611 this quantity in cgs units is . However to be consistent with the value for the galaxies, , the scattering coefficient could be energy dependent given the difference in mass between the galaxies and the clusters. Such an energy dependent scattering coefficient has been investigated by Loeb & Weiner (2011). A further consideration is that if the coefficient is sufficiently large the halo is subject to core collapse within a Hubble time (e.g. Burkert 2000). Clearly, many uncertainties with this scheme remain.
The self interacting dark mattter (SIDM) picture mentioned above is but one of several which have been proposed to explain the presence of cores in dark matter halos. An up-to-date list is discussed in the paper by Newman et al. (2012). The challenge for any theory is to predict the observed relation between and . The continuing observational program of separating the distribution baryons and dark matter on all scales and for all morphological structures should eventually lead to the correct scenario.
References
- (1)
- (2) Amorisco, N. C., & Evans, N. W. 2011, MNRAS, 411, 2118
- (3)
- (4) Binney, J., & Tremaine, S. 1987, Galactic Dynamics, (Princeton: Princeton University Press)
- (5)
- (6) Burkert, A. 1995, ApJ, 447, L25
- (7)
- (8) Burkert, A. 2000, ApJ, 534, L143
- (9)
- (10) Dalcanton, J.J., & Hogan, C.J. 2001, ApJ, 561, 35
- (11)
- (12) Donato, F., Gentile, G., Salucci, P., Frigerio Martins, C., Wilkinson, M. I., Gilmore, G., Grebel, E. K., Koch, A., & Wyse, R. 2009, MNRAS, 397, 1169
- (13)
- (14) Hartwick, F. D. A. 2008, ApJ, 674, 220
- (15)
- (16) Hogan, C. J. & Dalcanton, J. J. 2000, Physical Review D, 62, 063511
- (17)
- (18) Kormendy, J., & Freeman, K. C. 2004, IAU Symposium 220, 377
- (19)
- (20) Kuzio de Naray, Rachel, Martinez, Gregory D., Bullock, James S., Kaplinghat, Manoj 2010, ApJ, 710, L161
- (21)
- (22) Loeb, Abraham, & Weiner, Neal 2011, Physical Review Letters, 106, 171302
- (23)
- (24) McGaugh, S. S., de Blok, W. J. G., Schombert, J. M., Kuzio de Naray, R., Kim, J. H. 2007, ApJ, 659,149
- (25)
- (26) Navarro, Julio F., Frenk, Carlos S., & White, Simon D. M. 1997, ApJ, 490, 493
- (27)
- (28) Navarro, Julio F., Ludlow, Aaron, Springel, Volker, Wang, Jie, Vogelsberger, Mark, White, Simon D. M., Jenkins, Adrian, Frenk, Carlos S., & Helmi, Amina 2010, MNRAS, 402, 21
- (29)
- (30) Newman, Andrew B., Treu, Tommaso, Ellis, Richard S., Sand, David J., Richard, Johan, Marshall, Philip J., Capak, Peter, & Miyazaki, Satoshi 2009, ApJ, 706, 1078
- (31)
- (32) Newman,Andrew B., Treu, Tommaso, Ellis, Richard S., & Sand, David J. 2012, ApJ, in press, astro-ph:1209.1392v1
- (33)
- (34) Salucci, Paolo, Wilkinson, Mark I., Walker, Matthew G., Gilmore, Gerard F., Grebel, Eva K., Koch, Andreas, Frigerio Martins, Christiane, & Wyse, Rosemary F. G. 2012, MNRAS, 420, 2034
- (35)
- (36) Spergel, D. N. & Steinhardt, P. J. 2000, Physical Review Letters, 84, 3760
- (37)
- (38) Steinmetz, M. & Navarro, J. F. 1999, ApJ, 513, 555
- (39)
- (40) Strigari, Louis E., Bullock, James S., Kaplinghat, Manoj, Diemand, Juerg, Kuhlen, Michael, & Madau, Piero 2007, ApJ, 669, 676
- (41)
- (42) Strigari, Louis E., Bullock, James S., Kaplinghat, Manoj, Simon, Joshua D., Geha, Marla, Willman, Beth, & Walker, Matthew G. 2008, Nature, 454, 1096
- (43)
- (44) Taylor, James E., & Navarro, Julio F. 2001, ApJ, 563, 483
- (45)
- (46) Walker, Matthew G., McGaugh, Stacy S., Mateo, Mario, Olszewski, Edward W., Kuzio de Naray, Rachel 2010, ApJ, 717, l87
- (47)
- (48) Walker, Matthew G., & Peñarrubia, J. 2011, ApJ, 742, 20
- (49)
- (50) Walker, Matthew G., Mateo, Mario, Olszewski, Edward W., Peñarrubia, Jorge, Wyn Evans, N., & Gilmore, G. 2010, ApJ, 710, 886
- (51)