The Infrared Ca II lines in Sunspot Umbrae
Abstract
Aims. We present an empirical working model for sunspot umbrae which equally describes observed continuum intensities and line profiles.
Methods. The wings of the infrared Ca II lines depend sensitively on the temperature gradient at but not essentially on the absolute value of . These lines are observed to remain almost unchanged from photosphere to umbra and are thus insensitive to parasitic light. It is also shown that the infrared K I 7699Å line is suitable for umbral spectroscopy since it is not seriously blended, its continuum is well defined and it is less influenced by parasitic light as compared to lines in the visible spectrum, due to the smaller umbal contrast.
Results. Calculations show that the umbral gradient , required to fit the Ca II triplet lines, strongly conflicts with the observed profiles of K I 7699, Na D2 and Fe I 5434 (g=0), even when assuming vanishing Fe II lines for a maximum correction of parasitic light. It is shown that the discrepancy from the different line profiles may be removed by adopting an opacity enhancement as introduced by Zwaan (1974) from a discussion of continuum contrasts alone. The finally proposed umbral working model is very close to a scaled model of the quiet Sun with K thus resembling a M0 rather than a K5 stellar atmosphere.
Key Words.:
Sunspot umbra - line profiles - empirical model - effective temperature1 Introduction
A sensitive method for the determination of the empirical model atmospheric of a sunspot umbra is the investigating line profiles. The infrared Ca II triplet lines (at 8498, 8542, and 8662Å) have so far not been considered. Calculations show that the wings of these lines are very sensitive to the temperature gradient at but much less sensitive to the absolute value of the temperature. Cursory inspection of umbral spectra shows that these triplet lines are largely unchanged when compared to the spectrum of the neighboring photosphere. This implies an almost negligible influence of parasitic light, which anyway is reduced with respect to the visible region due to the smaller continuum contrast. In addition, the wavelength region around 8500Å seems not seriously perturbed by purely umbral lines.
2 Observations
We investigated the infrared Ca II lines from several sunspot spectra observed in summer 1967, 1968, and 1979 at the Locarno solar station of the Göttingen observatory with the plane grating spectrograph (Czerny-Turner type) at high dispersion (0.2Å/mm) and also with the concave grating spectrograph (Pasche-Rungen mounting) at low dispersion (2.5Å/mm). Microphotometry of the infrared Ca II lines in these umbral spectra consistently shows no significant difference with the simultaneously observed line profiles in the neighboring photosphere. For further confirmation of this interesting result we recorded photoelectrically the line-to-continuum ratio of these Ca II lines in a spot near the disc center on July 7, 1979, and obtain the same result.
Those of our observed Ca II IR lines which occasionally show emission cores, always yield symmetric ones for Ca II 8542 but asymmetric ones for 8Ca II 498 and Ca II 8662 with opposite sign: Ca II 8498 has a steeper blue, Ca II 8662 a steeper red flank of its core emission.
In addition to these lines, spectra of the strong K I 7699 line were investigated in the same manner. In contrast to the Ca II lines, this K I line is not unchanged and therefore strongly affected by parasitic light. A maximum correction has been applied by assuming Fe II 7711 to vanish in umbrae (cf. Stellmacher and Wiehr, 1970). A first photoelectric recording of this K I line was obtained in the July 7, 1979, spot with particular care for parasitic light correction, which typically consists of 5% penumbral blurring and % photospheric scattering (in units of the photospheric continuum intensity).
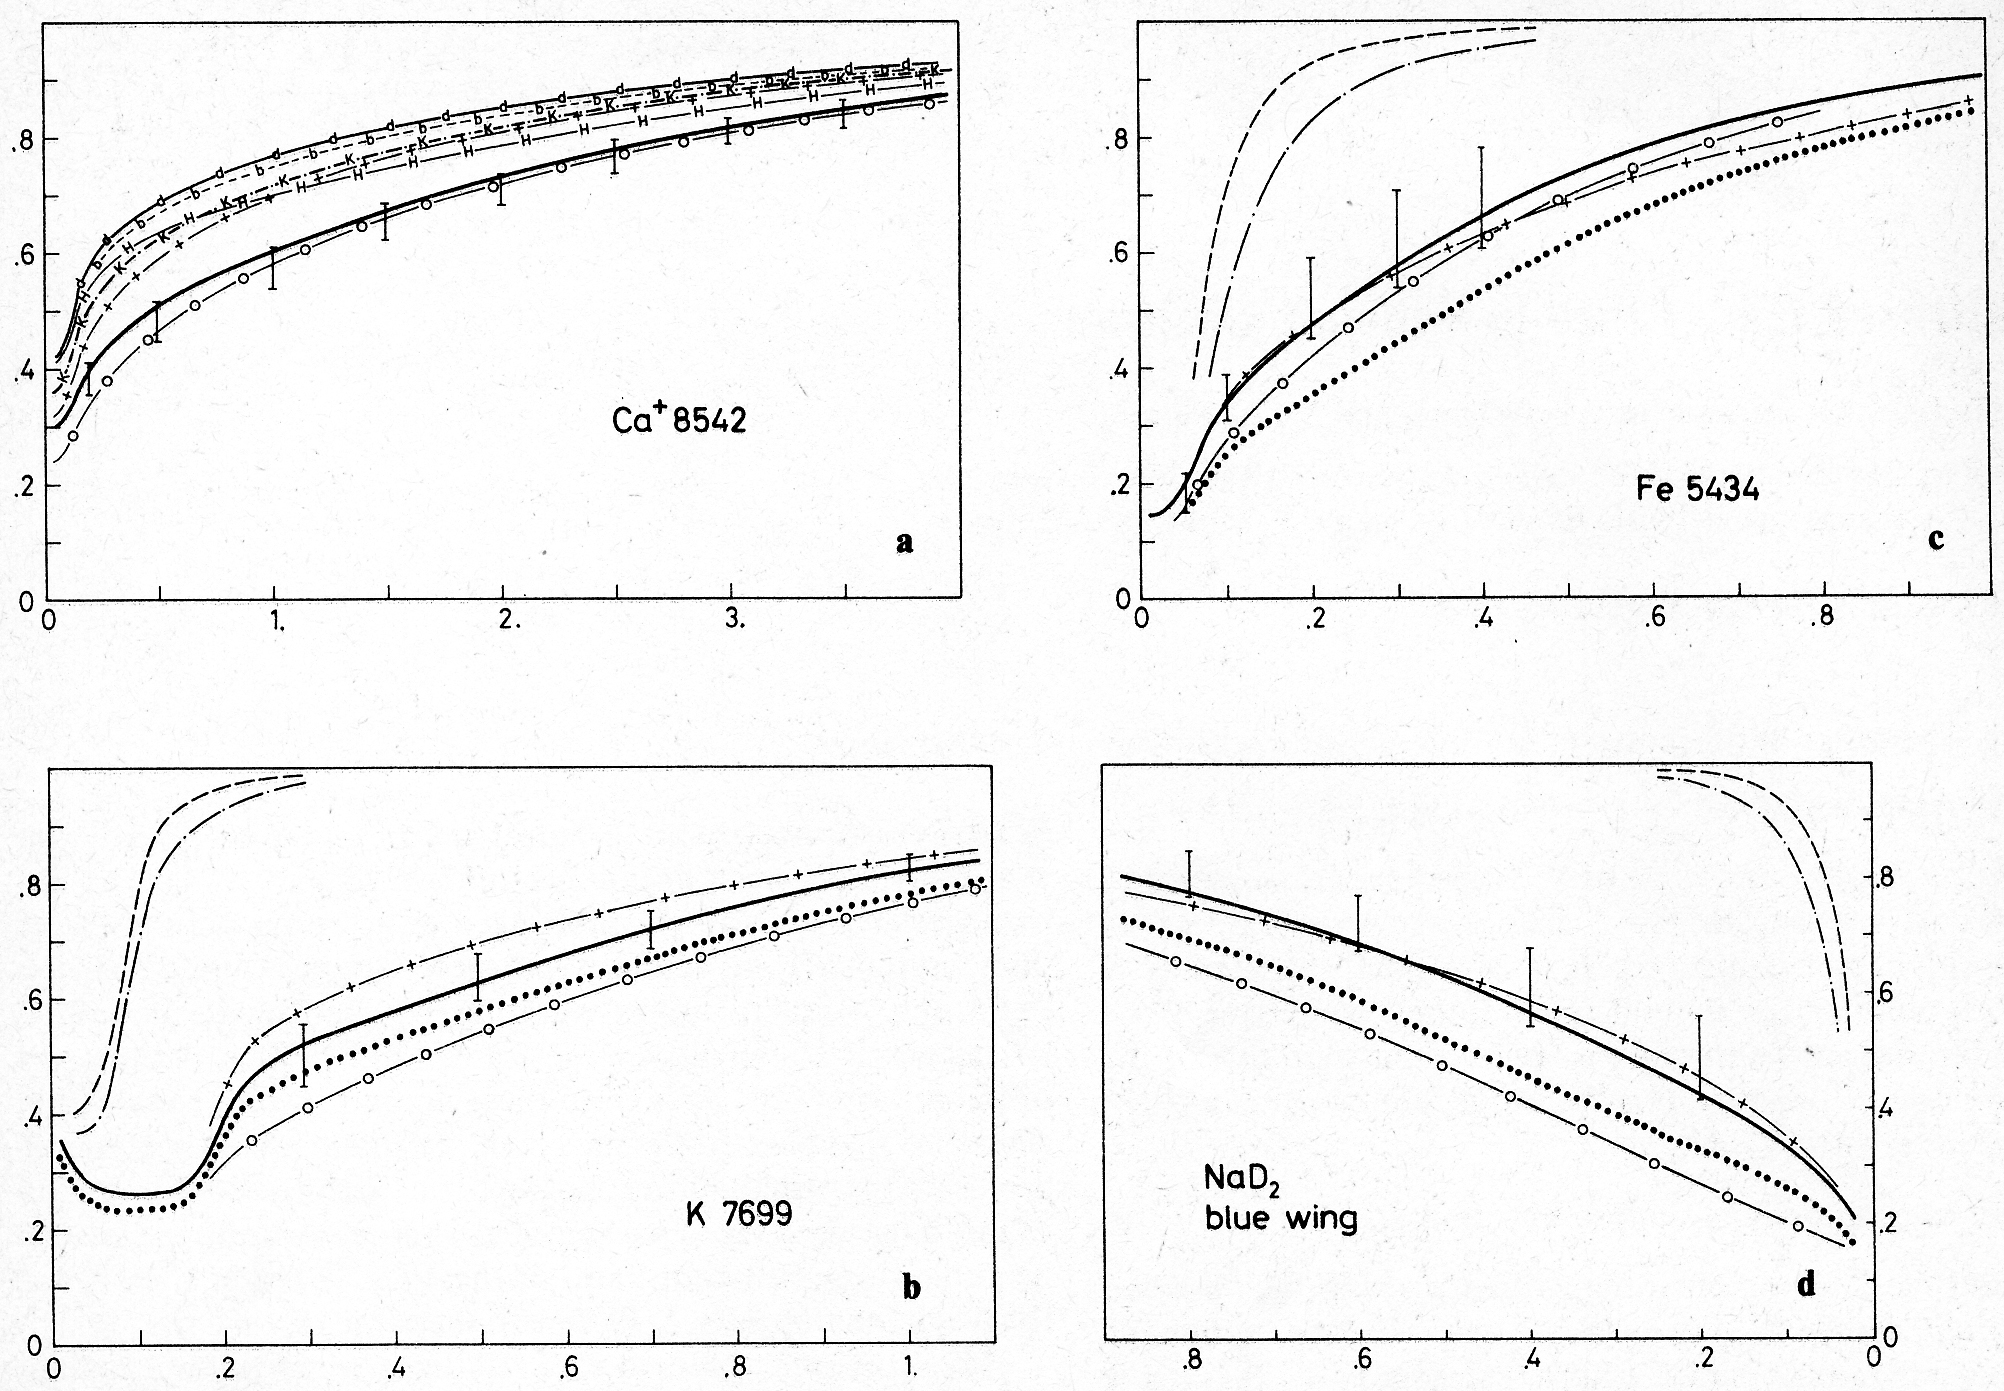
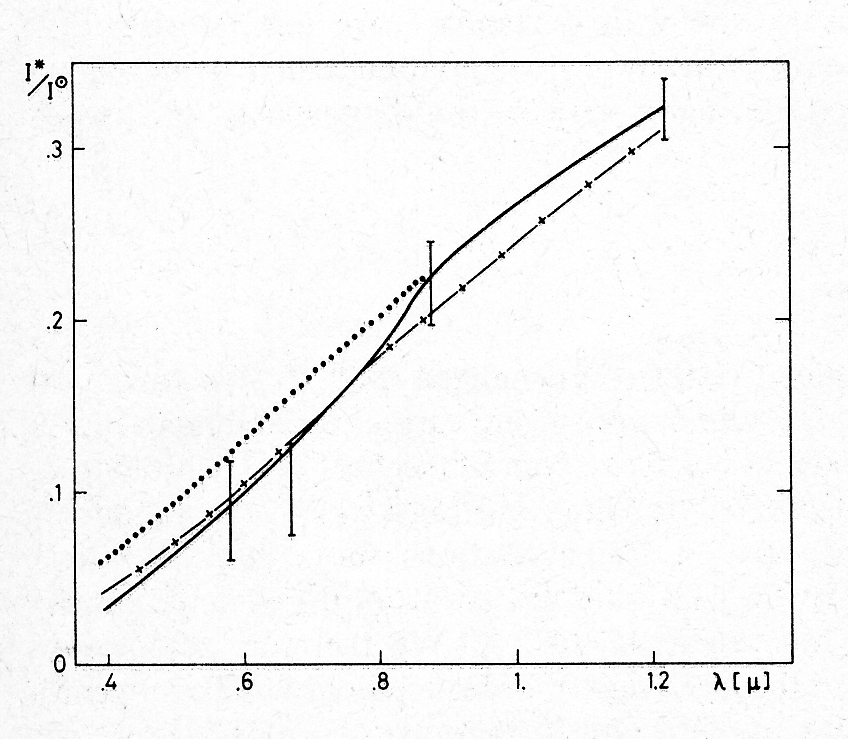
Figure 1 shows calculated profiles of Ca II 8542, K I 7699, NaD2 and Fe I 5434 (g = 0) using different empirical models. It can be seen that the strong criterion of the unchanged Ca II lines is only reproduced by Zwaan’s (1974) umbral model. Closer inspection shows that this agreement is essentially due to the high temperature gradient in the region , where the line wings are formed. On the other hand, it was shown by Stellmacher and Wiehr (1975) that Zwaan’s (1974) model does not reproduce the wings of NaD2 and Fe 5434 within the observational limits given by vanishing and, respectively, maximum correction for parasitic light. This also holds when considering our observations of the K 7699 line wings (see Fig. 1). The K line shows a similar temperature sensitivity as NaD2, but it is much less influenced by parasitic light due to the almost two times smaller umbral continuum contrast at 7700Å as compared to 5900Å.
We tried to alter the temperature stratification of the Stellmacher and Wiehr (1975) model in order to obtain a better representation of the infrared Ca II lines without loosing the good fit of this model to the lines Fe 5434, NaD2 and also the newly included K 7699 line. Our calculations show that those temperature stratifications which do fit the Ca II lines contradict the observations of either the profiles of Fe 5434, NaD2 and K 7699 or of the relative umbra-to-photosphere continuum intensities (of at 5900Å and at 7700Å; see e.g. Zwaan, 1974). Preserving the temperature gradient required to fit the Ca II lines and shifting the curve towards higher T (at constant , a good representation of Fe 5434, NaD2, and K 7699 is achieved. A shift towards lower T, however, is required to fit the observed continuum contrasts. Any ’compromise’ model between these two cases clearly yields Ca II lines and continuum contrasts significantly above, and Fe 5434, NaD2, K 7699 profiles significantly below the range defined by uncorrected and maximum corrected observations.
3 Discussion
A reasonable fit to all observed lines and continuum data (see Fig. 2) could be achieved when introducing the opacity enhancement for Å as suggested by Zwaan (1974). Several alterations of the dependence did not improve this fit. The concept of an opacity enhancement for sunspot umbrae had been proposed since the wavelength variation of umbral continuum intensities at cannot be reproduced by a model even when assuming a maximum temperature gradient from a radiative equilibrium stratification.
On the other hand, Stellmacher and Wiehr (1975) argue that the range of observed umbral continuum data and the uncertainties of the photospheric reference intensities still allow a radiative equilibrium stratification without introducing an opacity enhancement. In that case, their model M3 gives the intensity at its upper and the intensity at its lower observational limits (Stellmacher and Wiehr, 1975, cf. Fig. 1). On the other hand, model M3 nicely describes the observed Fe 5434 and NaD2 line wings.
The consideration of observed infrared Ca II lines in addition that of Fe 5434, NaD2, K 7699 and the corresponding continuum data gives further support to the existence of an enhanced opacity, which originally had been proposed by Zwaan (1974) for a good representation of umbral continuum contrasts alone.
Our present observations do not allow to essentially refine the given by Zwaan. In particular, we can not verify whether further increases at Å, which might give some hint to the still unknown physical nature of the opacity enhancement. A possible explanation is line haze produced by atomic and molecular lines (Zwaan, 1974; Gaur et al., 1979) and/or unknown continuum absorbers (as e.g. proposed by Oinas, 1974, 1977, for cool stars).
3.1 Umbral model
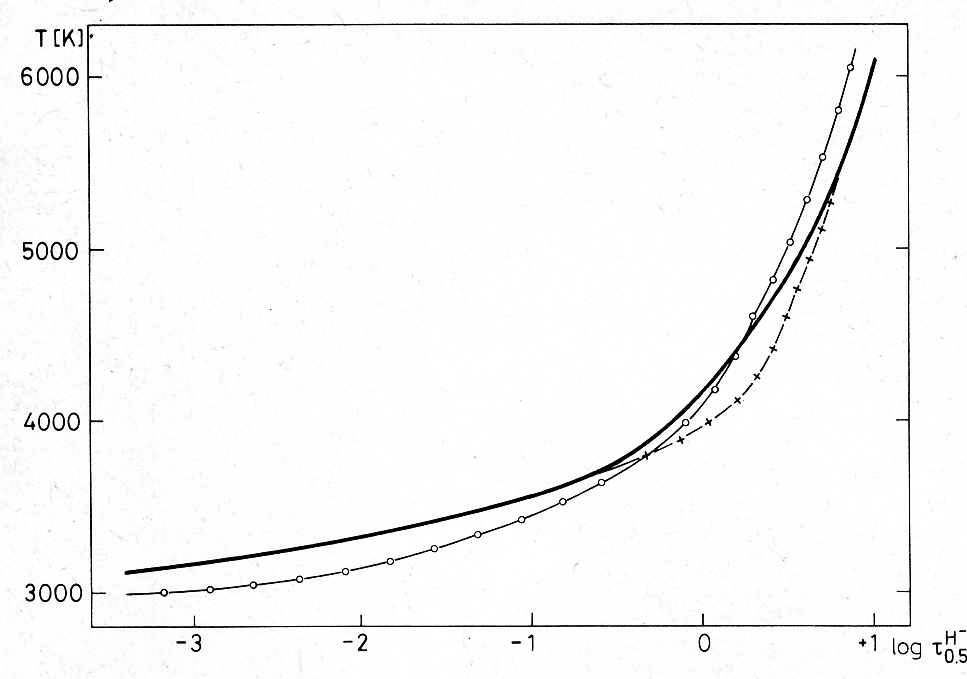
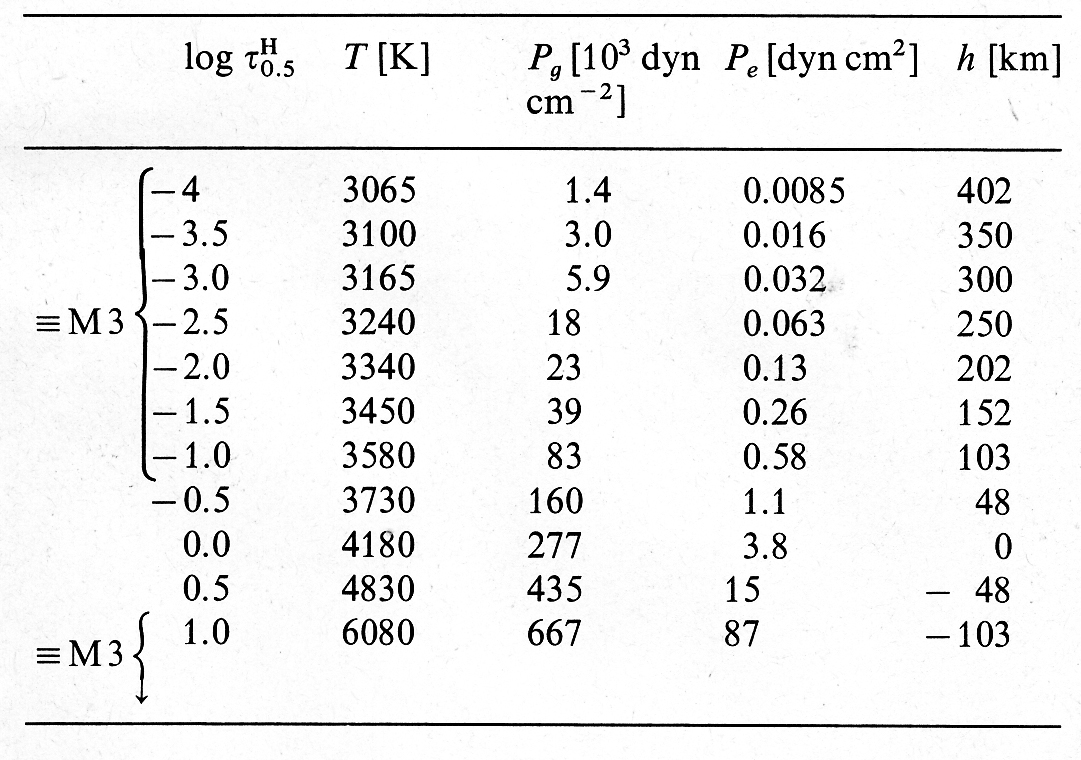
Our improved model ’M4’, is given in Fig. 3 together with our former model M3 and with Zwaan’s (1974) model. The new model M4, listed in the table, differs from M3 only for the layers in order to fit to the observed infrared Ca II lines discussed in this paper. For the outer layers M4 is identical with M3 to preserve the description of observed non-magnetic lines as discussed by Stellmacher and Wiehr (1970 and 1972). Also the deep layers of M4 agree with M3 in order to meet the radiative equilibrium stratification, which is required for to fit the infrared C I lines discussed by Stellmacher and Wiehr (1975).
The final umbral model M4 then optimally describes the whole range of continuum and line profile observations. It can thus be considered as an empirical working model with wide validity for dark umbral cores. Its temperature stratification is close to a scaled model of the undisturbed Sun with a scaling factor of K and thus to a M0 rather than a K5 stellar atmosphere.
Acknowledgements.
We thank H. Schleicher for helpful discussions and his LTE code. The Locarno observatory is operated by the German Science Foundation, DFG.References
- (1) Brault, J.: 1976 (private communication)
- (2) Ekmann, G., Maltby, P.: 1974, Solar Phys. 35, 317
- (3) Gaur, V. P., Pande, M. C, Sah, M.: 1979, Solar Phys. 62, 83
- (4) Henoux, J. C.: 1969, Astron. Astrophys. 2, 288
- (5) Kjeldseth-Moe, K. O., Maltby, P.: 1974, Solar Phys. 36, 109
- (6) Kneer, F.: 1972, Astron. Astrophys. 18, 39
- (7) Oinas, V.: 1974, Astrophys. J. Suppl. 27, 405
- (8) Oinas, V.: 1977, Astron. Astrophys. 61, 17
- (9) Schleicher, H.; 1977, Thesis Göttingen
- (10) Shine, R. A., Linsky, J. L.: 1972, Solar Phys. 25, 357
- (11) Stellmacher, G., Wiehr, E.; 1970, Astron. Astrophys. 7, 432
- (12) Stellmacher, G., Wiehr, E.; 1972, Astron. Astrophys. 19, 293
- (13) Stellmacher, G., Wiehr, E.: 1975, Astron. Astrophys. 45, 69
- (14) Zwaan, C.: 1974, Solar Phys. 37, 99