11email: A.L.Melchior@obspm.fr,Francoise.Combes@obspm.fr 22institutetext: Université Pierre et Marie Curie-Paris 6, 4, Place Jussieu, F-75 252 Paris Cedex 05, France
A cold gas reservoir to fuel M31 nuclear black hole and stellar cluster
With IRAM-30m/HERA, we have detected CO(2-1) gas complexes within 30 arcsec ( 100 pc) from the center of M 31 amounting to a minimum total mass of M⊙ (one third of the positions are detected). Averaging the whole HERA field, we have shown that there is no additional undetected diffuse component. We show that the above gas detection is associated with gas lying on the far side as no extinction is observed in the optical, but some emission is present on infra-red Spitzer maps. The kinematics is complex. (1) The velocity pattern is mainly redshifted: the dynamical center of the gas differs from the black hole position and the maximum of optical emission, and only the red-shifted side is seen in our data. (2) Several velocity components are detected in some lines of sight.
Our interpretation is supported by the reanalysis of the effect of dust on a complete planetary nebula sample. Two dust components are detected with respective position angles of 37 deg and -66 deg. This is compatible with the superposition of the (PA=37 deg) disk dominated by the 10-kpc ring and the inner 0.7-kpc ring detected in infrared data, which position angle (-66 deg) can be measured for the first time. The large scale disk, which dominates the HI data, is very inclined (i=77 deg), warped and superposed on the line of sight on the less inclined inner ring. The detected CO emission might come from both components.
Key Words.:
Galaxies: individual,Galaxies: nuclei, Galaxies: kinematics and dynamics, Galaxies: bulges, Galaxies: ISM, ISM: planetary nebulae: general1 Introduction
M31 is usually described as a quiescent galaxy with little star formation, at a level of 0.4M⊙yr-1 (e.g. Barmby et al. 2006; Tabatabaei & Berkhuijsen 2010; Azimlu et al. 2011) and with ultra-weak nuclear activity (del Burgo et al. 2000). The presence of a very massive black hole (Dressler 1984) and the lack of gas within 300 pc (Nieten et al. 2006; Chemin et al. 2009; Braun et al. 2009) suggest that the main gas reservoir has been accreted and is exhausted, although some gas is detected within 1 kpc from the center (Melchior et al. 2000; Melchior & Combes 2011). From optical emission lines Jacoby et al. (1985) estimated an ionized gas mass on the order of 1500 M⊙, which can be accounted for by mass loss from evolving stars. Groves et al. (2012) rely on Herschel data to argue that the dust properties are well accounted for by the stellar heating. Small amounts of molecular gas have been detected in directions more than 300 pc from the center. These can be associated with dust features in this area (Melchior et al. 2000; Melchior & Combes 2011).
| Date | Tsys | tintegration | pixels (scans) |
|---|---|---|---|
| 8 Nov. 2011 | 320K | 276min | 36 (144) |
| 10 Nov. 2011 | 411K | 276min | 36 (72) |
| 27 Nov. 2011 | 274K | 276min | 18 (36) |
| 12 Feb. 2012 | 251K | 144min | 36 (144) |
| 24 Feb. 2012 | 318K | 300min | 36 (72) |
| 11 Mar. 2012 | 351K | 295min | 36 (72) |
While the center of M31 hosts a supermassive black hole with a mass of (Bacon et al. 2001; Bender et al. 2005), it is one of the most silent ones (Garcia et al. 2010), although beginning in 2008 it started to murmur (Li et al. 2011). Furthermore, it exhibits many coherent structures interpreted as tracers of its merging history: there is a lopsided nuclear disk (Lauer et al. 1993) with two stellar components, P1 and P2 separated by 0.45” in the center. From the kinematics, the black hole is located in between P1 and P2, but closer to P2. An A-star cluster (see also Kormendy & Bender 1999), detected in a third component (P3) of M 31’s double nucleus by Bender et al. (2005), can be associated with a recent star formation episode. This occurred 200 Myr ago, involved a total mass in the range 104 – 10, and corresponds to an accretion rate of 10-4 – 10 yr-1. Its presence so close to the black hole raises a number of issues: how young stars were formed deeply inside to the tidal field of a supermassive black hole and how such stars have formed while there is no cold gas detected in the surroundings (e.g. Lauer et al. 2012; Li et al. 2009)? In the Galaxy, SgrA∗ has experienced X-ray flares, attributed to the infall of gas, while a cloud of gas identified by Gillessen et al. (2012) is expected to fall onto the black hole in 2013. M31∗ is experiencing a similar murmur according to Li et al. (2011) suggesting some gas infall.
Beside the presence of a young star cluster, an ionized gas outflow is detected in X-rays along the minor axis of the galaxy by Bogdán & Gilfanov (2008), perpendicular to the main disc. The relative intensity of the outflow on both sides is compatible with the intensity of the observed B extinction: the NW side is more extinguished than the SE side. As discussed in Melchior & Combes (2011), the velocity field of the circumnuclear region (40”40” or 150 pc 150 pc) measured in optical ionized gas does not exhibit any clear rotation pattern: beside a spot at the systemic velocity in M31’s center, the whole area is blueshifted with respect to the systemic velocity. This coherent flow of ionized gas is decoupled from the stellar kinematics (Bender et al. 2005; del Burgo et al. 2000; Saglia et al. 2010), and could be connected to the recent star formation activity. Please note that we assume throughout the paper a distance to M31 of 780 kpc (Vilardell et al. 2006), i.e. 1 arcsec3.8 pc. Most up-to-date results, based on cepheids, quote 75227 kpc (Riess et al. 2012). However, for coherence with previous works we keep 780 kpc, which lies within uncertainties of these new results.
Some cold gas is expected to feed the black hole, even though in contrast with the Milky Way, a general lack of HI in the vicinity of M31’s nucleus has been noted for several decades (Emerson 1976; Bajaja & Shane 1982). In this paper, we present the first molecular detections within 30 arcsec from the center. In Section 2, we present the new observations performed at IRAM-30m near the center of M31. In Section 3.1, we analyze our molecular gas detections and compare them with other wavelengths. In Section 4, we discuss how the interpretation of these data..
2 Observations
| Offsets | R (”) | ICO (K km s-1) | V0 (km s-1) | (km s-1) | T (mK) | baseline rms (mK) | (cm-2) | (M⊙ pc-2) | Mbeam (M⊙) | |
|---|---|---|---|---|---|---|---|---|---|---|
| 5 | -33.0,-8.33 | 34.0 | 0.510.12 | -301.74.0 | 30.18.6 | 16.0 | 4.2 | 1.99 | ||
| 15 | -9.0,-32.3 | 33.5 | 0.600.08 | -248.31.7 | 24.43.9 | 23.0 | 3.2 | 2.35 | ||
| 17 | -9.0,-8.3 | 12.2 | 0.760.13 | -137.43.9 | 41.97.3 | 17.1 | 4.0 | 2.97 | ||
| 17 | -9.0,-8.3 | 12.2 | 0.260.08 | -32.73.9 | 13.329.1 | 18.4 | 4.0 | 1.02 | ||
| 18 | -9.0,-3.7 | 9.7 | 0.350.09 | -355.04.1 | 27.87.0 | 11.7 | 3.5 | 1.37 | ||
| 19 | -3.0,-56.3 | 56.4 | 0.130.05 | -341.44.0 | 13.13.9 | 9.2 | 3.8 | 0.51 | ||
| 19 | -3.0,-56.3 | 56.4 | 0.100.03 | -339.94.0 | 7.52.2 | 12.9 | 5.1 | 0.39 | ||
| 21 | 3.0,-32.3 | 32.4 | 0.500.13 | -224.06.9 | 48.111.1 | 9.8 | 3.9 | 1.96 | ||
| 22 | 3.0,-20.3 | 20.5 | 0.200.07 | -67.14.0 | 17.26.2 | 11.0 | 3.0 | 0.78 | ||
| 23 | 3.0,-8.3 | 8.8 | 0.340.09 | -390.44.0 | 29.58.1 | 10.9 | 3.2 | 1.33 | ||
| 24 | 3.0,3.7 | 4.8 | 0.330.09 | -256.65.0 | 28.68.6 | 11.0 | 3.1 | 1.29 | ||
| 26 | 15.0,-44.3 | 46.8 | 0.480.14 | -207.85.7 | 39.814.5 | 11.2 | 4.1 | 1.88 | ||
| 26 | 15.0,-44.3 | 46.8 | 0.450.16 | -121.17.7 | 47.021.9 | 9.1 | 4.1 | 1.76 | ||
| 28 | 15.0,-20.3 | 25.2 | 0.360.08 | -190.91.0 | 13.033.1 | 26.1 | 3.8 | 1.41 | ||
| 28 | 15.0,-20.3 | 25.2 | 0.220.05 | -189.71.9 | 14.13.1 | 14.4 | 5.6 | 0.86 | ||
| 35 | 27.0,-8.3 | 28.2 | 0.150.05 | -160.93.3 | 13.04.79 | 10.9 | 3.6 | 0.59 | ||
| 35 | 27.0,-8.3 | 28.2 | 0.0640.026 | -155.00.8 | 3.41.8 | 17.8 | 5.4 | 0.25 | ||
| 36 | 27.0,3.7 | 27.3 | 0.940.16 | -152.84.6 | 52.610.6 | 16.8 | 4.1 | 3.68 | ||
| 36 | 27.0,3.7 | 27.3 | 0.430.10 | -315.62.8 | 21.95.3 | 18.3 | 4.1 | 1.68 |
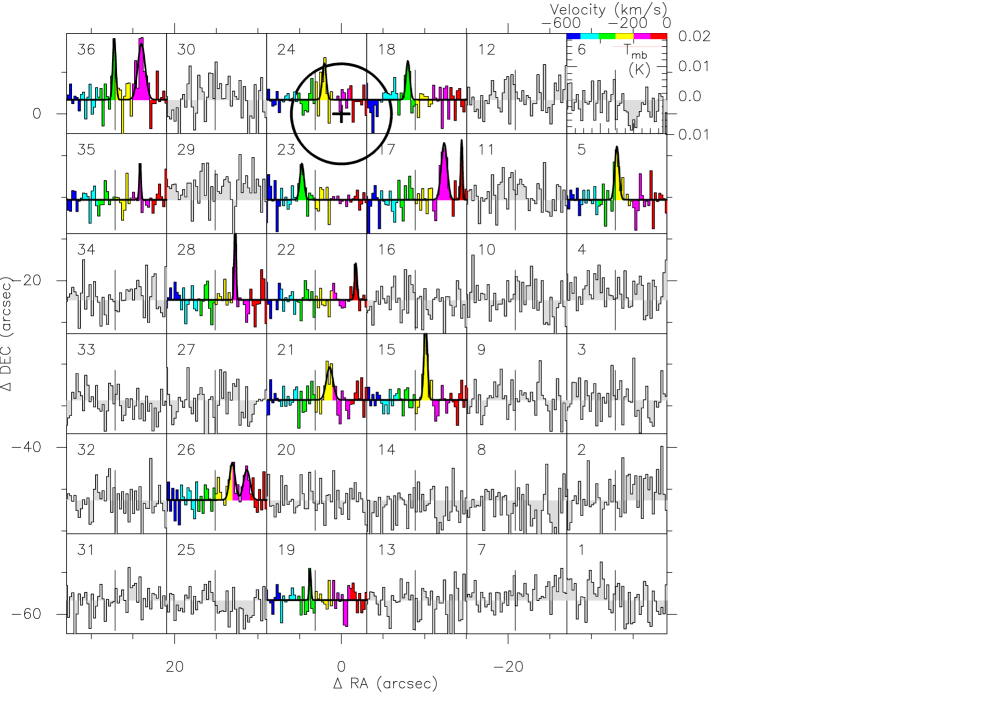
In the period between November 2011 - March 2012, we used the 1.3mm multibeam HEterodyne Receiver Array (HERA) at the IRAM-30m telescope (Schuster et al. 2004) to do a CO(2-1) survey of M31’s 0.7 kpc inner ring. One of the fields of this survey contained the center of M31. We refer to this field as M31-1a and show a 60”x60” map with 12” angular resolution in Figures 1 and 2. We thus performed a 60” by 60” map with 12” spatial resolution for the CO(2-1) line. Data were acquired in wobbler switching mode, using the Wideband Line Multiple Autocorrelator (WILMA) facility as backend. The wobbler throw (ranging between 60” to 210” in azimuth) has been adjusted every 30 min, to avoid extinction areas (and possible associated molecular gas emission). This procedure has been followed as best as possible given the constraints of the Pool observing periods allocated to this project. Some signal in the OFF has been detected in some scans, but as the OFF positions are changing with time, on average it disappears in the reduction process. Some signal can be underestimated but this should be included in the global 20 calibration uncertainties. A total of 540 raw spectra were recorded in 21.5 h of telescope time with a spectral resolution of 2.6 km s-1. Table 1 displays the epoch of observations, for each day the average system temperature, the total integration time accounting for two independent polarization measurements and the number of pixels and scans performed. We provide main-beam temperatures throughout this paper with beam and forward efficiencies: Beff=63 and Feff=94.
Each spectrum was first visually inspected to remove those affected by very unstable baselines. They are then processed in order to iteratively correct for the instrumental response: (1) a linear baseline is subtracted for each scan, (2) the scans are averaged for each position and smoothed. (3) For the spectra where there is a clear detection, a higher order polynomial is subtracted in order to optimize the baseline subtraction. The typical rms in each final pixel was at 1 mK in 13 km s-1channels. 13 of the 36 positions exhibit a detection above 3 (as displayed in Figure 1).
Upper limit on the continuum. We have estimated the value of the continuum at 1 mm in the field M31-1a. 4 of the spectra have a mean value outside the range -0.1,0.1 mK and have been removed. The remaining spectra are averaged and smoothed over the whole bandwidth (936 Mhz). We find a continuum level of mK. We thus derive a 3 upper limit of 0.13 mK on the continuum emission, corresponding to S mJy.
3 Analysis
3.1 Molecular data
Table 2 summarizes the characteristics of the CO(2-1) lines detected in this field. A Gaussian function is fitted to each line to determine its area ICO, central velocity , width and peak temperature Tpeak. The baseline rms is provided for each line. We assume a standard Galactic XNI2.3cm-2(K km s-1)-1 following Strong et al. (1988). However, note that different values have been adopted in the literature. Leroy et al. (2011), relying on Nieten et al. (2006) CO data with a strong signal (1K km s-1), estimate a lower value cm for the inner part of M31.
Relying on the CO(2-1)/CO(1-0) line ratios measured by Melchior & Combes (2011) in this area, we assume a line ratio of 1 and thus adopt the previous XCO ratio for the CO(2-1) line. We then convert the N column density to an H2 mass surface density and derive a molecular mass Mbeam assuming the gas fills the main-beam. Lastly, when all the positions are averaged a noise level of 0.8 mK is achieved, but no signal appears. This stacking demonstrates that there is no extended emission larger than 2.4 mK.
One third of the observed positions exhibit a CO(2-1) detection, as displayed in Figure 1. Beside the spectra 18 and 23 (and the second component of spectra 36), all the detected lines are redshifted with respect to the systemic velocity.
3.2 Dust extinction and dust emission
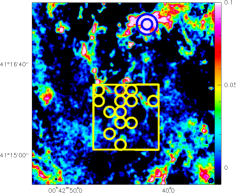
In this area devoid of large amounts of gas (e.g. Loinard et al. 1996), we have shown in Melchior & Combes (2011) that in the North-Western part of the bulge of M31, CO is detected where extinction is observed, while it is not detected in areas where no extinction is measured. This supports the dust-gas correlation observed in the Milky Way (Bohlin et al. 1978) and other galaxies (e.g. Foyle et al. 2012). Smith et al. (2012) is also claiming that the gas in M 31 is well traced by dust at a constant metallicity. The optical and near-infrared data displayed in Figure 2 provide complementary information to our CO detection. The left panel displays the observed extinction as computed in Melchior et al. (2000). The bulge light is mostly dominant within kpc ( arcsec) from the center (Courteau et al. 2011), where is the projected distance to the center on the sky plane. We model its photometry with elliptical annuli using the standard surface photometry algorithm developed for IRAF (Jedrzejewski 1987). This model is intended to reproduce the light profile along the bulge of M31 without extinction. The median intensity over the elliptical annulus sectors is used, in order to avoid areas suffering extinction. Large scale extinction following the elliptical profile could affect this model but it is obviously weak. The observed extinction is defined as , where is the observed brightness and the modeled brightness. This provides a lower bound of the true internal extinction, with the following assumptions: (1) the gas lies in front of the bulge and (2) there is only one clump of gas per line of sight. It thus eliminates automatically large scale homogeneous extinction like the one due to the Milky Way. On the one hand, as the resolution of the optical data is close to arcsec corresponding to 3.8 pc at the distance of M31 (the optical resolution is a factor of 10 better than the one achieved with CO observations), the second assumption is reasonable for most lines of sight given the small masses detected. According to the mass-size relation for molecular clouds first observed by Solomon et al. (1987), we expect that the more massive molecular clouds detected here have a size smaller than 3 pc (e.g. Lombardi et al. 2010). On the other hand, it is most probable that all the gas does not lie in front of the bulge in the Southern part. The observed extinction corresponds to , where is the fraction of light in front of the dust and the real optical depth at a given wavelength. In principle, if several clumps were present along the line of sight, we could decompose the extinction into several components. In practice, more observational constraints would be necessary to perform such a detailed analysis. It is important to note that the majority of the dust and associated gas is not diluted in the whole bulge and not spread all along the line of sight. It is expected to be relaxed and to lie in a disk-like structure (or ring).
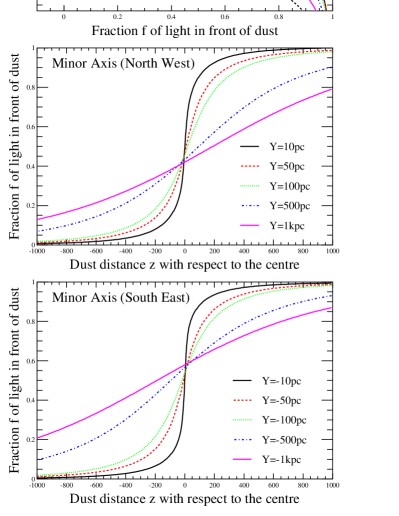
The top panel of Figure 3 displays how the observed extinction relates to the fraction of light in front of the dust for different values of real internal extinction. For extinction values above 5, it is very difficult to disentangle the real value of the extinction from optical observations. For a given value of observed extinction, it is, however, possible to put some constraint on the positions of dust clumps. Relying on the modeling of Tempel et al. (2011), we estimate how the fraction of light in front of the dust relates to the position of the dust clump along the line of sight. The bottom panels of Figure 3 display this relation for different lines of sight along the minor axis (projected on the sky plane). If the line of sight crosses the center (where there is a cusp due to the stellar cluster), the fraction is varying strongly as most of the light comes from an area smaller than 1 arcsec ( pc). For lines of sight varying from 10 pc to 1 kpc, the slope of is decreasing. There are two main effects to be stressed. (1) The observed extinction is very sensitive to the location of the dust clump along the line of sight. In the central region, dust just behind the mid-plane could easily escape optical detection, as the fraction of light in front of the clump can be very important. (2) This effect is further strengthened by the asymmetry due to the inclination: the far side will have a larger fraction of light than the near side.
The real extinction is difficult to measure from optical data, but the observed extinction provides some constraints on the location of the dust along the line of sight as displayed in Figure 2. For instance, if , the real extinction is larger than 0.25 and the fraction of light in front of the dust between 0.2 and 0.85. Then as a function of the chosen line of sight, it is possible to constrain the position of the dust clump. For a position at 100 pc (resp. 10 pc) from the center, the dust clump is expected to lie within 400 pc (resp. 150 pc) from the plane perpendicular to the line of sight passing through the center. Note that these observations have a resolution of 12 arcsec ( 45 pc), so the gas present very close (in projected distance) to the black hole could lie anywhere between 0 and 150 pc on the far side.
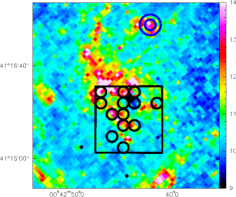
The right panel of Figure 2 displays the dust emission at m. It is not affected by extinction, but depends on dust grains and their heating. The Southern part exhibits a dust-emission intensity much stronger than the observed extinction, suggesting that the dust clumps lie on the far side.
3.3 Characteristics of the dust components
Following the previous discussion on the expected near/far asymmetry expected due to the inclination of M31, one can note that Ciardullo et al. (1989) first detected an asymmetry between the near and far sides among the bulge’s planetary nebulae distribution. A similar geometrical effect is also expected in the distribution of microlensing events in M31’s bulge (e.g Kerins et al. 2001, 2006). An asymmetry between the near side and the far side, due to extinction in the main plane, is observed in the distribution of planetary nebulae in the 10 kpc ring (Merrett et al. 2006).
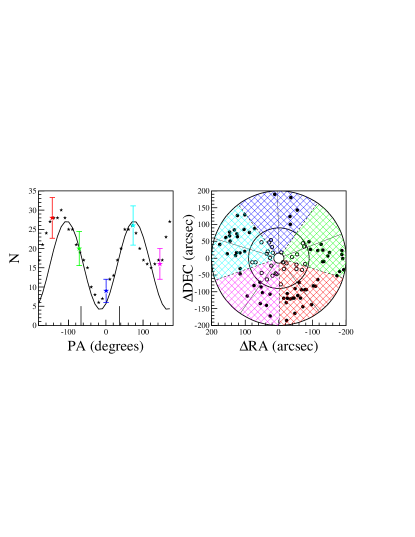
We have reinvestigated the catalog of planetary nebulae of Ciardullo et al. (1989), which samples quite well the bulge area. There is a complete sample of 99 planetary nebulae: it is spatially complete and Ciardullo et al. (1989) computed the detection efficiencies with respect to the surface magnitude. As displayed in the right panel of Figure 4, 29 are present in a 15-90 arcsec annulus within a m5007 magnitude smaller than 22.1, and 70 in a 90-200 arcsec annulus with a m5007 magnitude smaller than 22.7. This region within 200 arcsec from the center is dominated by the bulge, and the planetary nebulae follow the light distribution. In the left panel of Figure 4, we have counted the number of planetary nebulae in five parts of the 15-200 arcsec annulus and displayed them as a function of the position angle. The five points follow a sinusoid. The star points (not independent) have been obtained similarly with a running sum for intermediate position angles.
According to the near/far side asymmetry, one would expect a sinusoidal variation of the number of planetary nebulae with a 2 period with respect to the position angle of the main disk 37 deg. Surprisingly, the observed period is . The overplotted sinusoid is varying as , which is compatible with the superposition of two dust components whose main axis have respective position angles of 37 degrees and -66 degrees. This is a new confirmation of the presence of two gas/dust components in this region: the main disc (and mainly the 10 kpc ring) seen in projection with a PA of 37 degree, and the inner ring seen in the infra-red (e.g. with Spitzer data) with a position angle of -66 degree. The amplitude of the effect is similar for both components. There is probably an additional perturbation (at the limit of detection) close to PA=-180/180 deg, which might correspond to a non-circular structure. More statistics are required to be more conclusive.
Those two dust components expected to be associated with CO detections have an orientation compatible with our previous discussion: the clumps detected in CO are most probably on the far-side. In addition, one could argue that the few points detected close to the systemic velocity (and blue shifted) could be associated to the main disc (possibly at large scale)..
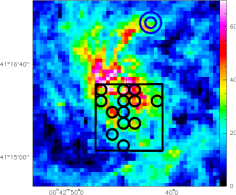
3.4 Ionized gas
The middle panel of Figure 2 shows the H and [NII] emission map (Ciardullo et al. 1988). As discussed by Rubin & Ford (1971), it is dominated by [NII] excited by shocks. The overall pattern corresponds to the 8 m map, but there is not an exact correspondence. (1) These wavelengths are affected by extinction. For instance, the position observed in CO by Melchior et al. (2000) (double circle in Figure 2) seems affected by extinction. (2) The kinematics of the [NII] line measured by Boulesteix et al. (1987) (see also Melchior & Combes 2011) exhibit a disc in rotation and the (40”40”) circumnuclear region is blueshifted with respect to the systemic velocity. In parallel, the velocity field measured in CO is redshifted. It is thus probable that both components are decoupled.
This can be related to the compilation of all gas velocities in the inner 10 arcmin of M31 by Stark & Binney (1994). The isovelocity curves are very irregular and chaotic, even involving much larger scales than here.
3.5 Bulge light emission

The bulge model computed on photometric images as described in Section 3.2 provides the ellipse geometry parameters (see e.g. Kent 1989). We performed this modeling on 2MASS J data111Note that the J image has been chosen as it offers a better signal-to-noise ratio than the K image. (Skrutskie et al. 2006) and Figure 5 displays the position of the centers of each annulus computed. In contrast with B and H/[NII] data, we do not expect any bias due to dust obscuration. Interestingly, the center of the annuli is systematically shifting towards the South by about 7 pc within 0.78 kpc. It is tempting to compare this off-centering of the bulge with the off-centering ( pc) of the inner dust ring detected by Block et al. (2006). Under the hypothesis of a coupled motion between the inner bulge and the disk, and given the Tamm et al. (2012) estimation the mass of M31’s bulge of the order of , we can expect a mass of gas in the inner ring of , if the maximum of light corresponds to the barycenter.
4 Interpretation
As displayed in Figure 2, some detections (7/13) correlate well with the Spitzer dust emission and several positions222The Spitzer map seems to exhibit a defect close to the center at the position of spectrum 17. (5, 17, 18, 19, 23 and 26) do not. None of the positions detected in CO correspond to any observed A extinction. According to the available kinematics, it is most probable that the ionized component is decoupled from the molecular gas. The observed extinction is smaller than 0.025 in B (see left panel of Figure 2). Relying on Figure 3, we can derive that the typical fraction of light in front of the average clump is larger than 90. Following the modeling of Tempel et al. (2011), the average clump lies at a depth between 20 and 200 pc from the center on the far side, depending on its projected distance. It could be further if the real extinction is significantly larger than 0.25. Accordingly, the positions with no Spitzer infrared emission could be much further where the radiation field is too weak to heat the dust, except within 4 pc of the black hole, where the light of the nuclear star cluster prevents the detection of any extinction.
The kinematics is complex and do not exhibit a clear pattern. Most of the lines are redshifted with respect to the systemic velocity while 4 are blueshifted. This is surprising as the opposite trend was observed in this field by Melchior & Combes (2011) with the optical ionized gas. The gas detected in the North-East side (Melchior et al. 2000) was also redshifted, so it is not simply a counter-rotation. In addition, the velocity range is spread between -33 and -390 km s-1.
These results are compatible with the 0.7 kpc inner ring scenario discussed in Melchior & Combes (2011) and initially proposed by Block et al. (2006): the ring is tilted, which could explain why the gas is here on the far side and the velocities redshifted. It lies off-center, which could explain why we do not see a regular rotation pattern, since we are far from the kinematical center. As supported by the dust components detected with the planetary nebulae in Sect. 3.3, the 0.7-kpc inner ring is most probably superimposed on the 10-kpc ring in the main disc: this could account for the multiple velocity components together with the clumpiness.
In summary, we have shown the presence of molecular gas close to the black hole. There is no extended diffuse molecular emission but we have detected small dense clumps located on the far side of the bulge. The detected clumps are located between 20 pc and 215 pc in projected distance from the center (and observed with a resolution of 45 pc). Assuming a single dust/gas clump per line of sight and some modeling assumptions, we show that clumps corresponding to these lines of sight lie on the far side, at least at 150 pc in depth from the center and most probably closer than 600 pc. If some gas is present next to the center, it is also most probably on the far side but could be very close to the black hole. The kinematics exhibit an unexpected trend: most of the lines are redshifted with respect to the systemic velocity, which could be due to the off- centering. Along several lines of sight, there are multiple CO components. Our reanalysis of the Ciardullo et al. (1989) catalog of planetary nebulae reveals the presence of two components of position angles 37 deg and -66 deg. In the light of our molecular detections discussed here, we claim that dust and gas from the outer 10-kpc ring superimpose on the inner 0.7-kpc ring in this very central region. The inclination of both components is such that the gas and dust in the Southern area lie mainly on the far side.
Acknowledgements.
This article is based on observations (067-11, 221-11) performed in the IRAM-30m Pool session at Pico Veleta (Spain). We are most grateful to Manuel Gonzalez who monitored this program through the IRAM-30m Pool observing sessions. We also thank the IRAM staff at Pico Veleta for excellent support at the telescope. IRAM is supported by INSU/CNRS (France), MPG (Germany) and IGN (Spain). We thank the anonymous referee for his constructive comments. David Valls-Gabaud is warmly acknowledged for his helpful comments. This publication makes use of data products from the Two Micron All Sky Survey, which is a joint project of the University of Massachusetts and the Infrared Processing and Analysis Center/California Institute of Technology, funded by the National Aeronautics and Space Administration and the National Science Foundation.References
- Azimlu et al. (2011) Azimlu, M., Marciniak, R., & Barmby, P. 2011, AJ, 142, 139
- Bacon et al. (2001) Bacon, R., Emsellem, E., Combes, F., et al. 2001, A&A, 371, 409
- Bajaja & Shane (1982) Bajaja, E., & Shane, W. W. 1982, A&AS, 49, 745
- Barmby et al. (2006) Barmby, P., Ashby, M. L. N., Bianchi, L., et al. 2006, ApJ, 650, L45
- Beaton et al. (2007) Beaton, R., Majewski, S., Patterson, R., et al. 2007, Bulletin of the American Astronomical Society, 39, #104.17
- Bender et al. (2005) Bender, R., Kormendy, J., Bower, G., et al. 2005, ApJ, 631, 280
- Block et al. (2006) Block, D. L., Bournaud, F., Combes, F., et al. 2006, Nature, 443, 832
- Bogdán & Gilfanov (2008) Bogdán, Á., & Gilfanov, M. 2008, MNRAS, 388, 56
- Bohlin et al. (1978) Bohlin, R. C., Savage, B. D., & Drake, J. F. 1978, ApJ, 224, 132
- Boulesteix et al. (1987) Boulesteix, J., Georgelin, Y. P., Lecoarer, E., Marcelin, M., & Monnet, G. 1987, A&A, 178, 91
- Braun et al. (2009) Braun, R., Thilker, D. A., Walterbos, R. A. M., & Corbelli, E. 2009, ApJ, 695, 937
- Chemin et al. (2009) Chemin, L., Carignan, C., & Foster, T. 2009, ApJ, 705, 1395
- Ciardullo et al. (1988) Ciardullo, R., Rubin, V. C., Ford, W. K., Jr., Jacoby, G. H., & Ford, H. C. 1988, AJ, 95, 438
- Ciardullo et al. (1989) Ciardullo, R., Jacoby, G. H., Ford, H. C., & Neill, J. D. 1989, ApJ, 339, 53
- Courteau et al. (2011) Courteau, S., Widrow, L. M., McDonald, M., et al. 2011, ApJ, 739, 20
- del Burgo et al. (2000) del Burgo, C., Mediavilla, E., & Arribas, S. 2000, ApJ, 540, 741
- Dressler (1984) Dressler, A. 1984, ApJ, 286, 97
- Emerson (1976) Emerson, D. T. 1976, MNRAS, 176, 321
- Foyle et al. (2012) Foyle, K., Wilson, C. D., Mentuch, E., et al. 2012, MNRAS, 421, 2917
- Garcia et al. (2010) Garcia, M. R., Hextall, R., Baganoff, F. K., et al. 2010, ApJ, 710, 755
- Gillessen et al. (2012) Gillessen, S., Genzel, R., Fritz, T. K., et al. 2012, Nature, 481, 51
- Groves et al. (2012) Groves, B., Krause, O., Sandstrom, K., et al. 2012, MNRAS, 426, 892
- Jacoby et al. (1985) Jacoby, G. H., Ford, H., & Ciardullo, R. 1985, ApJ, 290, 136
- Jedrzejewski (1987) Jedrzejewski, R. I. 1987, MNRAS, 226, 747
- Kent (1989) Kent, S. M. 1989, AJ, 97, 1614
- Kerins et al. (2001) Kerins, E., Carr, B. J., Evans, N. W., et al. 2001, MNRAS, 323, 13
- Kerins et al. (2006) Kerins, E., Darnley, M. J., Duke, J. P., et al. 2006, MNRAS, 365, 1099
- Kormendy (1982) Kormendy, J. 1982, Saas-Fee Advanced Course 12: Morphology and Dynamics of Galaxies, 113
- Kormendy & Bender (1999) Kormendy, J., & Bender, R. 1999, ApJ, 522, 772
- Lauer et al. (1993) Lauer, T. R., Faber, S. M., Groth, E. J., et al. 1993, AJ, 106, 1436
- Lauer et al. (2012) Lauer, T. R., Bender, R., Kormendy, J., Rosenfield, P., & Green, R. F. 2012, ApJ, 745, 121
- Leroy et al. (2011) Leroy, A. K., Bolatto, A., Gordon, K., et al. 2011, ApJ, 737, 12
- Li et al. (2009) Li, Z., Wang, Q. D., & Wakker, B. P. 2009, MNRAS, 397, 148
- Li et al. (2011) Li, Z., Garcia, M. R., Forman, W. R., et al. 2011, ApJ, 728, L10
- Loinard et al. (1996) Loinard, L., Allen, R. J., & Lequeux, J. 1996, A&A, 310, 93
- Lombardi et al. (2010) Lombardi, M., Alves, J., & Lada, C. J. 2010, A&A, 519, L7
- Melchior et al. (2000) Melchior, A.-L., Viallefond, F., Guélin, M., & Neininger, N. 2000, MNRAS, 312, L29
- Melchior & Combes (2011) Melchior, A.-L., & Combes, F. 2011, A&A, 536, A52
- Merrett et al. (2006) Merrett, H. R., Merrifield, M. R., Douglas, N. G., et al. 2006, MNRAS, 369, 120
- Nieten et al. (2006) Nieten, C., Neininger, N., Guélin, M., et al. 2006, A&A, 453, 459
- Riess et al. (2012) Riess, A. G., Fliri, J., & Valls-Gabaud, D. 2012, ApJ, 745, 156
- Rubin & Ford (1971) Rubin, V. C., & Ford, W. K., Jr. 1971, ApJ, 170, 25
- Saglia et al. (2010) Saglia, R. P., Fabricius, M., Bender, R., et al. 2010, A&A, 509, A61
- Schuster et al. (2004) Schuster, K.-F., Boucher, C., Brunswig, W., et al. 2004, A&A, 423, 1171
- Skrutskie et al. (2006) Skrutskie, M. F., Cutri, R. M., Stiening, R., et al. 2006, AJ, 131, 1163
- Smith et al. (2012) Smith, M. W. L., Eales, S. A., Gomez, H. L., et al. 2012, ApJ, 756, 40
- Stark & Binney (1994) Stark, A. A., & Binney, J. 1994, ApJ, 426, L31
- Solomon et al. (1987) Solomon, P. M., Rivolo, A. R., Barrett, J., & Yahil, A. 1987, ApJ, 319, 730
- Strong et al. (1988) Strong, A. W., Bloemen, J. B. G. M., Dame, T. M., et al. 1988, A&A, 207, 1
- Tabatabaei & Berkhuijsen (2010) Tabatabaei, F. S., & Berkhuijsen, E. M. 2010, A&A, 517, A77
- Tamm et al. (2012) Tamm, A., Tempel, E., Tenjes, P., Tihhonova, O., & Tuvikene, T. 2012, A&A, 546, A4
- Tempel et al. (2011) Tempel, E., Tuvikene, T., Tamm, A., & Tenjes, P. 2011, A&A, 526, A155
- Vilardell et al. (2006) Vilardell, F., Ribas, I., & Jordi, C. 2006, A&A, 459, 321
Appendix A Triaxality of the bulge

Figure 6 displays the variation of the position angles and ellipticities computed in the modeling described in Sect. 3.2. There is a clear isophot twist which is not due to extinction. The most plausible explanation is the triaxiality of the bulge as discussed by Kormendy (e.g. 1982). Our values are similar to those presented by Beaton et al. (2007), but they are presented here in linear scale in accordance with Figure 5.
The isophot twist is significant but its amplitude does not exceed 10 deg and should not affect significantly our results. (1) The bins used to compute the position angle of the dust component from the planetary nebulae distribution are 72 deg. (2) This triaxiality could affect the near/far side effect, but it should be a second order effect.