e-mail s.l.drechsler@ifw-dresden.de, Phone: +49-351-4659-384, Fax: +49-351-4659-380
2 Technische Universität Dresden, Institut für Festkörperphysik, Germany
XXXX
Disordered magnetism in superconducting KFe2As2 single crystals
Abstract
\abstcolHigh-quality KFe2As2 (K122) single crystals synthesized by different techniques have been studied by magnetization and specific heat (SH) measurements. The adopted phenomenological analysis of the normal state properties shows that there are two types of samples both affected by disordered magnetic phases: (i) cluster-glass (CG) like or (ii) Griffiths phase (G) like. For (i) at low applied magnetic fields the -dependence of the zero field cooled (ZFC) linear susceptibility () exhibits an anomaly with an irreversible behavior in ZFC and field cooled (FC) data. This anomaly is related to the freezing temperature of a CG. For the investigated samples the extrapolated to varies between 50 K and 90 K. Below we observed a magnetic hysteresis in the field dependence of the isothermal magnetization (). The frequency shift of the freezing temperature has an intermediate value, which provides evidence for the formation of a CG-like state in the K122 samples of type (i). The frequency dependence of their follows a conventional power-law divergence of critical slowing down with the critical exponent =10(2) and a relatively long characteristic time constant =6.9s also supporting a CG behavior. The large value of the Sommerfeld coefficient obtained from SH measurements of these samples was related to magnetic contribution from a CG. Samples from (ii) did not show a hysteresis behavior for and . Below some crossover temperature 40K a power-law dependence in the , with a non-universal was observed, suggesting a quantum G-like behavior. In this case and can be scaled using the scaling function with the scaling moment 3.5. The same non-universal exponent was found also in SH measurements, where the magnetic contribution .
keywords:
superconductivity, pnictides, spin-glass, Griffiths phase1 Introduction
The interplay between superconductivity (SC) and magnetism, and the role of correlation effects in Fe-pnictides are under debate [1, 2, 3]. It is commonly assumed that in most of the so-called stoichiometric parent compounds nesting between electron (el) and hole (h) Fermi surfaces is responsible for the presence of long-range spin density waves (SDW). To get SC, the SDW should be suppressed by chemical doping or external pressure [1, 2]. Therefore, it is believed that SC is driven at least partially by AFM spin fluctuations (sf). In contrast, in some other of Fe-pnictides such as LiFeAs (111) or KFe2As2 (K122) there is no nesting. Therefore, the role of magnetism in the SC pairing of these compounds is less obvious but it is still believed that remaining sf as in Ba122 [4] or a new type [5] sf can be responsible for SC.
In this paper we demonstrate that the physical properties of clean K122 single crystals are strongly affected by an unexpected glassy like magnetic behavior such as spin-glass (SG) and Griffiths (G) type. It is known that a SG phase gives a nearly linear magnetic contribution to the SH below the freezing temperature [6, 7]. In some cases the SG contribution can be hardly distinguished from the usual electronic (Sommerfeld) contribution to the SH, since it has the same linear -dependence and only a weak maximum slightly above . Therefore, the Sommerfeld coefficient and the deduced strength of correlation effects can be signifiantly overestimated, if one considers only SH data ignoring thereby the glassy phases. Moreover, the interplay of superconductivity (SC) and unknown magnetic phases can lead to confusing conclusions concerning SC gaps [8]. A clear understanding of various coexisting or competing forms of magnetism should be addressed first.
2 Experimental results and discussion
2.1 Samples
K122 single crystals have been grown using a self-flux method (FeAs-flux (S1) and KAs-flux (S2)). The high quality of the grown single crystals was assessed by complementary techniques. Several samples were examined with a Scanning Electron Microscope (SEM Philips XL 30) equipped with an electron microprobe analyzer for a semi-quantitative elemental analysis using the energy dispersive x-ray (EDX) mode (for details see [9, 10]). Resistivity of all measured samples showing a metallic behavior at all with a RRR400-500, where and is resistivity at and 5 K, respectively, comparable with the best values reported in the literature. The resistivity data will be published elsewhere. Low- SH and ac susceptibility were determined using a PPMS (Quantum Design). The dc magnetic susceptibility has been measured in a SQUID (Quantum Design) magnetometer. In this paper the data for two representative single crystals are shown.
2.1.1 Magnetization measurements
Samples with cluster glass behavior
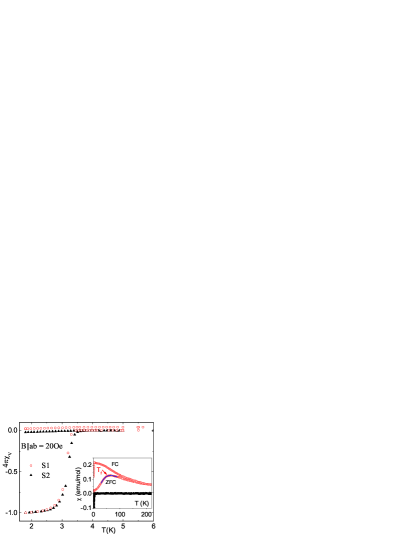
Fig. 1 depicts the -dependence of the volume susceptibility () determined from dc magnetization of our samples measured under both zero-field-cooled (ZFC) and field-cooled (FC) conditions with the field Oe. Bulk SC of our samples is confirmed by ’full’ diamagnetic signals of the ZFC data at low . For sample S1, a clear splitting between ZFC and FC normal state linear susceptibility curves is observed below 100 K (see the inset of Fig. 1), where is a magnetization in the field . The maximum in the ZFC is attributed to the freezing temperature of a spin glass (SG) type phase at K and Oe [11].
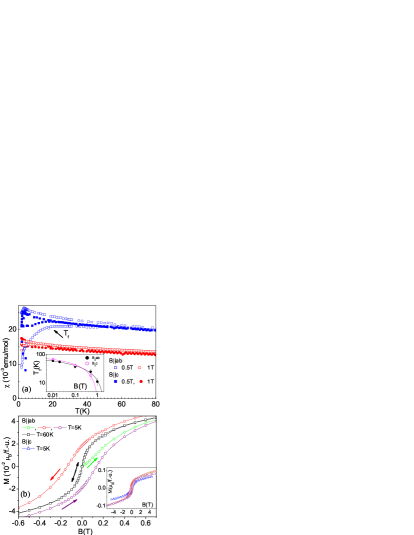
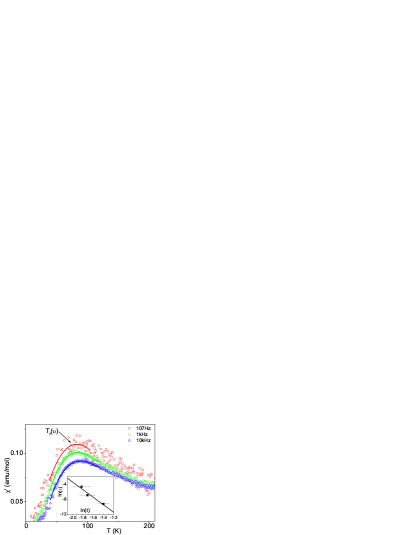
decreases with increasing field and at 5 T no splitting was observed down to 2 K (see Fig. 2a). The field dependence of is shown in the inset of Fig. 2a. The extrapolated value of K is a relatively high value. This might point to a large concentration of the involved magnetic moments (MM) 10% in sample S1 [7]. Such a high value of MM is expected from entropy estimations, too (see section 2.2). On the other hand, structural investigations did not reveal any impurity phase (see section 2.3). Therefore, we speculate that the high value of might be caused by a low-lying excited incommensurate spin density wave state [12]. For a more detailed consideration of this scenario see Ref. 13. In addition, an upshift of the maximum and its lowering with increasing frequency of the ac susceptibility, generic for a SG ordering [6, 7] (Fig. 3), was observed for crystal S1. The value of the frequency shift of [11]:
| (1) |
is above the range 0.001-0.02 expected for canonical SG but well below 0.3 observed in the case of superparamagnets [7]. Such an intermediate value of the frequency shift is usually related to a the so-called cluster glass (CG) behavior [14, 15]. The frequency dependence of the shown in inset Fig. 3 follows a conventional power-law divergence of critical slowing down [7, 15]:
| (2) |
where is the relaxation time corresponding to the measured frequency , is the characteristic relaxation time of single spin flip, 71 K is the spin-glass temperature as the frequency tends to zero adopted from dc susceptibility measurements (inset Fig. 2a), and is the dynamic critical exponent. It is convenient to rewrite Eq. 2 in the form:
| (3) |
where . The fit of the experimental data by a power-law divergence Eq. 3 is shown in the inset Fig. 3. The best fit was obtained with =10(2) and s. The value of is in the range of 4 to 12 observed for typical SG [15]. On the other hand the value of is large as compared to s observed for structureless SG systems, which is of the order of the spin-flip time of atomic magnetic moments (s) [16]. This suggests a slow spin dynamics in our crystal S1, likely due to the presence of interacting clusters rather than individual spins.
Another signature of a SG-like behavior for crystal S1 is a hysteresis in the magnetization data below with a reduced ZFC susceptibility at low fields (Fig. 2b). This behavior is expected in the case of SG or CG systems [7, 14, 17] below and also excludes superparamagnetic behavior in our samples where no hysteresis was observed [18]. On the other hand, in the case of canted antiferromagnetic (AF) or ferromagnetic (FM) impurity phases hysteresis is expected but with a higher susceptibility at low fields because the clusters are at first saturated along their local easy axis, and only after that various clusters become fully aligned along the applied field [16]. Therefore, our data exclude (large) clusters of impurity phases such as FeAs, Fe2As or other iron compounds. The same conclusion can be drawn from our SH measurements (see below). We also observed the displacement of the ZFC magnetization compared to magnetization after complete hysteresis loop at magnetic field applied parallel to plane (inset Fig. 2b). For the field along the -axis no displacement was observed. This indicates that the glassy behavior is dominated by a magnetic interaction between moments lying in the -plane.
Samples with Griffiths-phase behavior
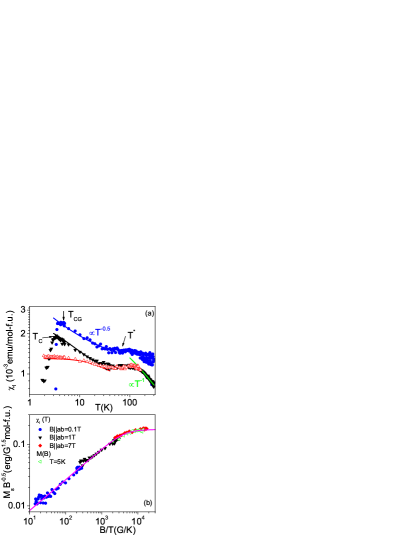
In contrast, the -dependence of the linear susceptibility of some crystals S2 does not show a difference between ZFC and FC curves above . The data of one of the S2 crystals is shown in Fig. 4a. At high 200 K, follows a Curie-Weiss behavior with an AFM =-117 K [19]. At 120 K shows a plateau-like feature with a field independent susceptibility above T. In a view of the observed CG in sample S1, we relate this flattening to a tendency to form magnetic clusters in the crystals S2, too. However, with lowering after a weak reduction of instead to form a CG phase in crystal S2, below an exponential increase of the susceptibility is observed:
| (4) |
where is a -independent susceptibility, and is a back ground constant. A power-law with the exponent was found up to the highest measured field 7 T (see Fig. 4a). This exponential behavior is quite similar to the reported one for the weak itinerant ferromagnetic alloy Ni1-xVx [20], where the formation of a Griffiths (G) phase with a non-universal exponent was observed near a FM quantum critical point. Following the analysis proposed there, the field and -dependence of the magnetization can be scaled on a single curve Fig. 4b:
| (5) |
where is the scaling moment and a scaling function with as a constant. To scale the data using Eq. 5 we have subtracted the -independent susceptibility from and from , correspondingly. For sample S2 (Fig. 4) a scaling was observed for 0.5(1) with a scaling moment 3.5. According to Ref. 20 the obtained moment can be related to a typical cluster size in crystal S2. The SH data are also in agreement with the G-like scenario (see below). Therefore, we ascribe the anomalous power-law of at low K to the formation of a quantum G-phase.
2.2 Specific heat measurements
Specific heat in the normal state
We have found that the glassy magnetic subsystems (observed in the magnetization measurements) do also contribute to the SH shown in Fig. 5a. In case of SG or CG phases the magnetic contribution to the SH varies almost linearly at like the usual electronic contribution in case of a FL [7, 6, 21, 22]. Empirically, this behavior can be approximated by
| (6) |
or
| (7) |
where , and are CG constants. The contribution can be interpreted as originating from short-range 3D ferromagnetic (FM) spin waves which can exist in a FM clusters [23], also a linear contribution to SH can be expected for 2D FM spin waves. Then, the normal state SH of sample S1 reads
| (8) |
where is given by Eq. 6 and Eq. 7, is an intrinsic electronic contribution and , are a lattice contribution. In case of a G-phase (sample S2), is expected [24, 25]. Hence, for the SH we have:
| (9) |
where according to our magnetization data.
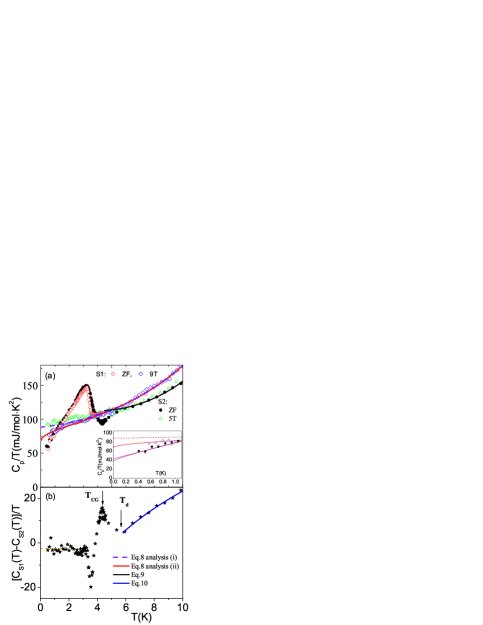
To reduce the number of fitting parameters in Eqs. 8 and 9, we analyzed the difference:
| (10) |
This allow us to exclude the lattice contributions , , as well as the linear electronic term which are all supposed to be nearly the same for both crystals, respectively. The fit of the experimental data by Eq. 10 is shown in Fig. 5b. i) In the case of Eq. 6 it gives: mJ/molK2, mJ/molK3 and mJ/molK1.5, respectively. Then, using in Eq. 9 obtained magnetic contribution we have estimated the intrinsic mJ/molK2 for sample S2 with the lattice terms mJ/molK4 and mJ/molK6, respectively. The obtained corresponds to a Debye temperature K. ii) In the case of validity of Eq. 7 it gives: mJ/molK3 and mJ/molK1.5, respectively. Then the intrinsic mJ/molK2 is the same for S1 and S2 crystals with slightly different lattice terms as compared to those obtained in the analysis (ii): mJ/molK4 and mJ/molK6, respectively. This value of corresponds to a Debye temperature 276K. Both analysis give reasonable values of the lattice contribution (for example, in the case of Ba0.68K0.32Fe2As2 a Debye temperature of 277K was estimated [26]) and essentially reduced mJ/molK2 as compared to nominal values mJ/molK2 [27, 8] obtained with out accounting for magnetic contributions. The SH data at T shown in Fig. 5a can be considered as a support of analysis (ii), since this analysis provides essentially a better agreement between the experimental data and the fitting curves at low-. However, we cannot exclude that large field enhances FM order in S1 crystals and actually change the entropy of SG at low temperatures.
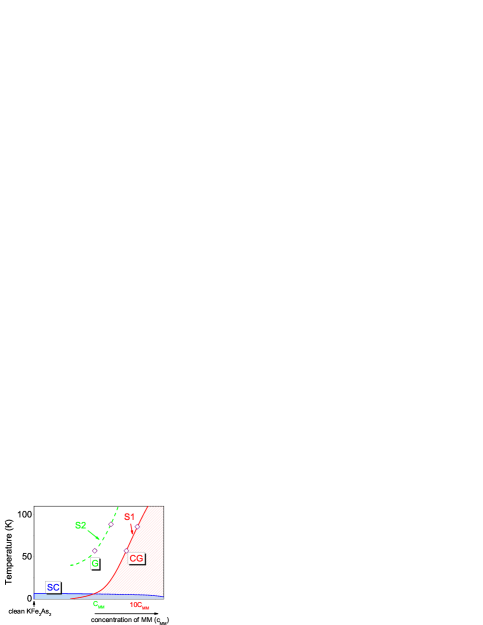
Below 6 K the data for S2 deviate from the fit-curve (Fig. 5). At 4 K, slightly above , (see Fig. 5a) another magnetic anomaly is well visible in the SH data. Additionally, slightly above we observed a plateau-like feature in at relatively low fields (see Fig. 4a). We ascribe to the freezing of large cluster dynamics in accord with the behavior expected for a quantum G-phase (see Ref. [28]) followed by the final formation of a CG phase due to the RKKY interaction between the clusters at in crystal S2, too (for an illustration see also Fig. 6).
Specific heat in the superconducting state
Measurements in SC state have shown that there is a large residual Sommerfeld coefficient observed for all investigated samples (see inset Fig. 5a). The fit below 1K gives a residual contribution for crystal S1 43 mJ/molK2 and about 46 mJ/molK2 for S2 [29]. The is close to mJ/molK2 estimated for the normal state using analysis (i). The closeness of these values would indicate that is weakly effected by the SC transition and also excludes essentially a non-superconducting volume fraction for our the samples. The latter is also supported by the large absolute value of the SH jump at compared to the reported in the literature values [8, 27]. In the case of [8] it was observed that of the investigated crystals tends to zero at after AFM type magnetic transition at 0.7K. This demonstrates that almost all itinerant quasi-particals are gapped at . Therefore, we conclude that the large residual in the SC state of our samples is mainly due to the magnetic contribution from a CG. On the other hand, using mJ/molK3 from analysis (ii), we get 36 mJ/molK2. This value is nearly a half of mJ/molK2. In contrast to the conclusion obtained from analysis (i), it would mean that the CG phase in SC state is different from the CG in the normal state, since we exclude a large non-SC part of our samples. This can be possible, since itinerant electrons responsible for the RKKY interaction are affected by the SC transition. Thus, on this stage we cannot decide which analysis (i) or (ii) is more sophisticated. Therefore, we estimate the intrinsic mJ/molK2. A more detailed report of the superconducting properties including microscopic considerations will be given elsewhere.
2.3 Possible disorder induced quantum phase transitions
Up to now the structural investigation of the cleaved surface of the samples such as EDX, XRD and SEM did not reveal any secondary phases [9, 10]. Therefore, we enforced to adopt a ’point’-defect model such as vacancies or interstitials of Fe atoms. To compare the amount of magnetic clusters contributing to a glassy phases of our samples, we calculated the magnetic entropy using the obtained above magnetic contributions. for crystal S2 related to CG and G phases between 0 and K (where the quantum Griffiths behavior appears in the magnetization data Fig. 4a) is 0.074RJ/mol-FeK2. The estimate for crystal S2 related to the CG phases below K gives an essentially higher value than . In the case of validity of analysis (i) 0.64RJ/mol-FeK2 and for the case of analysis (ii) 0.48RJ/mol-FeK2 for the magnetic contribution have been obtained, respectively. Hence, we conclude that in the normal state crystal S1, it can contain up to 10 times more magnetic clusters than S2 does. Summarizing our experimental observations of disordered magnetic phases in K122, we can propose a quantum phase transition of spin glass type with strong quantum G-phase effects (see Fig. 6) driven by some tuning parameter which is responsible for the formation of magnetic moments (MM) in K122. The physical nature of should be unraveled in future investigations such as spin and nuclear magnetic resonance and/or Mössbauer spectroscopy. These techniques can be helpful to estimate the amount and the distribution of MM in K122 single crystals.
3 Conclusions
To summarize, analyzing magnetization and specific heat data, we found out that even in high-quality KFe2As2 single crystals glassy magnetic behavior like in spin- , cluster-glasses and Griffiths phases may occur near superconductivity and coexist with it. The magnetic contribution is responsible for a large value of the nominal Sommerfeld coefficient 100 mJ/molK2 of this compound. The analysis of the SH data has shown that magnetic contribution amounts up to 50 of . In this way, the intrinsic value of the Sommerfeld coefficient mJ/molK2 was estimated. We observed that various samples exhibit different disordered magnetic contributions depending on the amount and distribution of magnetic moments (MM). This suggests an extrinsic origin of MM which can be caused by point defects such as vacancies or Fe interstitials. Therefore, we proposed a scenario of disorder induced spin glass type quantum phase transitions accomplished by strong quantum Griffiths effects. Further investigations are required to elucidate the physical origin and the distribution of such MM.
We thank J.A. Mydosh, U. Rößler, and D. Evtushinsky for discussions. Our work was supported by the DFG (SPP 1458 and the Grants No. GR3330/2, WU 595/3-1 (S.W.)) as well as the IFW-Pakt für Forschung.
References
- [1] D. C. Johnston Advances in Physics 59, 803 (2010).
- [2] G. R. Stewart, Rev. Mod. Phys. 83, 1589 (2011).
- [3] Y. Bang Supercond. Sci. Technol. 25, 084002 (2012).
- [4] M. Hirano, Y. Yamada, T. Saito et al. J. Phys. Soc. Jpn. 81, 054704 (2012).
- [5] S. W. Zhang, L. Ma, Y. D. Hou et al. Phys. Rev. B 81, 012503 (2010).
- [6] K. Binder and A. P. Young, Rev. Mod. Phys. 58, 801 (1986).
- [7] J.A. Mydosh, Spin glasses: an experimental introduction (Taylor and Francis, London - Washington, DC, 1993).
- [8] J. S. Kim, E. G. Kim, G. R. Stewart, X. H. Chen, and X. F. Wang, Phys. Rev. B 83, 172502 (2011).
- [9] M. Abdel-Hafiez , S. Aswartham, S. Wurmehl, V. Grinenko, S.-L. Drechsler, A.U.B. Wolter, and B. Büchner Phys. Rev. B 85, 134533 (2012).
- [10] S. Aswartham, S. Wurmehl, and B. Büchner unpublished.
- [11] To define the by the same criteria, the -dependence of the dc and the ac susceptibilities were fitted by a cubic polynom as shown in Figs. 1-3. Next was attributed to the maximum calculated from that cubic polynom.
- [12] A.W. Overhauser, J. Phys. Chem. Solids 13 71 (1960).
- [13] V. Grinenko et al., e-print arXiv:1203.1585.
- [14] N. Marcano, J. C. Gomez Sal, J. I. Espeso, L. Fernandez Barquin, and C. Paulsen, Phys. Rev. B 76, 224419 (2007).
- [15] V. K. Anand, D. T. Adroja, and A. D. Hillier, Phys. Rev. B 85, 014418 (2012).
- [16] A. Malinowski, V.L. Bezusyy, R. Minikayev, P. Dziawa, Y. Syryanyy, and M. Sawicki, Phys. Rev. B 84, 024409 (2011).
- [17] B. R. Coles, B. V. Sarkissian and R. H. Taylor Phil. Mag. B 37, 489 (1978).
- [18] C. P. Bean and J. D. Livingston , J. Appl. Phys. 30, S120 (1959).
- [19] We also observed a Curie-Wiess behavior at high- for samples with a CG-phase having lower values of than shown in Fig. 1 and Fig. 2.
- [20] S. Ubaid-Kassis, T. Vojta, and A. Schroeder, Phys. Rev. Lett. 104, 066402 (2010).
- [21] D. G. Dawes and B.R. Coles, J. Phys. F: Metal Phys. 9, L215 (1979).
- [22] D. L. Martin, Phys. Rev. B 21, 1906 (1980).
- [23] J. O. Thomson and J. R Thompson J. Phys. F: Metal Phys. 11, 247 (1981).
- [24] A. H. Castro Neto, G. Castilla and B. A. Jones Phys. Rev. Lett. 81, 3531 (1998).
- [25] G. R. Stewart, Rev. Mod. Phys. 73, 797 (2001).
- [26] P. Popovich, A. V. Boris, O. V. Dolgov et al. Phys. Rev. Lett. 105, 027003 (2010).
- [27] H. Fukazawa, T. Saito, Y. Yamada et al. J. Phys. Soc. Jpn. 80, SA118 (2011).
- [28] T. Vojta, J. Low Temp. Phys., 161, 299 (2010).
- [29] Note that a large value of is expected in case of SG or CG [7, 21]. In contrast, the magnetic impurity phases (large clusters) would give only a small contribution at low T. For example, Fe2As has =21.8 mJ/molK2 [30] and FeAs has mJ/molK2 [31], only. Therefore, even a very high contamination by these impurities would provide only several mJ at low T.
- [30] D.A. Zocco, D.Y. Tütün, J.J. Hamlin et al. Supercond. Sci. Technol. 25, 084018 (2012).
- [31] D. Gonzalez-Alvarez, F. Gronvold, B. Falk, E.F. Westrum, R. Blachnik, and G. Kudermann, J. Chem. Thermodynamics 21, 363 (1989).