Emerging dimmings of active regions observed by SDO
Abstract
With the observations from the Atmospheric Imaging Assembly and the Helioseismic and Magnetic Imager aboard the Solar Dynamics Observatory, we statistically investigate the emerging dimmings (EDs) of 24 isolated active regions (IARs) from June 2010 to May 2011. All the IARs present EDs in lower temperature lines (e.g., 171 Å) at their early emerging stages, meanwhile in higher temperature lines (e.g., 211 Å), the ED regions brighten continuously. There are two type of EDs: fan-shaped and halo-shaped. There are 19 fan-shaped EDs and 5 halo-shaped ones. The EDs appear several to more than ten hours delay to the first emergence of the IARs. The shortest delay is 3.6 hr and the longest 19.0 hr. The EDs last from 3.3 hr to 14.2 hr, with a mean duration of 8.3 hr. Before the appearance of the EDs, the emergence rate of the magnetic flux of the IARs is from 1.2 1019 Mx hr-1 to 1.4 1020 Mx hr-1. The larger the emergence rate is, the shorter the delay time is. While the dimmings appear, the magnetic flux of the IARs ranges from 8.8 1019 Mx to 1.3 1021 Mx. These observations imply that the reconfiguration of the coronal magnetic fields due to reconnection between the newly-emerging flux and the surrounding existing fields results in a new thermal distribution which leads to a dimming for the cooler channel (171 Å) and brightnening in the warmer channels.
1 Introduction
Coronal dimmings have been observed in white light, extreme-ultraviolet (EUV) lines, and soft X-rays (Hansen et al. 1974; Rust & Hildner 1976; Sterling & Hudson 1997; Gopalswamy & Hanaoka 1998; Harrison & Lyons 2000). Filament eruptions and other ejections of mass from the Sun are often associated with dimmings in the low corona at many wavelengths (Zarro et al. 1999; Harrison et al. 2003; Attrill et al. 2006; Reinard & Biesecker 2009; Dai et al. 2010).
Some dimming regions are co-spatial with sheared magnetic structures of pre-flare active regions (ARs) and are speculated to be the remnant signatures of the eruption of large-scale magnetic flux ropes during coronal mass ejections (CMEs) (Hudson et al. 1998; Canfield et al. 1999). The evolution timescale of coronal dimmings is shorter than typical radiative cooling timescale in the corona, which implies the coronal dimmings are formed due to density depletion via expansion or ejection rather than temperature decrease (Hudson et al. 1996). CMEs cause an opening of magnetic field lines and plasma outflows and subsequent emission decrease. Thus mass loss is responsible for the dimming process. Harra & Sterling (2001) investigated Doppler observations within two coronal dimmings and found that the dimmings are associated with outflowing material. Recent results from Jin et al. (2009) also show that, during the CME eruption, strong outflows are visible in dimming regions at different heights.
In this Letter, we report the discovery of emerging dimmings (EDs) of isolated ARs (IARs), with the observations from the Atmospheric Imaging Assembly (AIA; Lemen et al. 2012) and the Helioseismic and Magnetic Imager (HMI; Scherrer et al. 2012; Schou et al. 2012) aboard the Solar Dynamics Observatory (SDO; Pesnell et al. 2012). The paper is organized as follows. In Section 2 we describe the observational data we use. The observations are presented in Section 3. In Section 4, we conclude this study and discuss the results.
2 Observations
SDO/AIA uninterruptedly observes the Sun’s full disk at 10 wavelengths with a cadence of 12 s and a pixel size of 0.6. The measurements reflect various temperatures of the solar atmosphere (from 5000 K to 2.5 MK) from the photosphere to the corona. SDO/HMI measures Doppler-velocity, line-of-sight (LOS) and vector magnetic fields. The data cover the full disk of the Sun with a spatial sampling of 0.5 pixel-1. The full disk LOS magnetograms are taken with a cadence of 45 s.
The data adopted here were obtained from June 2010 to May 2011. This period belongs to the rising phase of the 24th solar cycle, quite a few of ARs emerged from the solar photosphere. On the other hand, there were not too many ARs on the solar atmosphere, so we can track some ARs which emerged isolatedly, termed “IARs”, i.e., no other pre-existing ARs within 300 away from the emerging ARs. We track the emergence of ARs and identify 59 ARs which emerged on the solar disk during this period. Among them, 24 IARs were detected.
3 Results
All the 24 IARs are accompanied by EDs. The parameters about the 24 IARs and the EDs are shown in Table 1. We find that these EDs can be classified into two types according to their performance during evolution: fan-shaped EDs (FEDs) and halo-shaped EDs (HEDs). Most EDs are type one, FEDs. There are 19 FEDs among the 24 EDs, and only 5 EDs are HEDs. For each type, we provide two movies as an example.
3.1 Type I: FEDs
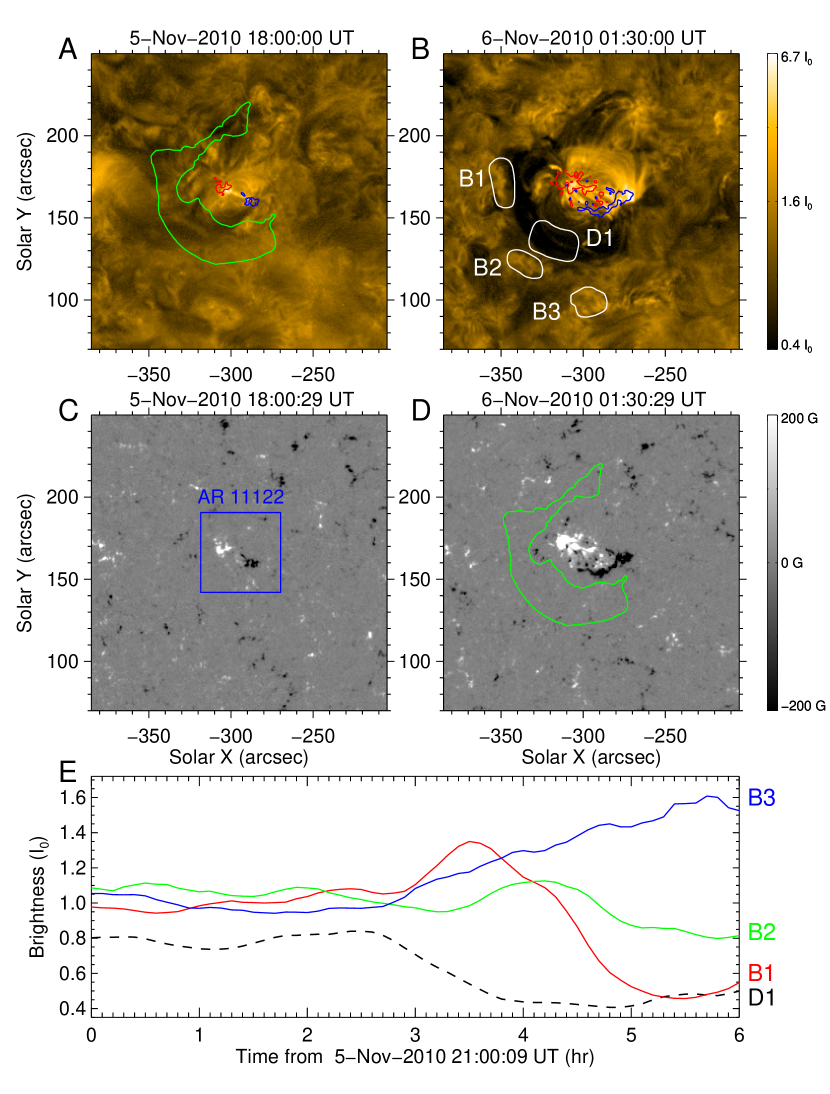
One example of FEDs is shown in Figure 1 (see also movies 1 and 3, available in the online edition). Two AIA 171 images (Figures 1A and 1B) show the coronal response to the emerging AR 11122. This AR first emerged near N15E16, at 12:00 UT, Nov. 5, 2010. At 18:00 UT, the AR exhibited as a significant dipolar configuration (Figure 1C). There were some coronal loops connecting the opposite polarities and there was no dimming at the emergence region (Figure 1A). After the emergence progress for 6 hours, an ED appeared. The ED grew and expanded mainly toward the southeast direction. So it is named FED due to its fan-shaped structure. The FED was well developed at 01:30 UT, Nov. 6, 2010 (Figure 1B). The HMI LOS magnetograms show that both the positive and negative magnetic fields are compact, and they separate alone opposite directions (Figure 1D). The inner boundary of the FED envelops the emerging AR. The FED lasted 11.3 hr.
When the FED expanded, there were some brightenings (e.g., regions B1, B2, and B3 outlined in Figure 1B) at the FED front. Figure 1E shows the light curves of one dimming region (D1) and three brightening regions (B1, B2 and B3). Beginning at 23:42 UT, the brightness of D1 decreased from about 0.8 I0 to 0.45 I0, where I0 represents the average intensity of the quiet Sun. On the contrary, the brightness of the brightening structures increased while the dimming appeared.
There was no dimming during the AR emergence in 304 Å, 193 Å and 211 Å lines that represent the transition region and corona. Indeed, the average brightness of 304 Å and 193 Å in the 171Å FED region, denoted by the green curve, increases 40% and 15%, respectively. The brightness increment in 211 Å images is more significant, as much as 75%.
3.2 Type II: HEDs
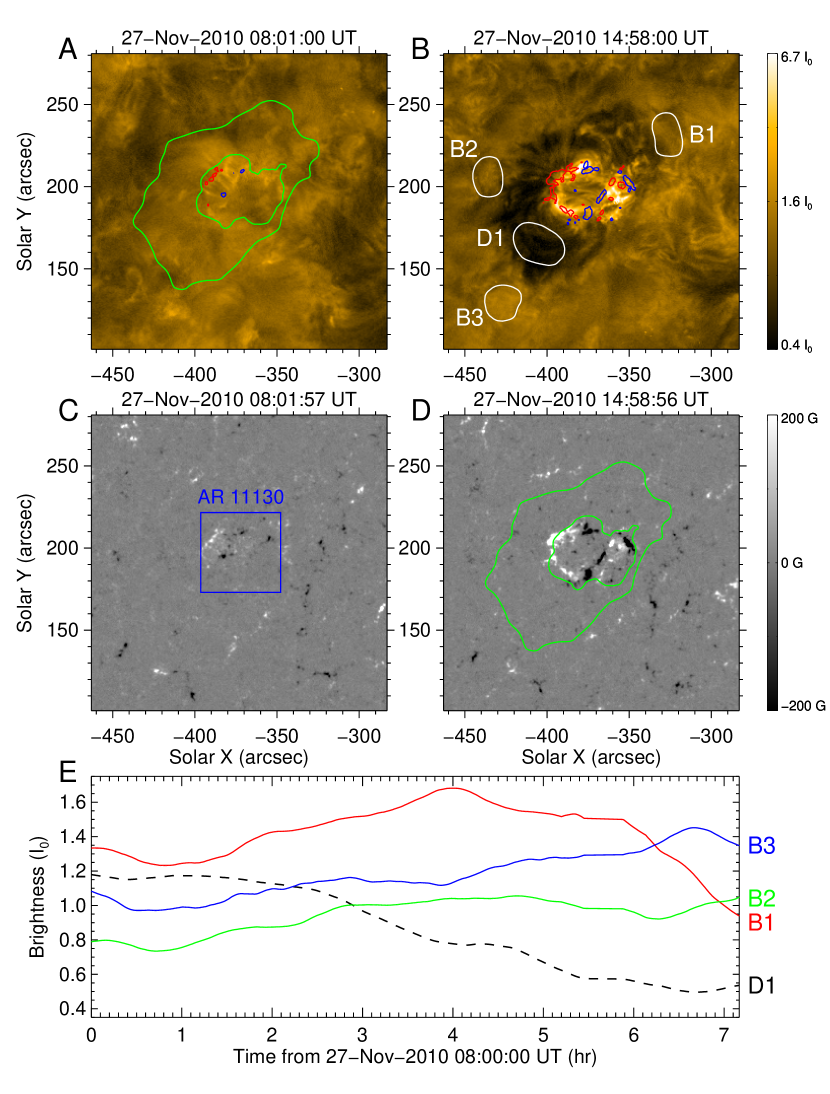
An example of HEDs is displayed in Figure 2 (see movies 2 and 4, available in the online edition). The HED is associated with AR 11130 which emerged at 04:46 UT, Nov. 27, 2010. At beginning, there were only several tiny loops at the AR site in the quiet Sun background (see Figure 2A). About 5 hours later, an ED appeared at the AR location, and then expanded outward from the AR center. At 14:58 UT, the ED was well developed and appeared as a halo-shaped structure, the HED surrounding the AR (Figure 2B). The evolution of underlying magnetic fields are displayed in Figures 2C and 2D. The magnetograms obtained by the HMI show that both the negative and positive fields are dispersed, and form a circle shape, different from AR 11122 shown in Figure 1. There are also some brightening structures (B1, B2, and B3 in Figure 2B) at the HED front. The light curves of three brightening regions (B1, B2 and B3) and a dimming region (D1 outlined in Figure 2B) are displayed in Figure 2E. From 09:00 UT to 12:00 UT, Nov. 27, 2010, the brightness of the D1 region decreased 35%, while the bright structures, B1, B2 and B3 exhibited an increase of brightness about 20%.
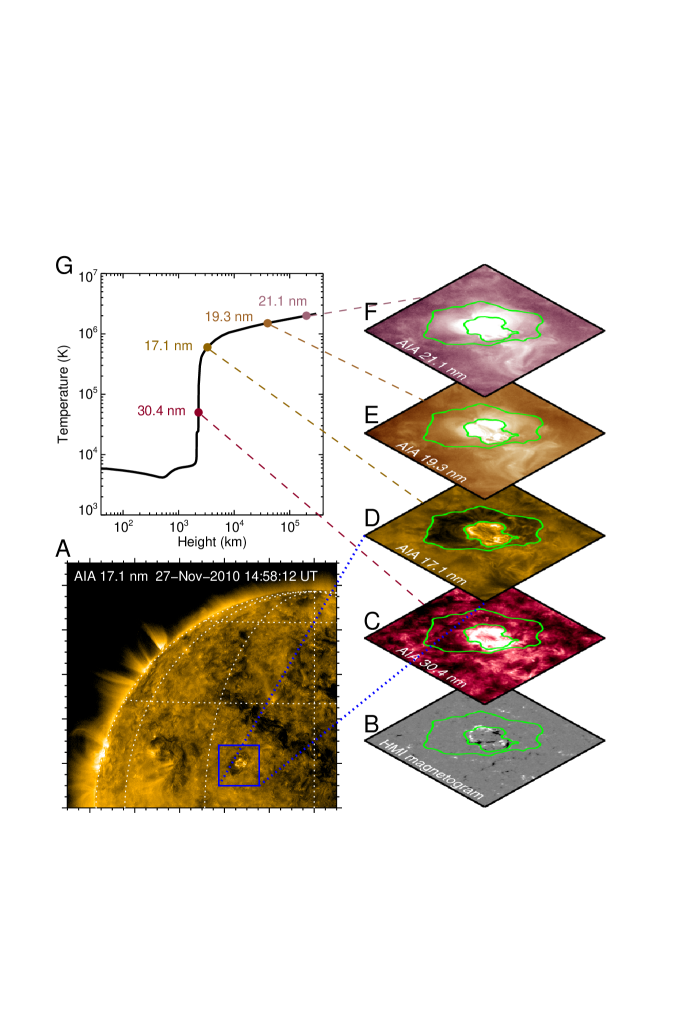
The HED, a dimming area in 171 Å images, appeared as brightening region in the lines formed in transition region and high corona, as displayed in Figures 3C, 3E, and 3F. The brightness in 304 Å at the HED location increased 1.2 times, in 193 Å 1.7 times while that in 211 Å 3.2 times.
3.3 Statistical Results of the ERs
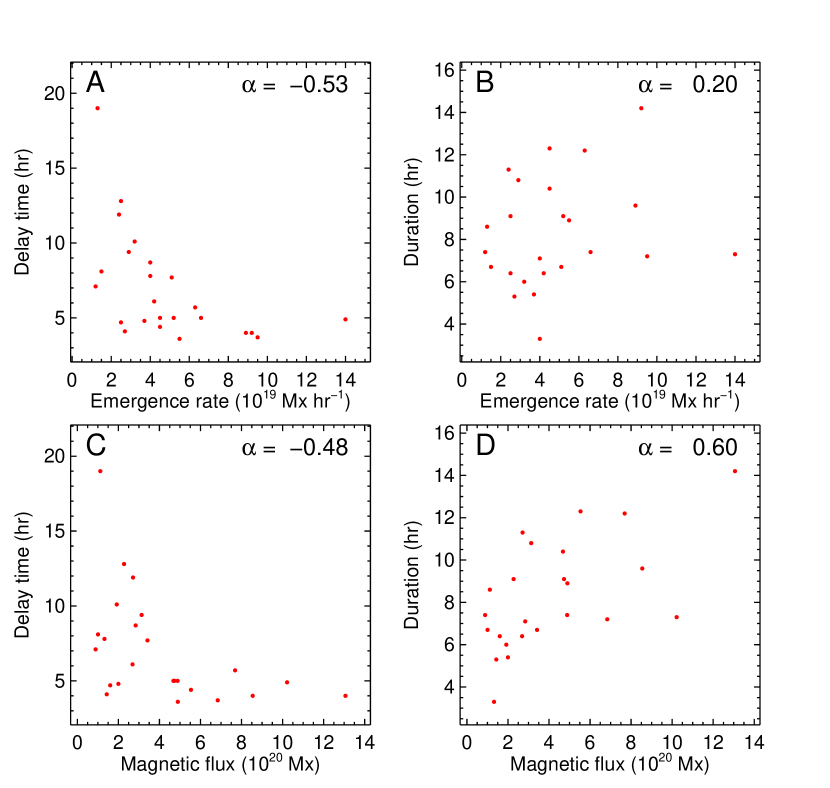
Relationships among the delay time, duration of EDs, the emergence rate, and magnetic flux are investigated using the sample of those 24 IARs (Figure 4). The delay time is defined to be the time between the emergence of AR and appearrance of ED. The delay time ranges from several hours to more than ten hours with the shortest delay time of 3.6 hr and the longest of 19.0 hr. The EDs last from 3.3 hr to 14.2 hr, with a mean duration of 8.3 hr. The emergence rate of the magnetic flux before the appearance of the EDs ranges from 1.2 1019 Mx hr-1 to 1.4 1020 Mx hr-1. When the dimmings appear, the magnetic flux of the IARs reaches about 8.8 1019 Mx to 1.3 1021 Mx.
There is a negative relationship with a correlation coefficient of between the delay time and the emergence rate of the IARs (Figure 4A). In other words, the larger the emergence rate is, the shorter the delay time is. Figure 4C shows a similar relationship between delay time and magnetic flux, and the correlation coefficient is . On the contrary, there exists a positive relationship between the duration of the EDs and the magnetic flux of the IARs (Figure 4D), and the correlation coefficient is . It means that an ED lasts a longer time, if the magnetic flux at the ED appearance is larger. As shown in Figure 4B, the relationship between the duration of the EDs and the emergence rate is very weak.
4 Conclusions and Discussion
We statistically investigate the EDs associated with IARs from June 2010 to May 2011, and 24 IARs have been identified during the one-year period. All the IARs present the EDs at their early emerging stages. There are two type of EDs: fan-shaped and halo-shaped. Usually the EDs appear several to more than ten hours delay to the first emergence of the IARs. The EDs last from 3.3 hr to 14.2 hr, with a mean duration of 8.3 hr. The HMI observations show that, the larger the emergence rate is, the shorter the delay time is. While the dimmings appear, the magnetic flux of the IARs ranges from 8.8 1019 Mx to 1.3 1021 Mx.
There are several differences between EDs and “classical dimmings”. First, EDs are only relevant to the emergence of ARs, and no filament eruptions, no flares and no CMEs are accompanying. The “classical dimmings” usually accompany with eruptive events, such as filament eruptions, flares, and CMEs (Jiang et al. 2007; Attrill et al. 2007). In this work, EDs appear with the emergence of AR. Second, EDs are much more pronounced in 171 Å than in the higher-temperature lines, 193 Å and 211 Å (see Figure 3). More precisely, at the ED regions, the high temperature line observations show that a heating process happens at high coronal level, as the brightness increases when the EDs appear. This suggests that, at the early stage of AR emergence, the density of lower temperature plasma decreases, leading to the appearance of EDs. On the other hand, the plasma temperature at high corona increases as revealed by the brightening in 193 Å and 211 Å images. However, according to previous studies, the “classical dimmings” are much more pronounced in 195 Å than in the lower-temperature line 171 Å (Robbrecht & Wang 2010). We conclude that most of the hot coronal plasma is not ejected.
Besides the differences, some similar behaviors between EDs and “classical dimmings” remain. First, the lifetime of both EDs and “classical dimmings” ranges from several hours to more than ten hours (Thompson et al. 2000; Reinard & Biesecker 2008). With a sample of 96 CME-associated EUV coronal dimmings between 1998 and 2000, Reinard & Biesecker (2008) reported the durations of the dimmings typically range from 3 to 12 hr, which is consistent with the range of 3.3 to 14.2 hours for EDs. Second, at the outermost edge of ED and the “classical dimming” regions, there are EUV brightenings (Attrill et al. 2007; Jiang et al. 2007; Cohen et al., 2009), which may be signatures of magnetic reconnection.
As shown in this study, the EDs can be classified into two types, i.e., FEDs and HEDs. This is probably due to the different configurations of their source regions. All the 19 IARs associated with FEDs emerged as dipolar regions with compact opposite polarities (e.g., AR 11122 in Figure 1). The 5 IARs associated with HEDs have a circle-like configuration (e.g., AR 11130 in Figure 2). When an AR emerges, the magnetic fields of emerging ARs reconnects with the surrounding existing fields. So a new thermal distribution is created, as suggested by Schrijver et al. (2010). The structures in hot and cool wavelength images represent plasma at different temperature. The magnetic reconnection between the emerging and background fields heats up the coronal plasma, so that the cool-wavelength 171 Å appears dimming (without enough cool plasma) while the hot-wavelengths brightens up (most plasma has been heated up). This process leads to a dimming for the cooler channel and brightnening in the warmer channels. In 171 Å wavelength, there are some structures in the dimming regions, i.e., in Figure 1B the main dimming region displays a loop-shape appearance. While in 193 and 211 Å wavelengths (see movie 3), there are many loop systems. By comparison, we can see that the 171 Å dimming structures are consistent with the 193 and 211 Å bright structures. Bright structures are usually considered as magnetic loop systems in the solar corona. So the dimming areas are occupied by magnetic loop systems.
In order to comprehensively understand this phenomenon, some spectral observations (such as Hinode/EIS) are required to diagnose the temperature, density, and flow velocity in the emerging dimmings. Moreover, studying the variation of the extrapolated coronal magnetic field configurations during the dimming process by using vector magnetic fields is also under consideration in future work.
References
- Attrill et al. (2006) Attrill, G., Nakwacki, M. S., Harra, L. K., et al. 2006, Sol. Phys., 238, 117
- Attrill et al. (2007) Attrill, G., Harra, L. K., van Driel-Gesztelyi, L., & Démoulin, P. 2007, ApJ, 656, L101
- Canfield et al. (1999) Canfield, R. C., Hudson, H. S., & McKenzie, D. E. 1999, Geophys. Res. Lett., 26, 627
- Cohen et al. (2009) Cohen, O., Attrill, G. D. R., Manchester, W. B., IV, & Wills-Davey, M. J. 2009, ApJ, 705, 587
- Dai et al. (2010) Dai, Y., Auchère, F., Vial, J.-C., Tang, Y. H., & Zong, W. G. 2010, ApJ, 708, 913
- Gopalswamy & Hanaoka (1998) Gopalswamy, N., & Hanaoka, Y. 1998, ApJ, 498, L179
- Hansen et al. (1974) Hansen, R. T., Garcia, C. J., Hansen, S. F., & Yasukawa, E. 1974, PASP, 86, 500
- Harra & Sterling (2001) Harra, L. K., & Sterling, A. C. 2001, ApJ, 561, L215
- Harrison & Lyons (2000) Harrison, R. A., & Lyons, M. 2000, A&A, 358, 1097
- Harrison et al. (2003) Harrison, R. A., Bryans, P., Simnett, G. M., & Lyons, M. 2003, A&A, 400, 1071
- Hudson et al. (1996) Hudson, H. S., Acton, L. W., & Freeland, S. L. 1996, ApJ, 470, 629
- Hudson et al. (1998) Hudson, H. S., Lemen, J. R., St. Cyr, O. C., Sterling, A. C., & Webb, D. F. 1998, Geophys. Res. Lett., 25, 2481
- Jiang et al. (2007) Jiang, Y., Yang, L., Li, K., & Ren, D. 2007, ApJ, 662, L131
- Jin et al. (2009) Jin, M., Ding, M. D., Chen, P. F., Fang, C., & Imada, S. 2009, ApJ, 702, 27
- Lemen et al. (2012) Lemen, J. R., Title, A. M., Akin, D. J., et al. 2012, Sol. Phys., 275, 17
- Pesnell et al. (2012) Pesnell, W. D., Thompson, B. J., & Chamberlin, P. C. 2012, Sol. Phys., 275, 3
- Reinard & Biesecker (2008) Reinard, A. A., & Biesecker, D. A. 2008, ApJ, 674, 576
- Reinard & Biesecker (2009) Reinard, A. A., & Biesecker, D. A. 2009, ApJ, 705, 914
- Robbrecht & Wang (2010) Robbrecht, E., & Wang, Y.-M. 2010, ApJ, 720, L88
- Rust & Hildner (1976) Rust, D. M., & Hildner, E. 1976, Sol. Phys., 48, 381
- Scherrer et al. (2012) Scherrer, P. H., Schou, J., Bush, R. I., et al. 2012, Sol. Phys., 275, 207
- Schou et al. (2012) Schou, J., Scherrer, P. H., Bush, R. I., et al. 2012, Sol. Phys., 275, 229
- Schrijver et al. (2010) Schrijver, C. J., DeRosa, M. L., & Title, A. M. 2010, ApJ, 719, 1083
- Sterling & Hudson (1997) Sterling, A. C., & Hudson, H. S. 1997, ApJ, 491, L55
- Thompson et al. (2000) Thompson, B. J., Cliver, E. W., Nitta, N., Delannée, C., & Delaboudinière, J.-P. 2000, Geophys. Res. Lett., 27, 1431
- Zarro et al. (1999) Zarro, D. M., Sterling, A. C., Thompson, B. J., Hudson, H. S., & Nitta, N. 1999, ApJ, 520, L139
| IARs | Position | FETaaFET Flux first Emerging Time. | EDTbbEDT Emerging Dimming first appearance Time. | EDDccEDD Emerging Dimming Duration. | FERddFER Flux Emerging Rate. | ED type |
|---|---|---|---|---|---|---|
| (at FET) | (UT) | (UT) | (hr) | (1019 Mx hr-1) | ||
| AR11079 | S26W06 | 2010-06-07 12:00 | 2010-06-07 19:48 | 3.3 | 4.0 | I |
| AR11081 | N25W38 | 2010-06-11 00:30 | 2010-06-11 05:24 | 7.3 | 14.0 | I |
| AR11086 | N18W30 | 2010-07-03 22:00 | 2010-07-04 06:42 | 7.1 | 4.0 | I |
| AR11088 | N18E46 | 2010-07-11 01:24 | 2010-07-11 07:06 | 12.2 | 6.3 | II |
| AR11105 | N18E02 | 2010-09-01 12:18 | 2010-09-02 01:06 | 9.1 | 2.5 | I |
| AR11114 | S22W25 | 2010-10-13 08:00 | 2010-10-14 03:00 | 8.6 | 1.3 | I |
| AR11116 | N22E05 | 2010-10-16 10:00 | 2010-10-16 16:06 | 6.4 | 4.2 | I |
| AR11122 | N15E16 | 2010-11-05 12:00 | 2010-11-05 23:42 | 11.3 | 2.4 | I |
| AR11130 | N13E20 | 2010-11-27 04:46 | 2010-11-27 09:43 | 10.4 | 4.5 | II |
| AR11132 | N11E15 | 2010-12-03 13:42 | 2010-12-03 18:06 | 12.3 | 4.5 | II |
| AR11142 | S14E60 | 2010-12-29 21:00 | 2010-12-30 02:00 | 7.4 | 6.6 | I |
| AR11143 | S22E50 | 2011-01-05 14:18 | 2011-01-05 18:18 | 9.6 | 8.9 | I |
| AR11144 | S16W05 | 2011-01-07 15:24 | 2011-01-07 19:06 | 7.2 | 9.5 | II |
| AR11148 | S28W12 | 2011-01-16 10:00 | 2011-01-16 19:24 | 10.8 | 2.9 | I |
| AR11153 | N15E12 | 2011-02-02 19:42 | 2011-02-03 00:42 | 9.1 | 5.2 | I |
| AR11179 | N09E30 | 2011-03-20 20:00 | 2011-03-21 07:48 | 5.4 | 3.7 | I |
| AR11194 | S32W10 | 2011-04-12 22:00 | 2011-04-13 02:06 | 5.3 | 2.7 | I |
| AR11198 | S26W30 | 2011-04-21 06:30 | 2011-04-21 10:06 | 8.9 | 5.5 | II |
| AR11202 | N15E12 | 2011-04-25 05:42 | 2011-04-25 12:48 | 7.4 | 1.2 | I |
| AR11211 | S12E05 | 2011-05-07 22:00 | 2011-05-08 02:42 | 6.4 | 2.5 | I |
| AR11214 | S20E20 | 2011-05-13 12:42 | 2011-05-13 16:42 | 14.2 | 9.2 | I |
| AR11215 | S23E07 | 2011-05-12 00:00 | 2011-05-12 08:06 | 6.7 | 1.5 | I |
| AR11220 | N14W45 | 2011-05-21 18:00 | 2011-05-22 01:42 | 6.7 | 5.1 | I |
| AR11221 | S18W36 | 2011-05-21 19:00 | 2011-05-22 05:06 | 6.0 | 3.2 | I |