119–126
Statistical characteristics of horizontal proper motions in the vicinity of pores
Abstract
Movement and coalescence of magnetic elements could explain the evolution and growth of pores. There have been numerous studies focusing on flow fields in and around individual pores. We have undertaken a systematic study of the statistical properties of such flows. Data of the Hinode Solar Optical Telescope offer an opportunity for this type of research, because of the uniform data quality and absence of seeing so that pores can directly be compared in different environments and at various stages of their evolution. We analyzed about 220 time-series of G-band images using local correlation tracking. The thus computed flow maps make up a database, which covers various scenes on the solar surface. We use an isolated pore to illustrate the statistical parameters collected for further statistical analyses, which include information about morphology, horizontal flows, evolutionary stage (young, mature, or decaying), complexity of the surrounding magnetic field, and proximity to sunspots or cluster of G-band bright points.
keywords:
Sun: magnetic fields, Sun: photosphere, Sun: sunspots, methods: data analysis1 Introduction
Photospheric flow fields play an important role in the formation, evolution, and decay of solar magnetic features. Our Local Correlation Tracking (LCT) algorithm (Verma & Denker, 2011) is based on ideas put forward by November & Simon (1988). The algorithm was adapted to subimages with sizes of 32 32 pixels (2560 km 2560 km), so that structures with dimensions smaller than a granule contribute to the correlation signal. Because cross-correlation techniques are sensitive to strong intensity gradients, a high-pass filter was applied to the entire image, suppressing gradients related to structures larger than granules. The high-pass filter is implemented as a Gaussian with a FWHM of 15 pixels (1200 km).
2 Statistical properties of photospheric flow fields around pores
Starting point for identifying pores is a time averaged (one-hour) G-band image, which has been corrected for limb darkening. Some additional smoothing and subsequent thresholding at 90% of the quiet-Sun intensity yields a binary mask marking all dark features in the image. The intensity threshold roughly corresponds to the transition from penumbra to umbra in a sunspot. Morphological closing smoothes boundaries and eliminates isolated dark pixels. Only features with a size between 1 Mm2 and 225 Mm2 are kept. These are conservative limits for magnetic knots and sunspots, respectively. The next criterion is that a pore must have a dark core, i.e., pixels with an intensity lower than 0.7 should cover at least 0.5 Mm2. Nevertheless, rudimentary or orphan penumbrae are sometimes erroneously classified as pores. However, in almost all cases, these features are larger than 20 Mm2, have an intensity contrast lower than 20%, and possess a high positive kurtosis. Thus, these feature can also be eliminated from the binary mask.
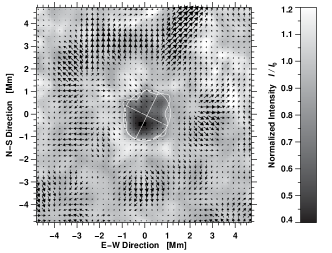
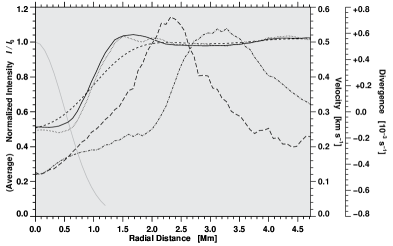
Statistical properties of pores and flows can now be computed for each contiguous region in the binary mask. Deriving average values for the flows is very easy because the time-averaged G-band image exactly matches the LCT flow maps. Standard tools for blob analysis (Fanning, 2003) are used to derive parameters describing the morphology of pores and the associated flow field. We measured the area Mm2 covered by the pore, the length Mm of the circumference, the ratio Mm, the minimum and the mean intensities, the average flow speed km s-1, the divergence s-1, and the vorticity s-1. Fitting an ellipse to each pore yields among other parameters the eccentricity and the angle ∘ of the major axis with the horizontal (all values refer to the pore shown in Fig. 1). Radial averages beyond the pore’s boundary are only computed, if there are segments covering at least 180∘ in azimuth which are free of any other dark features. An example of blob analysis and azimuthally averaged profiles is presented in Fig. 1. A striking feature in the intensity map is a bright ring around the pore and an annular structure of positive divergence, which envelops the bright intensity ring like an onion peel. The respective divergence centers in the annular structure are related to exploding granules. Inflows inside the pore and outflows in the exterior are commonly found in pores, and the radial velocity profile has a slow gradient inside pore. The detailed results of the statistical study are deferred to an upcoming publication.
Acknowledgements.
Hinode is a Japanese mission developed and launched by ISAS/JAXA, with NAOJ as domestic partner and NASA and STFC (UK) as international partners. It is operated by these agencies in co-operation with ESA and NSC (Norway). MV thanks the German Academic Exchange Service (DAAD) for its support in the form of a PhD scholarship. CD was supported by grant DE 787/3-1 of the German Science Foundation (DFG).References
- Fanning (2003) Fanning, D. W. 2003, IDL programming techniques, ed., Fanning Software Consulting, Fort Collins, Colorado
- November & Simon (1988) November, L.J. & Simon, G. W, 1988, ApJ 333, 427
- Verma & Denker (2011) Verma, M. & Denker, C. 2011, A&A 529, A153