Cascade emission in electron beam ion trap plasma
Abstract
We present investigation of the influence of cascade emission to the formation of spectra from plasma created by electron beam ion trap (EBIT) in electron trapping mode. It has been shown that cascade emission can play an important role in the formation of spectra from the EBIT plasma. Process of the cascade emission takes place when ion having cycloidal orbit leaves electron beam where coronal approximation is applicable. Thus both processes - excitation from ground or metastable levels and cascade emission - take part in the population of levels. Demonstration is based on the investigation of spectra. The present investigation helps to resolve long-standing discrepancies; in particular, the present structure of spectra is in good agreement with measurements on electron beam ion trap. Lines in the experimental spectra are identified as and transitions from Dirac-Fock-Slater calculations.
keywords:
electron beam ion trap , tungsten , radiative cascade , collisional-radiative modeling1 Introduction
An electron beam ion trap (EBIT) [1] is an ideal tool to study radiation of highly charged ions as well as the interactions between electrons and ions - electron impact ionization, electron-ion recombination processes. Electron beam interacting with ions in an ion trap region produces atoms of element in the desirable ionization state which is determined by the energy of electrons. Neighboring ionization states are less populated because the energy of electrons is too small to reach next ionization state or too large to stay in the current one. Consequently, the analysis for lines of spectra can be focused on the main ionization states obtained in the plasma. In addition, low density is another specific characteristic of the plasma. It is assumed that steady state is reached and population of levels does not change in time. Mainly collisional-radiative modeling is applied describing the population and depopulation of the levels. Collisional-radiative modeling in the steady state conditions has been successfully used for the analysis of spectra from highly charged tungsten ions being trapped in the EBIT [2, 3, 4, 5, 6]. However, it was shown that the population of the levels can be determined using coronal approximation [7], i.e. only collisional excitation from the ground state needs to be considered. Good agreement has been obtained for line intensities when compared with data from collisional-radiative modeling. On the other hand, cascade emission, as a general rule, is omitted in the analysis of spectral line formation for the EBIT plasma. We should note that term cascade emission is used here instead of radiative cascade in order to distinguish population of levels from higher levels through radiative cascade which is included in collisional-radiative model. As will be shown later, the population of levels differs for those two cases. The cascade processes have been mostly investigated for radiative and Auger decays of inner shell vacancies [8, 9, 10, 11]. However, trapped ions interact with electrons in the beam, but due to cycloidal orbits the ions can spend part of their time outside the electron beam [12, 13]. Process of the cascade emission has to start when interaction with electrons ends. This effect is more important for ions in the lower or medium effective charge states [14]. It was found that under same conditions, higher charge ions show less expansion in the radial direction. When the charge state of ions increases the Coulomb’s attraction force directed toward electron beam also increases which lead to the decrease of the time ions spend outside the beam where the cascade emission depopulates excited levels. The role of cascade emission depends on the time the ions spend inside and outside the electron beam. However, this time is determined by many parameters: ion temperature, electron beam energy, electron beam current, electric and magnetic fields. On the other hand, the time fraction ions moves in the electron beam can be approximately related to the electron beam diameter and radial distribution of ions in the trap. Effective electron density is often introduced in order to reduce ion-electron collision rates because ions do not dwell all the time in the electron beam region [14, 15]. It was found that range of ion radius ratio against the geometric electron radius can be expressed through the effective charge of ion: with [14]. For , we have , i. e. ions mainly reside outside the electron beam.
In this work we show the importance of cascade emission to the formation of spectra from EBIT plasma in electron trapping mode. To our knowledge, up to know the cascade emission in electron trapping mode has not been analyzed. Cascade emission has been investigated previously in magnetic trapping mode [16] observing X-ray emission after charge exchange of neutrals with highly charged ions. Magnetic trapping mode takes place after the electron beam is switched off, thus, electron-impact excitation does not influence the population of levels.
Our demonstration for the role of cascade emission in electron trapping mode is based on the investigation of spectra obtained at the Berlin EBIT [17, 18]. Using the Berlin EBIT facilities Hutton et al. [17, 18] measured spectra of the tungsten ions at electron beam energies corresponding to the maximum production of ions in the EBIT plasma. They looked for resonance lines corresponding to the transition which could be candidates for fusion plasma diagnostics. It was expected that if collapse of orbitals had occurred in the ion then two prominent resonance lines would be produced in the spectrum. In their work, two intense lines at 258.2 Å and 365.3 Å have been assigned to the transition. Their decisions were based on the agreement with their theoretical calculations, high intensities of lines in the spectra and dependence of line intensities on the electron beam energies. Theoretical analysis has been performed in single-configuration approximation using Cowan code [19] where quasirelativistic Hartree-Fock technique based on Schrodinger equation is adopted taking into account the most important one-electron corrections (mass-velocity and Darwin). Later the detailed investigation of transitions for ion employing relativistic multireference many-body perturbation theory has been performed in [20]. The calculations presented therein showed that ground state of the ion corresponds to the configuration and it does not coincide with earlier predictions obtained from quasirelativistic calculations [21] that Pm-like ions with a nuclear charge larger than 73 have alkali-metal structure with a ground configuration of . Pm-like spectra simulated using collisional-radiative model for low density conditions did not help to identify the observed lines in the experimental spectra [20]. Vilkas et al [22] stressed that their study does not show one or two dominant resonance lines in the spectra. Thus, the situation with the interpretation of the lines from the EBIT plasma spectra corresponding to the radiative transitions in ion was named as class of unsolved mysteries [18].
2 Calculation of spectra
Intensity of spectral lines is determined by equation:
| (1) |
where is the population of level ; - probability of radiative transition from level to level .
Electron impact excitation takes place in the electron beam while the cascade emission occurs outside it. The initial population of the excited levels when ions leave the beam region can be found analyzing excitation from the ground and metastable levels within coronal approximation framework. For this, energy levels, radiative transition probabilities and excitation rates have to be calculated.
2.1 Atomic data
Flexible Atomic Code [23] was employed to obtain energy levels and radiative transition probabilities in using configuration interaction (CI) method. CI basis consists of 32661 levels which arise from 65 configurations: , , , , , , , , , , , , , , , , , , , , , , , , , , , , (; ; ). Energy levels of the lowest configurations are shown in Fig. 1. Electric dipole transitions were calculated among all levels. However, analysis of magnetic dipole, quadrupole and electric quadrupole as well as octupole radiative transitions was performed for the five lowest configurations: , , , and . Electron impact excitation rates to all levels were calculated from the ground level and the lowest levels of configuration within distorted wave approximation. Gaussian distribution function with a full width at a half-maximum of 30 eV used for electron energy. Here we do not take into account ionization and recombination processes from and/or to other tungsten ions. Only levels belonging to the same ionization stage are considered.

2.2 Population of levels
Population of levels after excitation from the ground level is calculated according to the formula:
| (2) |
where is the ground level index and ; - electron impact excitation/deexcitation rate from level to level .
Obtaining population of levels the additional term:
| (3) |
was added in order to take into account supplement population of levels due to radiative cascade from higher levels. Strictly speaking this term is normally omitted in coronal approximation.
However, other population mechanisms appear on the scene when the ions leave electron beam region. The population of levels during the cascade emission changes in every step of cascade:
| (4) |
where corresponds to the population of level in step of the cascade. We only consider levels which have energies lower than ionization threshold and thus can not decay through autoionization transitions.
Using branching ratio:
| (5) |
the Eq. (4) can be written in such a way:
| (6) |
where is initial population of level before the beginning of the cascade emission. Since cascade emission takes place after ions leave electron beam, the initial population of the levels is found from Eq. (2) with Eq. (3) populating levels by electron impact from the ground or metastable levels.
In order to demonstrate the difference in level population for those two cases (Eq. (2) with Eq. (3) and Eq. (4)), let’s take a three level system. The population of the first excited level obtained from Eq. (2) with Eq. (3)
| (7) |
will be increased by the term due to cascade emission obtained from Eq. (4)
| (8) |
where the initial population of the second excited level before emission cascade starts is expressed by
| (9) |
Thus, the cascade emission (Eq. (8)) can very strongly increase the population of lower levels from higher populated levels, i. e. if is much larger than .
3 Results and discussion
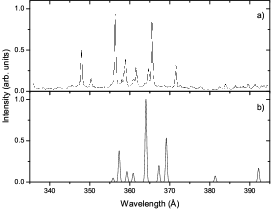
Theoretical spectra which correspond to the radiative transitions after population of levels by electron impact excitation from the ground level ( Eq.(2) with Eq. (3)) at various beam energies contain two prominent groups of lines (Fig. 2). One group is obtained at 220 – 240 Å while the other is formed at 350 – 370 Å. The theoretical spectra are convoluted with a Gaussian function with a half width of 0.2 Å to simulate experimental resolution. In this case, further radiative decay of the levels through the cascade emission was not taken into account while obtaining those theoretical spectra. The structure of lines in the spectrum is similar to the one observed in the EBIT experiment [17, 18]. The wavelength of the strongest line of the second group is equal to 364.04 Å which very well agrees with the experimental wavelength of 365.3 Å (Fig. 3). However, in the previous work [17] the strongest line of the experimental spectrum was identified as transition while our data show that the line corresponds to transition. We note that configuration is the first excited configuration connected to the ground one through strong electric dipole transitions.

Unfortunately, the wavelengths of the first group of lines (220 – 240 Å) significantly differ from the experimental values. Our CI basis consists of one- and/or two-electron excitations from , and configurations. Thus, good agreement for theoretical wavelengths of the second group of lines (350 – 370 Å) with observed data indicates that main correlation effects important for transition are taken into account. Therefore, we suggest that wavelengths at 250 – 270 Å in the experimental spectrum are formed by other transitions in . Consequently, we have analyzed population of the lowest metastable levels of configuration.
| No. | , eV | Level | , s | |
|---|---|---|---|---|
| 0 | 0.0 | 7/2 | (7/2) | – |
| 1 | 2.1848 | 5/2 | (5/2) | |
| 2 | 3.8279 | 11/2 | (6) | |
| 3 | 4.4857 | 13/2 | (6) | |
| 4 | 5.1054 | 7/2 | (4) | |
| 5 | 5.4559 | 9/2 | (4) | |
| 6 | 6.2594 | 11/2 | (5/2) (7/2)5 | |
| 7 | 6.3337 | 9/2 | (5/2) (7/2)5 | |
| 8 | 7.0263 | 7/2 | (5/2) (7/2)4 | |
| 9 | 7.3568 | 5/2 | (5/2) (7/2)3 | |
| 10 | 7.4865 | 9/2 | (5/2) (7/2)4 | |
| 11 | 7.5391 | 3/2 | (2) | |
| 12 | 7.8546 | 5/2 | (5/2) (7/2)3 | |
| 13 | 8.2631 | 7/2 | (5/2) (7/2)3 |
The lowest level of configuration compared with the ground one gains much larger relative population after excitation from the ground level when Eq. (2) with Eq. (3) are used to find population of excited levels in corona model. Collisional-radiative modeling ( cm-3, eV) performed for the twelve lowest levels of ion (Table 1) shows that the first level of configuration has also the largest population. As well, the levels excited from the ground level decay through the cascade emission mainly to the lowest level of configuration if weak transitions from the levels of configuration to the lower levels of the ground configuration are not taken into account. On the other hand, the cascade emission after the excitation from the lowest level of configuration populates mainly the second level of this configuration.
Table 1 presents energy levels and radiative lifetimes for 14 lowest levels of ion. The levels of configuration have the largest lifetimes among the excited levels of the five lowest configurations for which extended study of radiative transitions (E1, E2, E3, M1, M2) are performed. The lowest level of the configuration can decay to the ground level through electric quadrupole transition. The large lifetimes of these levels and population of the levels through the cascade emission indicate that population of the lowest levels of configuration exceeds population of the ground configuration. Thus, mainly excitations from the metastable levels of the first excited configuration are responsible for line formation in the EBIT spectra of ion. These levels have to be considered in the coronal approximation.
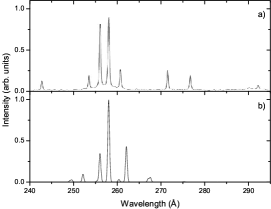
Fig. 4a displays the theoretical spectrum obtained after electron impact excitation from the second lowest level of configuration at electron density equal to cm-3 and beam energy of eV . Only the cascade emission after the excitation from the level again reveals two groups of lines (Fig. 4b). The similar situation is observed with excitation from the lowest level of configuration.
One group of lines is formed at 360–370 Å as in the case of excitation from the ground level. It is interesting that those lines again correspond to the transitions from the levels of configuration to the ground configuration. The initial level of the transition which corresponds to the strongest line at 364.04 Å is populated by the weak electric dipole transitions from the levels of configuration during the cascade emission. Those transitions are available due to configuration mixing and therefore transition wavelengths and probabilities are very sensitive to the used set of interacting configurations.
The other group of lines appears at 260–280 Å. These lines correspond to transition. Consequently, lines of the experimental spectra can be identified as electric dipole transition of type. However, wavelengths of those lines differs by about 16.5 Å from the experimental group of lines obtained at 258 Å. Correlation effects for the levels of and configurations are very important and it requires large computer resources for such large number of levels which have to be included in CI basis. Large discrepancies for wavelengths of this group of lines can be explained by the fact that in CI basis we included only one- and/or two-electron excitations for , and configurations but not for and configurations. On the other hand, for Er-like tungsten it was found that FAC shows discrepancies within 20 Å of the measured values due to large configuration-interaction effects [24].
Levels of configuration are mainly populated through cascade emission from levels of configuration. Those transitions are only available due to configuration interaction effects and are very weak. They correspond to electric octupole transitions in the single configuration approach.

Correspondence among theoretical and experimental lines for the group of lines is presented in Fig. 5. Theoretical spectrum in Fig. 5b was shifted to the short wavelength side by 16.5 Å for a better agreement with experimental lines.
Finaly, we checked what gives charge exchange (CX) of the ions with neutral atoms that are present in the EBIT to the formation of spectrum for ion. Due to CX of neutrals with highly charged ions, electrons are mainly captured to the excited levels with principal quantum number ( is effective charge of the ion) [25]. For , it gives . We calculated spectrum which corresponds to the cascade emission from levels with taking population of levels equal to their statistical weights. Complex structure of lines in the theoretical spectrum shows that influence of CX to the line intensities of experimental spectrum is small. Furthermore, good agreement obtained for relative line intesities when CX process was not included in CRM for higher ionization charges [2, 3] demonstrates that charge exchange is not important for line formation in EBIT plasma.
4 Conclusions
We showed that cascade emission has to be taken into account in combination with coronal approximation for the analysis of spectral lines from the electron beam ion trap plasma in electron trapping mode. Our demonstration is based on the investigation of line intensities obtained after excitation from the ground or metastable levels with consequent cascade emission for ion. Cascade emission heightens only a few lines from the complex structure of lines which obtained using corona model. For the first time, lines in the experimental spectrum are identified as and transitions in ion. Good agreement is obtained between experimental and theoretical spectra only after cascade emission was included in calculations.
Further investigation is needed for wavelengths and relative line intensities in order to obtain better agreement to the experimental spectrum. Large scale calculations in Dirac-Fock [26] approach with selected CI basis from configuration interaction strength [27] are on the way for transition and will be published elsewhere.
Akcnowledgement
This research was funded by European Social Fund under the Global Grant Measure (No.: VP1-3.1-ŠMM-07-K-02-015).
References
- Marrs et al. [1988] Marrs, R.E., Levine, M.A., Knapp, D.A., Henderson, J.R.. Measurement of electron-impact–excitation cross sections for very highly charged ions. Phys Rev Lett 1988;60:1715–18.
- Ralchenko et al. [2006] Ralchenko, Y., Tan, J.N., Gillaspy, J.D., Pomeroy, J.M., Silver, E.. Accurate modeling of benchmark X-ray spectra from highly charged ions of tungsten. Phys Rev A 2006;74(4):042514.
- Ralchenko et al. [2007] Ralchenko, Y., Reader, J., Pomeroy, J.M., Tan, J.N., Gillaspy, J.D.. Spectra of - in the 12-20 nm region observed with an EBIT light source. J Phys B 2007;40(19):3861–75.
- Radtke et al. [2007] Radtke, R., Biedermann, C., Fussmann, G., Schwob, J., Mandelbaum, P., Doron, R.. Measured line spectra and calculated atomic physics data for highly charged tungsten ions. Atomic and Plasma - Material Interaction Data for Fusion 2007;13:45–66.
- Ralchenko et al. [2008] Ralchenko, Y., Draganic, I.N., Tan, J.N., Gillaspy, J.D., Pomeroy, J.M., Reader, J., et al. EUV spectra of highly-charged ions - relevant to ITER diagnostics. J Phys B 2008;41(2):021003 (6pp).
- Chen [2008] Chen, G.X.. X-ray line ratio 3C/3D in Fe XVII. Mon Not R Astron Soc 2008;386(1):L62–L66.
- Jonauskas et al. [2007] Jonauskas, V., Kučas, S., Karazija, R.. On the interpretation of the intense emission of tungsten ions at about 5 nm. J Phys B 2007;40(11):2179–88.
- Jonauskas et al. [2003] Jonauskas, V., Partanen, L., Kučas, S., Karazija, R., Huttula, M., Aksela, S., et al. Auger cascade satellites following 3d ionization in xenon. J Phys B 2003;36(22):4403–16.
- Jonauskas et al. [2008] Jonauskas, V., Karazija, R., Kučas, S.. The essential role of many-electron auger transitions in the cascades following the photoionization of 3p and 3d shells of kr. J Phys B 2008;41(21):215005 (5pp).
- Palaudoux et al. [2010] Palaudoux, J., Lablanquie, P., Andric, L., Ito, K., Shigemasa, E., Eland, J.H.D., et al. Multielectron spectroscopy: Auger decays of the krypton 3d hole. Phys Rev A 2010;82(4):043419.
- Jonauskas et al. [2011] Jonauskas, V., Kučas, S., Karazija, R.. Auger decay of 3-ionized krypton. Phys Rev A 2011;84:053415.
- Currell [2001] Currell, F.J.. Trapping Highly Charged Ions: Fundamentals and Applications. Nova Science Publishers, New York; 2001, p. 3.
- Gillaspy et al. [1995] Gillaspy, J., Aglitskiy, Y., Bell, E., Brown, C., Chantler, C., Deslattes, R., et al. Overview of the electron-beam ion-trap program at NIST. Physica Scripta 1995;T59:392–5.
- Liang et al. [2009] Liang, G.Y., Lopez-Urrutia, J.R.C., Baumann, T.M., Epp, S.W., Gonchar, A., Lapierre, A., et al. Experimental investigations of ion charge distributions, effective electron densities, and electron-ion cloud overlap in electron beam ion trap plasma using extreme-ultraviolet spectroscopy. Astrophys J 2009;702(2):838–50.
- Chen et al. [2004] H. Chen, P. Beiersdorfer, L. A. Heeter, D. A. Liedahl, K. L. Naranjo-Rivera, E. Träbert, M. F. Gu, J. K. Lepson, Experimental and Theoretical Evaluation of Density-sensitive N VI, Ar XIV, and Fe XXII Line Ratios, Astrophys J 2004;611(1):598–604.
- Beiersdorfer et al. [1996] Beiersdorfer, P., Schweikhard, L., López-Urrutia, J.C., Widmann, K.. The magnetic trapping mode of an electron beam ion trap: New opportunities for highly charged ion research. RSI 1996;67(11):3818.
- Hutton et al. [2003] Hutton, R., Zou, Y., Reyna Almandos, J., Biedermann, C., Radtke, R., Greier, A., et al. EBIT spectroscopy of Pm-like tungsten. Nucl Instr Meth B 2003;205:114–18.
- Wu and Hutton [2008] Wu, S., Hutton, R.. Applications of EBITs to spectra of multi-electron ions: some solved and some unsolved problems. Can J Phys 2008;86:125–29.
- Cowan [1981] Cowan, R.D.. The Theory of Atomic Structure and Spectra. Berkeley, CA: University of California Press; 1981.
- Träbert et al. [2009] Träbert, E., Vilkas, M.J., Ishikawa, Y.. A tale of two lines: Searching for the 5s-5p resonance lines in Pm-like ion spectra. J Phys Conf Ser 2009;163:012017.
- Curtis, L. J. and Ellis, D. G. [1980] Curtis, L. J., , Ellis, D. G., . Alkalilike spectra in the promethium isoelectronic sequence. Phys Rev Lett 1980;45:2099–102.
- Vilkas et al. [2008] Vilkas, M.J., Ishikawa, Y., Träbert, E.. Electric-dipole transitions in promethiumlike ions. Phys Rev A 2008;77:042510.
- Gu [2003] Gu, M.F.. Indirect X-Ray Line-Formation Processes in Iron L-Shell Ions. Astrophys J 2003;582:1241–50.
- Clementson et al. [2010] Clementson, J., Beiersdorfer, P., Magee, E.W., McLean, H.S., Wood, R.D.. Tungsten spectroscopy relevant to the diagnostics of ITER divertor plasmas. Journal of Physics B: Atomic, Molecular and Optical Physics 2010;43(14):144009.
- Janev et al. [1985] Janev, R.K., Presnyakov, L.P., Shevelko, V.P.. Physics of Highly Charged Ions. Berlin: Springer; 1985.
- Grant [2007] Grant, I.. Relativistic quantum theory of atoms and molecules: theory and computation. Springer series on atomic, optical, and plasma physics. Springer; 2007.
- Jonauskas et al. [2010] Jonauskas, V., Kisielius, R., Kynienė, A., S. Kučas, , Norrington, P.H.. Magnetic dipole transitions in 4dn configurations of tungsten ions. Phys Rev A 2010;81:012506.