Low Density Structures in the Local Universe.
I. Diffuse
Agglomerates of Galaxies
Abstract
This paper is the first of a series considering the properties of distribution of nearby galaxies in the low density regions. Among 7596 galaxies with radial velocities km/s, absolute magnitudes , and Galactic latitudes there are 3168 field galaxies (i.e. 42%) that do not belong to pairs, groups or clusters in the Local universe. Applying to this sample the percolation method with a radius of Mpc, we found 226 diffuse agglomerates with number of members. The structures of eight most populated objects among them () are discussed. These non-virialized agglomerates are characterized by a median dispersion of radial velocities of about km/s, the linear size of around Mpc, integral -band luminosity of , and a formal virial-mass-to-luminosity ratio of about . The mean density contrast for the considered agglomerates is only , and their crossing time is about – Gyr.
1 INTRODUCTION
Recent photometric and spectral massive sky surveys: 2MASS Jar2000:Karachentsev_n , SDSS Abaz2009:Karachentsev_n , 2MRS Huch2012:Karachentsev_n , 6dF Jon2009:Karachentsev_n etc. demonstrate that the principal elements of the large-scale structure of the Universe are cosmic voids, embordered by filaments and walls towards which the galaxies are concentrated. In knots, at the intersection of walls and filaments rich clusters of galaxies are emerging. The glow of hot intergalactic gas in rich clusters makes them outstanding objects in the X-ray maps of the sky. Numerical simulations of the formation and evolution of the large-scale structure sustain this pattern quite well Klyp2003:Karachentsev_n ; Schaap2007:Karachentsev_n ; Shand2011:Karachentsev_n ; Klyp2011:Karachentsev_n . In the modern epoch () virialized regions of groups and clusters of galaxies, as well as the collapsing regions around them concentrate about 74% of all the galaxies, or about 90% of stellar mass. However, these dynamically ‘‘advanced’’ regions occupy only about 5% of the total volume Kar2012:Karachentsev_n . The remaining 95% of the volume are occupied by about a quarter of all galaxies (or 10% of stellar mass) which are involved in the infinite cosmic expansion.
At present we are witnessing a somewhat paradoxical situation: rich clusters of galaxies, their structure and evolution are already investigated with enough detail, while the properties of the principal elements of the cosmic volume (the voids, filaments and walls) are so far only known in the most general outline. The emphasis made on the study of ‘‘tops’’ of the large-scale structure and the neglect of its ‘‘roots’’ renders the prevailing approach quite asymmetric. One reason for this asymmetry is the paucity of data available on the individual distances of galaxies. The Extragalactic Distance Database (http://edd.ifa.hawaii.edu), created by Tully et al. Tul2009:Karachentsev_n shows that the relative number of galaxies with measured distances rapidly drops with increasing distance, making up a small percentage as early as at Mpc.
5mm \onelinecaptionsfalse \captionstylenormal
5mm \onelinecaptionsfalse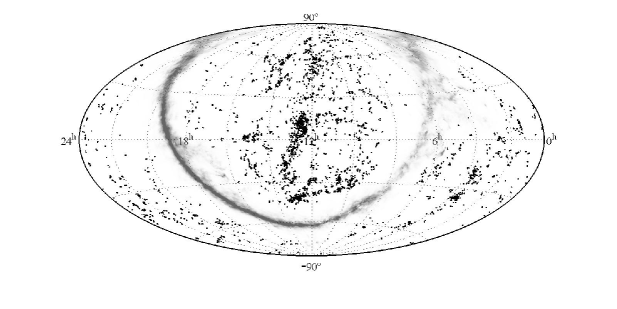
 \captionstylenormal
To study the properties of the nearby part of the large-scale structure, we compiled a sample of 10 500 galaxies with radial velocities of km/s relative to the centroid of the Local Group (LG), which covers the entire sky except for low Galactic latitudes . The morphological types, the data on the radial velocities and apparent magnitudes were determined or refined for all the galaxies of this sample. Using the new clustering algorithm, which takes into account the galaxy differences by luminosity, there were compiled the catalogs of 509 pairs Kar2008:Karachentsev_n , 168 triple systems Mak2009:Karachentsev_n and 395 groups of galaxies Mak2011:Karachentsev_n . In addition, a separate catalog was devoted to 520 most isolated galaxies in this volume Kar2011:Karachentsev_n .
Since the best indicator of the stellar mass of the galaxy is its -band luminosity, we adopted the apparent -magnitudes of galaxies from the 2MASS survey Jar2000:Karachentsev_n . In their absence, the -magnitudes of galaxies were determined from the known -magnitudes and the mean color indices depending on the morphological type of the galaxy. From the original sample of 10 500 galaxies with – km/s, we have eliminated the objects fainter than , and dwarf galaxies with absolute magnitudes of given the Hubble constant of km/s/Mpc. The latter condition provides that the galaxies with luminosities brighter than the luminosity of the Small Magellanic Cloud would be visible both nearby and at the far edge ) of the considered volume. Having sacrificed 2906 dwarf galaxies (28% of the sample), we have considerably relaxed the selection effect by distance, which was imposing unequal conditions to the nearby and far volumes. We use the sample of 7596 galaxies corrected this way for the further analysis of elements of the large-scale structure of the Local universe at extremely low densities.
2 THE FIELD GALAXIES AND CLUSTERED POPULATION
The distribution of 7596 galaxies in our sample by the apparent () and absolute magnitudes is presented in the left and right panels of Fig. 1. The maximum of the distribution falls on , from what we can conclude that in many galaxies of this volume with – the line-of-sight velocities have not yet been measured. The clustered galaxies are marked by hatching in both panels. The clustering algorithm applied assumes that the stellar mass of each galaxy is determined by its -luminosity, and the total mass of its dark halo is times larger than the stellar mass. The criterion of inclusion of galaxies in a pair or group was based on two obvious considerations: 1) the total energy of a hypothetic system has to be negative, and 2) the members of a virtual system have to be causally interrelated (their mutual separations have to be within the ‘‘zero-velocity sphere’’, which separates a potential group from the common Hubble expansion). The latter condition is required as a complement to the former, since we do not know the total (spatial) distances and velocities of galaxies. In fact, our algorithm has an only arbitrary parameter , assumed to be equal to 6 regardless of the luminosity of a galaxy and its neighborhood. Note that the global ratio of the dark matter density to the baryon density is Fuk2004:Karachentsev_n .
The application of our algorithm resulted in the integration of 4428 galaxies out of 7596 into systems, i.e. the percentage of clustered galaxies and members of the general ‘‘field’’ amounted to 58:42. It proved to be slightly higher than for the entire original sample, 52:48, from which the dwarf objects were not yet eliminated. These figures suggest that normal galaxies tend to get clustered more than their dwarf counterparts.
5mm \onelinecaptionstrue\captionstylenonumber Agglpmerate RA DEC n n(E,S0) km/s km/s Mpc Leo–Virgo 83 +1210 158 8.7 3.4 2.4 700 9 Eridanus–Columba 4.3 –36 69 +1080 273 7.6 3.0 6.2 2050 13 Centaurus 13.3 –32 43 +2310 182 6.5 4.3 1.6 360 4 Microscopium 21.0 –39 39 +2670 110 6.2 3.0 0.8 270 3 Crater–Corvus 11.9 –17 33 +1510 180 4.8 1.7 1.7 1000 1 Libra–Hydra 15.1 –20 29 +2300 153 6.2 2.3 1.6 690 2 Virgo 12.4 +2 25 +2070 217 4.7 2.0 2.4 1210 1 Tucana–Grus 22.5 –59 25 +3170 109 4.1 5.1 0.6 110 2
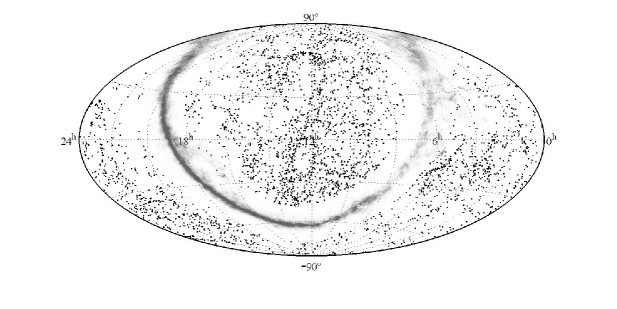
The sky distribution of 4428 clustered and 3168 non-clustered galaxies of the Local universe is presented in the top and bottom panels of Fig. 2 in equatorial coordinates. The region of significant galactic absorption along the Milky Way is shown by the gray ragged stripe. As we can see, the members of systems of different multiplicity are revealing a strong concentration towards the equator of the Local Supercluster, centered in the Virgo cluster ). The population of non-clustered galaxies practically does not show this concentration. At the same time, the distribution of field galaxies does not look quite uniformly random. In different regions of the sky low contrast structures are visible, the presence of which is not related to the flocky galactic extinction.
5mm \onelinecaptionsfalse \captionstylenormal
5mm
 \captionstylenormal\onelinecaptionsfalse
Figure 3 represents the line-of-sight velocity distribution of galaxies in our sample in the LG centroid frame. Clustered galaxies are marked by hatching. Their relative number next to the ulterior boundary of the volume significantly drops due to the shortage of galaxies with measured velocities among the distant objects.
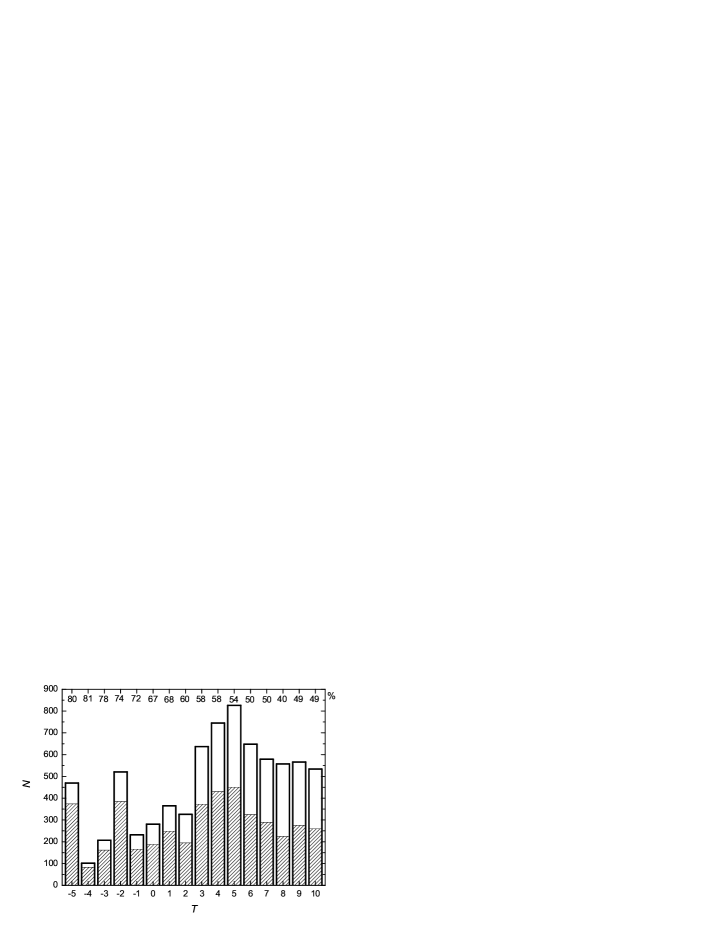
As we know, the galaxies of early morphological types (E, S0, Sa) show a higher degree of clustering than the late-type galaxies. The expected effect of morphological segregation is also evident in our samples. Figure 4 shows the distribution of galaxies of our volume by morphological types in the de Vaucouleurs scale. The clustered galaxies are marked by hatching, their percentage for each type is shown at the top edge. As we can see, the galaxies with developed bulges () are present among the clustered galaxies in a much greater proportion than among the galaxies of the field.
5mm
 \captionstylenormal\onelinecaptionsfalse
5mm
 \captionstylenormal \onelinecaptionsfalse
5mm
 \captionstylenormal\onelinecaptionsfalse
3 PERCOLATION AND LOW DENSITY GALAXY AGGLOMERATES
To make headway in understanding the features of the distribution of 3168 non-clustered galaxies, we tried to sort out any non-random structures among them. This can be done by different means. We used the simplest method of percolation. Estimating the distances to galaxies by their radial velocities at km/s/Mpc and neglecting their peculiar velocities, we have determined the spatial distance to the nearest neighbor for each of them. The distribution of the number of galaxies in increments of is shown in Fig. 5 in the logarithmic scale. Two-thirds of the galaxies have their nearest neighbor within Mpc. We selected this value as the percolation radius via the ‘‘friends of friends’’ (FoF) method Huch1982:Karachentsev_n .
5mm \onelinecaptionsfalse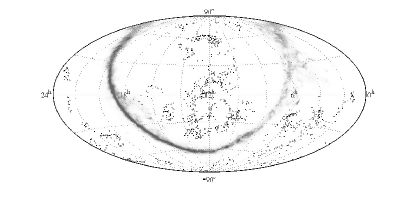
normal
Combining the galaxies with mutual separations of Mpc into the agglomerates of different populations , we obtained the following result: the number of non-percolated, i.e. very isolated galaxies was found to be 543. The remaining galaxies have grouped into agglomerates with the number of members from 2 to 84. The distribution of the number of such structures by the number of members is shown in Fig. 6. It is easy to see that compared with the Poisson distribution this one has a long tail, the presence of which indicates that the unification of galaxies in large associations is not random.
Figure 7 shows the distribution of 226 agglomerations with members, as well as 54 most populated structures with by the average mutual separation of their members. The medians of these distributions are 2.9 Mpc and 4.2 Mpc, respectively, i.e. the linear dimensions of these structures are comparable to the virial radius of rich clusters of galaxies.
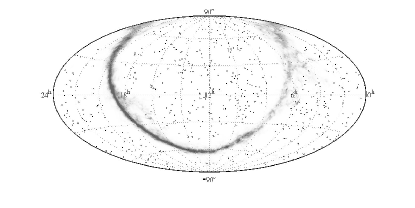
The sky distribution of 989 galaxies belonging to the agglomerates with members is demonstrated in the upper panel of Fig. 8. For a comparison, the bottom panel displays a similar distribution of 543 single galaxies, not subjected to percolation (). The characters of these distributions are strikingly different, once again suggesting that the low density regions are hosting some non-virialized extended structures, which comprise a significant number of galaxies.
5mm \onelinecaptionsfalse
normal
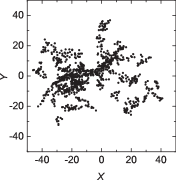
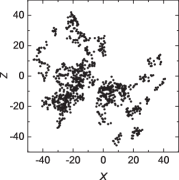
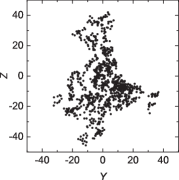
The flocky nature of the distribution of galaxies belonging to the agglomerates with populations of is also clearly visible in Fig. 9, where we used the Cartesian equatorial coordinates. The spottiness of these projected distributions is partly caused by the presence of the extinction region in the Milky Way. However, the filamentary structure of a great many agglomerates can not be caused by the effect of galactic extinction only.
4 THE MOST POPULATED GALAXY AGGLOMERATES
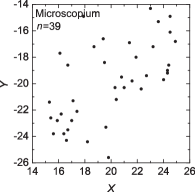
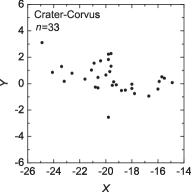
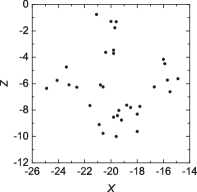
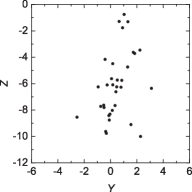
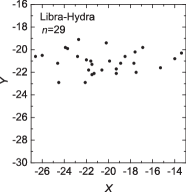
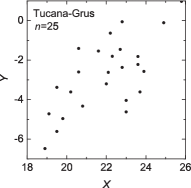
A summary of eight diffuse agglomerates in the Local universe with the number of galaxies is presented in the table. The columns of the table include: (1) the names of the constellations, where the agglomerate is located, (2) the equatorial coordinates of the centroid, (3) the number of members with measured radial velocities, (4) the mean line-of-sight velocity relative to the Local Group, (5) the line-of-sight velocity dispersion, (6) the mean spatial separation between the agglomerate members, (7) integral -band luminosity (i.e. the total stellar mass), (8) the formal value of virial mass, (9) the formal virial mass-to--luminosity ratio (or the ratio of dark-to-luminous matter), (10) the number of the agglomerate members of E and S0 morphological types. As we can see, the relative number of early-type galaxies in these structures is only about 10%.
5mm \onelinecaptionsfalse
normal
5mm \onelinecaptionsfalse
normal
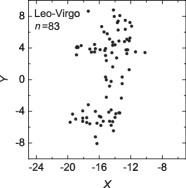
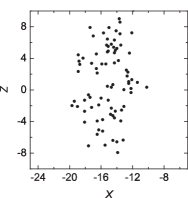
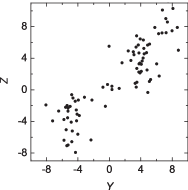
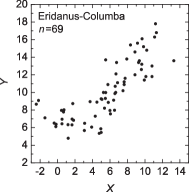
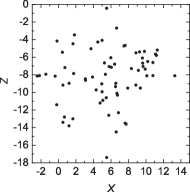
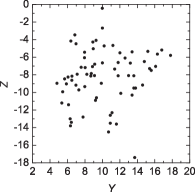
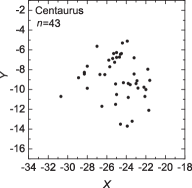
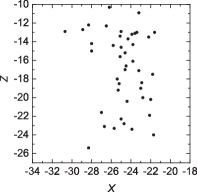
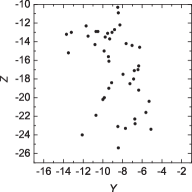
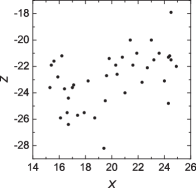
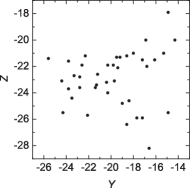
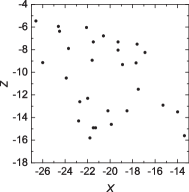
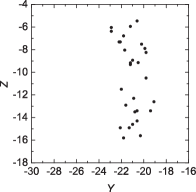
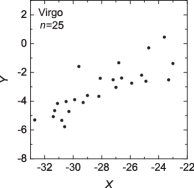
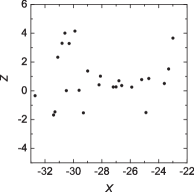
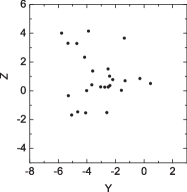
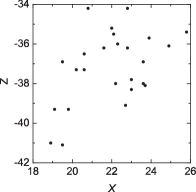
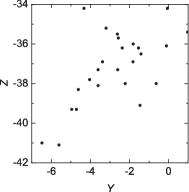
The panels of Figs. 10 and 11 show the distribution of galaxies of eight most populated agglomerates in the projections of Cartesian equatorial coordinates (in Mpc). As follows from these figures, the shapes of agglomerates are very diverse and are generally far from being spherically symmetric. In a half of cases, they could be conditionally called filamentary or deplanate.
The median line-of-sight velocity dispersion in rich agglomerates ( km/s) and median -lumino- sity ) are close to the corresponding median values for the Makarov-Karachentsev (MK) groups in the same volume of Local universe Mak2011:Karachentsev_n , but the linear dimensions of the agglomerates exceed the typical size of MK-groups by an order of magnitude. The median of the formal value of virial mass in rich agglomerates, is comparable to the mass of poor clusters, whereas the median of the formal virial mass-to--luminosity ratio, equal to about is by an order of magnitude higher than the corresponding value for the richest clusters.
It should be emphasized that the considered agglomerates are extremely incoherent buildups with no obvious signs of concentration of galaxies towards their geometric centers. The average number density of galaxies in them is only about five times higher than the mean number density of galaxies in the considered volume of the Local universe. Given the scales and line-of-sight velocity dispersions specified in the table, the characteristic crossing time in these aggregates is 30–40 Gyr, what is significantly larger than the age of the Universe.
5 CONCLUDING REMARKS
The considered volume of the Local universe with the diameter of about 100 Mpc is a quite representative sample, including the entire Local Supercluster and the spurs of other neighboring superclusters. This volume comprises both groups and clusters, as well as the cosmic voids. Searching for the diffuse associations of galaxies in the regions of low density, we used only the kinematic distances of galaxies, , neglecting their peculiar velocities. Until fairly recently, there was an idea that large peculiar velocities of galaxies are only found in the ‘‘hot’’ virial regions of clusters, while in the field galaxies the deviations from the Hubble relation are small. According to the current data, however, the field galaxies, surrounding the Local Group are involved in a bulk motion towards the Virgo cluster with the velocity of about km/s, and in the motion from the center of the Local Void, caused by the expansion of the void with the velocity of about km/s Tul2008:Karachentsev_n . Numerous simulations of the evolution of large-scale structure Klyp2003:Karachentsev_n ; Schaap2007:Karachentsev_n reveal the presence of coherent motions of field galaxies with amplitudes of a few hundred km/s on the scale of approximately (–) Mpc. The observational data on large peculiar motions of galaxies in the Coma I region give indications that there exists a possible ‘‘dark attractor’’ with a mass of around at the distance of 15 Mpc from us Karach2011:Karachentsev_n .
Large-scale flows of galaxies related to the motions of filaments and walls can lead to phantom phase groupings of galaxies, if only the kinematic distances are used for their clustering. Such false ‘‘phase caustics’’ can be easily confused with the scattered physical groupings of galaxies. Therefore, some or even most of the discussed agglomerates in the low-density regions can prove to be phantom structures.
It is obvious that for checking the verity of the existence of the diffuse agglomerates we have discovered, the measurements of galaxy distances by the Tully-Fisher method Tul1977:Karachentsev_n or any other technique, independent of the line-of-sight velocities are yet required.
Acknowledgements.
This study was made owing to the support of the following grants: the grants of the Russian Foundation for Basic Research (project nos. 11-02-90449-Ukr-f-a, 12-02-91338-NNIO), the Ukrainian State Fund for Fundamental Research (project no. F40.2/049), the Cosmomicrophysics program of the National Academy of Sciences of the Ukraine, and by the Ministry Education and Science of the Russian Federation (state contract no. 14.740.11.0901).References
- (1) T. N. Jarrett, T. Chester, R. Cutri, et al., Astronom. J. 119, 2498 (2000).
- (2) K. N. Abazajian, J. K. Adelman-McCarthy, M. A. Agueros, et al., Astrophys. J. Suppl. 182, 54 (2009).
- (3) J. P. Huchra, L. M. Macri, K. L. Masters, et al., Astrophys. J. Suppl. 199, 26 (2012).
- (4) D. H. Jones, M. A. Read, W. Saunders, et al., Monthly Notices Roy. Astronom. Soc. 399, 683 (2009).
- (5) A. Klypin, Y. Hoffman, A. V. Kravtsov, and S. Gottloeber, Astrophys. J. 596, 19 (2003).
- (6) W. Schaap, PhD Thesis (Groningen Univ., 2007).
- (7) S. Shandarin, S. Habib, and K. Heitmann, arXiv:1111.2366 (2011).
- (8) A. A. Klypin, S. Trujillo-Gomez, and J. Primack, Astrophys. J. 740, 102 (2011).
- (9) I. D. Karachentsev, Astrophysical Bulletin 67, 123 (2012).
- (10) R. B. Tully, L. Rizzi, E. J. Shaya, et al., Astronom. J. 138, 323 (2009).
- (11) I. D. Karachentsev and D. I. Makarov, Astrophysical Bulletin 63, 299 (2008).
- (12) D. I. Makarov and I. D. Karachentsev, Astrophysical Bulletin 64, 24 (2009).
- (13) D. I. Makarov and I. D. Karachentsev, Monthly Notices Roy. Astronom. Soc. 412, 2498 (2011).
- (14) I. D. Karachentsev, D. I. Makarov, V. E. Karachentseva, and O. V. Melnyk, Astrophysical Bulletin 66, 1 (2011).
- (15) M. Fukugita and P. J. E. Peebles, Astrophys. J. 616, 643 (2004).
- (16) J. P. Huchra and M. J. Geller, Astrophys. J. 257, 423 (1982).
- (17) R. B. Tully, E. J. Shaya, I. D. Karachentsev, et al., Astrophys. J. 676, 184 (2008).
- (18) I. D. Karachentsev, O. G. Nasonova, and H. M. Courtois, Astrophys. J. 743, 123 (2011).
- (19) R. B. Tully and R. J. Fisher, Astronom. and Astrophys. 54, 661 (1977).