A Simple Method To Test For Energy-Dependent Dispersion In High Energy Light Curves Of Astrophysical Sources
Abstract
We present a method of testing for the presence of energy dependent dispersion in transient features of a light curve. It is based on minimising the Kolmogorov distance between two cumulative event distribution functions. The unbinned and non-parametric nature of the test makes it particularly suitable for searches of statistically limited data sets and we also show that it performs well in the presence of modest energy resolutions typical of gamma-ray observations (). We illustrate its potential to set constraints on quantum-gravity induced Lorentz invariance violation effects from observations by the current and future generation of ground-based gamma-ray telescopes.
Keywords:
time series analysis:
95.75.Wx, 04.60.Bc1 Introduction
Timing analysis algorithms with the capability of resolving energy dependent properties can be an important tool for probing the physical mechanisms leading to flux variability, such as particle acceleration and cooling Bednarek08 , or the nature of a propagating medium Amelino-Camelia98 . In the case of very high energy gamma-ray sources, where high energy processes can be responsible for extreme and short-lived variability events, the observational data are often limited by low photon statistics and non-negligible uncertainty in the reconstructed energy of indivdual events. This makes unbinned methods, which act on the information of the entire available sample, the natural and preferential choice of approach to the temporal analysis of these event lists.
2 Method
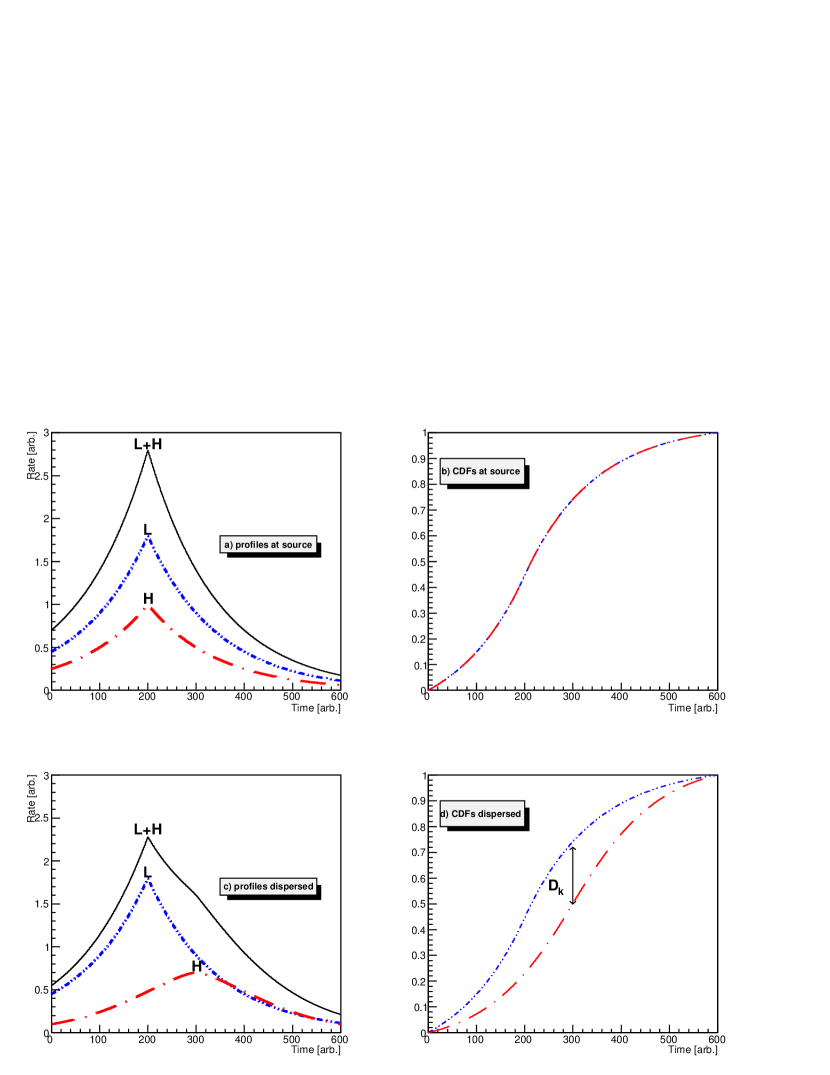
If the low () and high () energy particles are generated in the same region then they must be able to exist co-spatially. The act of acceleration, or cooling, or moving through a dispersive medium will act to separate the and populations relative to each other. An energy dependent correction factor () can be applied to the event arrival times ()
| (1) |
where is the difference in arrival time with and without dispersion, is the energy of the event and is the scale of the correction (1 for linear, 2 for quadratic, etc). By cycling through a range of correction factors we can determine the one () where the shape of the light-curve best fits that of the one, here we use the Kolmogorov distance between the cumulative distribution function (CDF) of the event arrival times, as seen in figure 1.
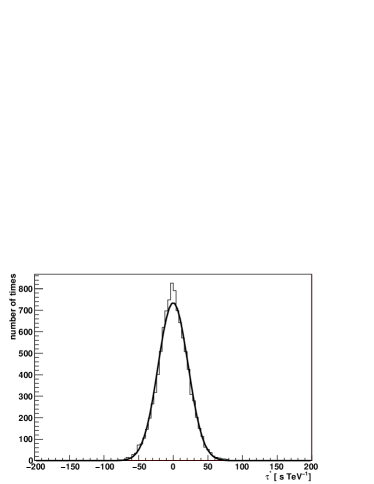
Simulating 10,000 lightcurves shows the Kolmogorov test always has a well defined minimum, with the difference between the expected and best correction () well fit by a Gaussian 2. The RMS of the fit is dependent on the width of the light-curve, but relatively insensitive to the rise and fall times or the number of events contained within, provided there are events in the sample. It is also relatively insensitive to the energy binning provided the .
We quantify the sensitivity to the burst width by the term sensitivity factor, defined as
| (2) |
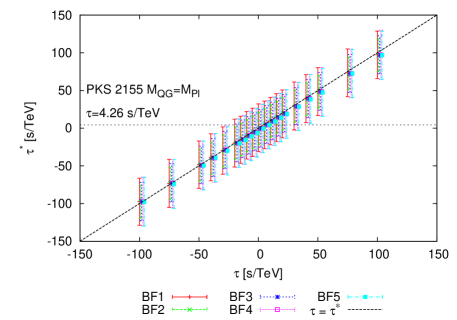
where is the width of the transient feature in the light-curve. In figure 3 we simulated 10,000 Gaussian burst profiles of 500 events each and a power-law spectral index of -2.5. A dispersion was introduced that varied from 5-200% of the burst width. We see, as expected, that the narrower a burst relative to the dispersion the better it can be determined. Also plotted in figure 3 are the results of varying energy resolutions () from ideal (0%, 10% and 20%). There is a small systematic trend for the reconstructed lag to be underestimated as the energy resolution worsens, again this is to be expected, but this is very small in comparison to the overall statistical error in showing the method is robust to the modest energy resolutions expected in ground based gamma-ray astronomy. It is possible to overcome this systematic trend with appropriate Monte Carlo modelling or bootstrapping, if necessary.

3 Discussion & Conclusions
We have presented a simple method to perform an unbinned, non-parametric energy dependent timing analysis of data with low statistics and moderate energy resolutions. Further details of the performance of the method can be found in BdA12 , simulations of current generation VHE gamma-ray instrument observations of AGN show the method to be comparable in sensitivity to the more sophisticated analyses which have to make greater assumptions on the instrinsic source physics and instrument response functions. The placing of Planck scale limits on the linear term in Lorentz invariance violation due to quantum gravity models could be achievable in observations by the next generation instrument CTA Doro12 .
References
- (1) W. Bednarek & R. M. Wagner, A&A 486, 679 (2008).
- (2) G. Amelino-Camelia, et al. Nature 395, 525 (1998).
- (3) U. Barres de Almeida & M. K. Daniel APh 35, 850 (2012).
- (4) M. Doro et al. arXiv:1208.5356