Pulsar emission at the bottom end of the electromagnetic spectrum
Abstract
Pulsars are arguably the only astrophysical sources whose emission spans the entire electromagnetic spectrum, from decameter radio wavelengths to TeV energies. The LOw Frequency ARray (LOFAR) offers the unique possibility to study pulsars over a huge fractional bandwidth in the bottom 4 octaves of the radio window, from 15–240 MHz. Here we present a LOFAR study of pulsar single pulses, focussing specifically on the bright nearby pulsar B0809+74. We show that the spectral width of bright low-frequency pulses can be as narrow as 1 MHz and scales with increasing frequency as , at least in the case of the PSR B0809+74. This appears to be intrinsic to the pulsar, as opposed to being due to propagation effects. If so, this behavior is consistent with predictions by the strong plasma turbulence model of pulsar radio emission. We also present other observed properties of the single pulses and discuss their relation to other single-pulse phenomena like giant pulses.
keywords:
radiation mechanisms: nonthermal, methods: data analysis, pulsars: individual (PSR B0809+74)1 Introduction
In recent years a number of studies of strong individual pulses from bright nearby pulsars were performed, including some at low radio frequencies (see, e.g., [Kuzmin(2006), Kuzmin 2006 and references therein]; [Weltevrede et al.(2006)Weltevrede, Wright, Stappers, & Rankin, Weltevrede et al. 2006]; [Karuppusamy et al.(2011)Karuppusamy, Stappers, & Serylak, Karuppusamy et al. 2011]). Higher radio frequencies are more favorable for pulsar studies because of several factors, such as intra-channel dispersion, scattering, the Galactic synchrotron background, and the ionosphere. Nonetheless, the very low-frequency range is interesting for pulsar studies because of pulse-profile evolution, which can become quite dramatic towards the lowest frequencies ([Hassall et al.(2012), Hassall et al. 2012]). Next, some phenomena are potentially not seen at higher frequencies (or become less pronounced there), in particular the anomalously bright individual pulses from five nearby pulsars including PSR B0809+74, reported by [Ulyanov et al.(2006)Ulyanov, Zakharenko, Konovalenko, Lecacheux, Rosolen, & Rucker, Ulyanov et al. (2006)] based on observations with the UTR-2 radio telescope. It is not clear whether these pulses are attributed to giant pulses or other single-pulse phenomena observed from other pulsars at higher frequencies. In these proceedings we report the first broadband low-frequency single-pulse study of the PSR B0809+74 using the LOFAR telescope.
2 Observations and Data processing
Observations were carried out using the Low Band Antennas (LBAs) in the LBA_OUTER array mode, where the 48 outermost dipoles in each LBA field are used. The instantaneous bandwidth of 46.875 MHz centered at a frequency of about 38 MHz was split into 240 subbands of 32 channels each and originally sampled every s.
Each observation was the coherent sum of the six “Superterp” stations, CS002–CS007. A detailed description of LOFAR’s pulsar observing modes and the online data reduction pipeline is given in [Stappers et al.(2011), Stappers et al. (2011)].
The data were converted from the LOFAR beam-formed format to the PSRFITS data format, corrected for the varying gain over the LBA band, and processed with DSPSR111http://dspsr.sourceforge.net to form both an integrated profile as well as single-pulse integrations. We used pdmp from PSRCHIVE222http://psrchive.sourceforge.net on a sample of strong pulses to determine the best DM for the time of our observations: 5.752 pc cm-3, with the DM jitter between the pulses being on the order of 0.002 pc cm-3. Many of the pulses showed very narrow-band structure in their spectra (see Figure 1, and details below). Using a 2D time-frequency search technique (Kondratiev et al., in prep) we next analysed the spectra of the complete sample of single pulses.
3 Results
The complete results of our study will be presented in Kondratiev et al. (in prep); here we briefly present a few highlights.
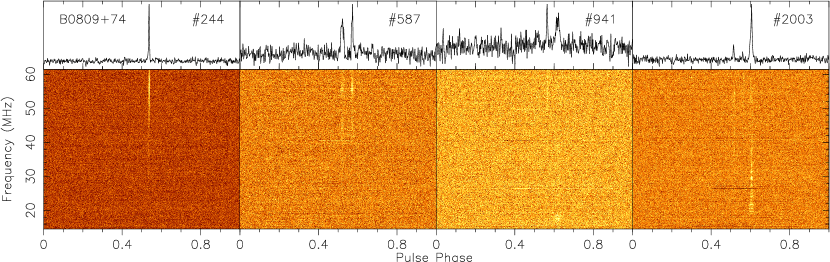
Figure 1 shows some typical pulses from the PSR B0809+74. In a given pulse, emission can occur in either the leading or trailing component; in both components at the same time; or sometimes even in three components corresponding to three subpulse-drift bands (see, e.g., pulse on Figure 1). The frequency structure of the pulse spectra can be also quite different. For instance, pulse shows a very narrow emission patch at 19 MHz in the second component, but the strongest emission from other two components occurs at the higher frequencies. Other examples (\egpulse ) show very broadband structure comprised of a number of smaller, individual patches with the maximum tending to be at lower frequencies ( MHz). On average the pulse spectra of the PSR B0809+74 are quite narrow and constitute only half of the band.
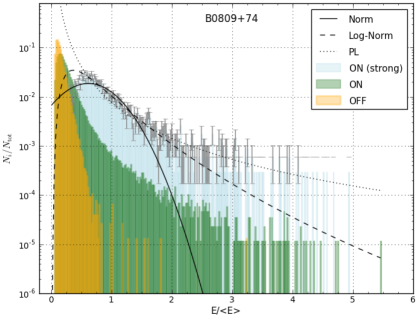
Figure 2 presents the pulse energy distribution for the pulsar B0809+74. The energy is calculated for the emission patches of every pulse component in the profile rather than in the entire band due to the presence of narrow-band pulses. Distributions are skewed towards higher energies due to the search technique as we searched for highest spectral flux density. It is clear that distributions are very similar at low energies with slightly less number of low-energy patches in the ON-pulse window. A few positive outliers for the OFF-pulse histogram indicates the presence of RFI but their number is insignificant. We also show the ON-pulse histogram for the strong patches with the spectral peak flux density . The roll-off of the histogram at low energies represents the selection bias for patches with peak spectral fluxes close to the detection threshold. The apparent larger fraction of stronger patches than -patches for the same energy, is caused by the fact that overall number of found patches is much larger for the than the threshold.
We fit a normal, log-normal and power-law distribution with low-energy cutoff. For our fits we excluded the very high energy tail of the distributions that have small statistics. The lognormal distribution provides the best goodness of fit. However, fitting the power-law distribution to the high-energy tail for energies provides better results. In general, the significance of the fit is not high enough for both pulsars to reject neither lognormal nor power-law distributions, and the better statistics is needed.
The narrow-band emission of the PSR B0809+74
The narrow-band spectra of some of the pulses from the PSR B0809+74 are quite unique and have never been observed at higher frequencies. We found it very unlikely that this narrow-band frequency pattern is caused by either ISM scintillations or ionosphere. For the former estimates of the decorrelation bandwidth give values of kHz, so all scintillations should be completely averaged out in our data. For the ionosphere the rate of change in its state is long (mins–hours) compared to time scales of about a second for the use case when narrow-band pulses follow each other.
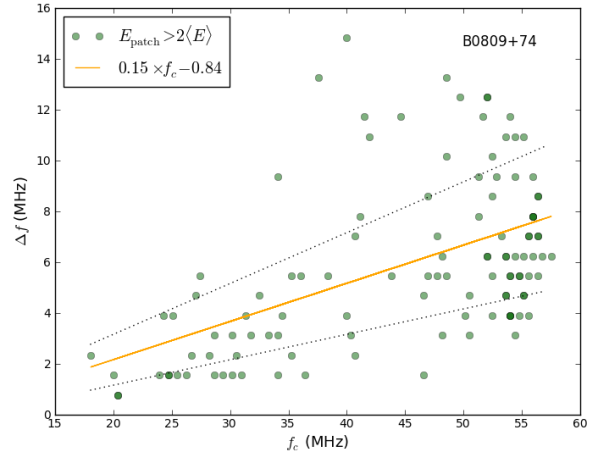
Figure 3 shows the dependence of the patch’s frequency width on their central frequency for the pulsar B0809+74 for the strong patches with the energy . Though data points are somewhat scattered, they qualitatively lie on the line, . This agrees very well with the prediction from the strong plasma turbulence (SPT) model ([Weatherall(1998), Weatherall 1998]). The SPT model of pulsar radio emission predicts narrow-band radiation with . If indeed true, this would also provide a direct link between giant pulses and anomalously intensive pulses observed at low frequencies.
4 Summary
We observe occasional bright narrow-band pulses from the PSR B0809+74 at frequencies 15–62 MHz. Their spectra can be as narrow as 1 MHz and tend to have a width of 3 MHz.
We identified pulse sequences from the pulsar B0809+74 where narrow patch of emission is drifting up in frequency from pulse to pulse. We see evidence for similar frequency drift for at least one other pulsar.
The origin of these narrow-band pulses is likely to be pulsar-intrinsic rather than due to propagation effects in ISM or ionosphere.
At the moment, the observed pulse properties of the PSR B0809+74 do not allow us to relate low-frequency bright narrow-band pulses to “spiky emission”, or to either giant pulses or regular emission.
For PSR B0809+74, the spectral width of the strong emission patches scales with increasing frequency as , qualitatively agreeing with the prediction of the SPT model. This supports the relation between bright narrow-band pulses at low frequencies and giant pulses.
Acknowledgements
LOFAR, the Low Frequency Array designed and constructed
by ASTRON, has facilities in several countries
that are owned by various parties (each with their own
funding sources), and that are collectively operated by
the International LOFAR Telescope (ILT) foundation under
a joint scientific policy.
References
- [Hassall et al.(2012)] Hassall, T. E., Stappers, B. W., Hessels, J. W. T., et al. 2012, A&A, 543, 66
- [Karuppusamy et al.(2011)Karuppusamy, Stappers, & Serylak] Karuppusamy, R., Stappers, B. W., & Serylak, M. 2011, A&A, 525, 55
- [Kuzmin(2006)] Kuzmin, A. D. 2006, Chinese Journal of Astronomy and Astrophysics Supplement, 6, 34
- [Stappers et al.(2011)] Stappers, B. W., Hessels, J. W. T., Alexov, A., et al. 2011, A&A, 530, 80
- [Weatherall(1998)] Weatherall, J. C. 1998, ApJ, 506, 341
- [Weltevrede et al.(2006)Weltevrede, Wright, Stappers, & Rankin] Weltevrede, P., Wright, G. A. E., Stappers, B. W., & Rankin, J. M. 2006, A&A, 458, 269
- [Ulyanov et al.(2006)Ulyanov, Zakharenko, Konovalenko, Lecacheux, Rosolen, & Rucker] Ulyanov, O. M., Zakharenko, V. V., Konovalenko, A. A., et al. 2006, Radiofizika and Radioastronomia, 11, 113