Computer vision tools for the non-invasive assessment of autism-related behavioral markers
Abstract
The early detection of developmental disorders is key to child outcome, allowing interventions to be initiated that promote development and improve prognosis. Research on autism spectrum disorder (ASD) suggests behavioral markers can be observed late in the first year of life. Many of these studies involved extensive frame-by-frame video observation and analysis of a child’s natural behavior. Although non-intrusive, these methods are extremely time-intensive and require a high level of observer training; thus, they are impractical for clinical and large population research purposes. Diagnostic measures for ASD are available for infants but are only accurate when used by specialists experienced in early diagnosis. This work is a first milestone in a long-term multidisciplinary project that aims at helping clinicians and general practitioners accomplish this early detection/measurement task automatically. We focus on providing computer vision tools to measure and identify ASD behavioral markers based on components of the Autism Observation Scale for Infants (AOSI). In particular, we develop algorithms to measure three critical AOSI activities that assess visual attention. We augment these AOSI activities with an additional test that analyzes asymmetrical patterns in unsupported gait. The first set of algorithms involves assessing head motion by tracking facial features, while the gait analysis relies on joint foreground segmentation and 2D body pose estimation in video. We show results that provide insightful knowledge to augment the clinician’s behavioral observations obtained from real in-clinic assessments.
keywords:
t2J. Hashemi, T. V. Spina, and M. Tepper equally contributed to this work. This work was partially done while M. Tepper, T. V. Spina, and G. Sapiro were with the University of Minnesota. Work partially supported by NSF Grants 1039741 & 1028076, CAPES (BEX 1018/11-6) and FAPESP (2011/01434-9) PhD scholarships from Brazil, and the U.S. Department of Defense.
1 Introduction
The analysis of children’s natural behavior is of key importance for the early detection of developmental disorders such as autism spectrum disorder (ASD). For example, several studies have revealed behaviors indicative of ASD in early home videos of children that were later diagnosed with ASD (see Zwaigenbaum et al., 2005, and references therein). These studies involved video-recording these environments and then analyzing the data a posteriori, using frame-by-frame viewing by an observer who typically trains for several weeks to achieve inter-rater reliability. Of course, hours and hours of labor are required, making such analyses impractical for clinical settings as well as for big data studies aiming at the discovery or improvement of behavioral markers While clinical tools for early diagnosis of ASD are available, they require administration and interpretation by specialists. Most families lack easy access to specialists in ASD; for example, the wait list for an evaluation at the leading ASD Clinic at the University of Minnesota is 6 months for children age 4 and under. There is a need for automatic and quantitative analysis tools that can be used by general practitioners in child development, and in general environments, to identify children at-risk for ASD and other developmental disorders.
As a first milestone in this long-term goal, this work focuses on providing computer vision tools for aiding in-clinic early diagnosis of ASD. Although much is unknown about the underlying causes of ASD, it is characterized by abnormalities in social interactions and communication and the presence of restricted, repetitive behaviors (Zwaigenbaum et al., 2005). Neuropathological studies indicate that ASD has its origins in abnormal brain development early in prenatal life (Rodier, 2002). Moreover, Zwaigenbaum et al. (2005) argue that many children with ASD exhibit several specific behavioral markers as early as in the first year of life. These markers appear, among others, in activities involving visual attention, often expressed as difficulties in disengagement and shifting of attention (Landry and Bryson, 2004). Once they begin walking, many children also show atypical motor patterns, such as asymmetric gait or toe walking (Esposito et al., 2011).
Despite this evidence, the average age of ASD diagnosis in the US is 5 years (Shattuck et al., 2009). Recently, much research and clinical trials have focused on early diagnosis to allow for early intensive intervention. Early intervention, initiated in preschool and sustained for at least 2 years, can substantially improve child outcomes (e.g., Dawson, 2008). Detecting ASD risk and starting interventions before the full set of behavioral symptoms appears has an even greater impact, preventing difficult behaviors and delayed developmental trajectories from taking hold (Dawson, 2008). Early diagnosis is achieved by following a comprehensive battery of developmental and behavioral tests and parent interviews, with the goal of detecting behavioral symptoms consistent with ASD. However, few specialized clinics exist to offer these assessments to the very young. In the US, the average age of diagnosis is 5 years (Shattuck et al., 2009). Improving availability of early diagnosis may be achieved by developing screening tools that can be used in regular pediatric clinics and school environments, thereby reaching a large population very early. Towards this end, in this work, we develop semi-automatic computer vision video analysis techniques to aid in early detection.
These tools aid the practitioner in the diagnosis task by providing accurate and objective measurements. In addition, and particularly for research, automatic analysis will permit to analyze effortlessly vast amounts of naturally recorded videos, opening the door for data mining towards the improvement of current assessment protocols and the discovery of new behavioral features. This project is being developed by a multidisciplinary group bringing together professionals from psychology, computer vision, and machine learning. As opposed to other research projects (Jones, Carr and Klin, 2008; Freeth, Foulsham and Chapman, 2010; Klin et al., 2002), where artificial setups are used, one of our main goals is to provide non-intrusive capturing systems that do not necessarily induce behavioral modification in the children. In other words, hardware must not constrain the testing environment: the clinician is free to adjust testing conditions as needed, and children are not asked to wear any type of sensors (Goodwin et al., 2011; Nazneen et al., 2010) or perform any non-natural tasks.
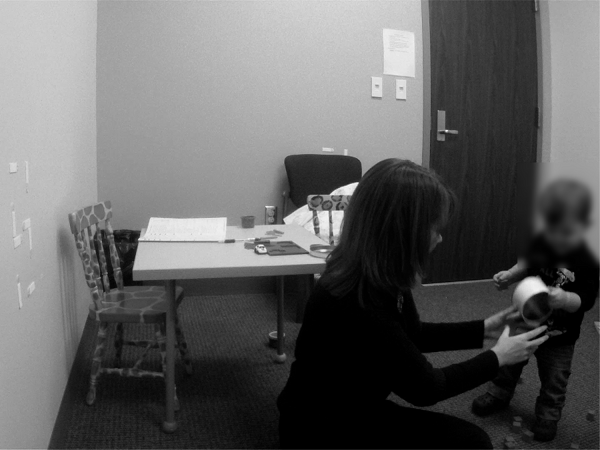
The results in this paper are from actual clinical recordings, in which the at-risk infant/toddler is tested by an experienced clinician following the Autism Observation Scale for Infants (AOSI) (Bryson et al., 2007) and a standard battery of developmental and ASD assessment measures (e.g., the Autism Diagnostic Observation Schedule – Toddler Module, ADOS-T, Luyster et al. (2009); and the Mullen Scales of Early Learning, MSEL, Mullen (1995)). The AOSI is a well-validated behavioral observation tool (Downing et al., 2011) for gathering information on early ASD risk signs, involving a set of semi-structured activities that provide an interactive context in which the examiner engages the infant in play, while conducting a set of systematic presses to elicit specific child behaviors. In our clinical setup, we use two low-cost GoPro Hero HD color cameras (with a resolution of 1080p at 30 fps), one placed on the clinician’s table (e.g., Figure 4) and one in a corner of the room (Figure 14); the displayed images are here downsampled, blurred, and/or partially blocked to preserve anonymity (processing was done on the original videos).111Approval for this study was obtained from the Institutional Review Board at the University of Minnesota.
We present video analysis tools for assessing four fundamental behavioral patterns: visual tracking, disengagement of attention, sharing interest, and atypical motor behavior (full session). The first three are part of the AOSI while the latter is holistically assessed throughout the whole session. The first three behaviors will be addessed by tracking simple facial features and estimating the head movements from them. The last behavior is treated using a joint body segmentation/pose estimation algorithm. The work with such specific population of infants and toddlers is unique in the computer vision community, making this a novel application for the psychology community. While the data is obtained from actual clinical assessments, the tasks pulled from the assessment are easy to administer and/or involve recordings of the child’s natural motor behavior, opening the door to broad behavioral studies, considering that the actual analysis is automatically done as here introduced.
In the following sections, we first describe our proposed automatic head pose tracking and body pose estimation methods. Afterwards, we detail our experimental validation that involved comparing our results with the clinician’s scores of the evaluation session as well as with non-expert manual scoring.
2 Assessing Visual Attention
Through the development of the AOSI, Zwaigenbaum et al. (2005) identified multiple behavioral markers for early detection of ASD. We focus on three of these, namely sharing interest, visual tracking, and disengagement of attention. The AOSI states specific guidelines on how to evaluate these behavioral markers from their corresponding activities.
The AOSI is divided into two main parts/categories: (1) a set of tabulated tasks which are designed for assessing specific behaviors; each task consists of a certain number of presses and the child’s responses receive a score; (2) a freeplay session, in which the clinician assesses the social behavior of the child while he is allowed to explore toys/objects. In this work we focus on computer vision tools for two AOSI tasks which belong to the first category.
Visual Tracking. It represents the “ability to visually follow a moving object laterally across the midline” (Bryson et al., 2007). To evaluate it, the following activity is performed: (1) a rattle or other noisy toy is used to engage the infant’s attention, (2) the rattle is positioned to one side of the infant, and (3) the rattle is then moved silently at eye level across the midline to the other side (note the relative simplicity of administering this and the additional tasks described next). The clinician evaluates how well the infant tracks the moving object. Infants with ASD usually exhibit discontinuous and/or a noticeably delayed tracking (Bryson et al., 2007).
Disengagement of Attention. It is characterized as the “ability to disengage and move eyes/attention from one of two competing visual stimuli” (Bryson et al., 2007). The corresponding activity consists of (1) shaking a noisy toy to one side of the infant until his/her attention is engaged, and (2) then shaking a second noisy toy on the opposite side, while continuing to shake the first object. The clinician assesses the child’s ability to shift attention away from one object when another is presented. A delayed response is an ASD risk sign (Landry and Bryson, 2004).
Throughout the freeplay session, the clinician extracts many behavioral measurements. The studied behaviors mainly include social interactions and thus their assessments also take place throughout the entire session. The less structured nature of these holistic assessments makes the development of automated tools harder. We will show, however, that the computer vision tools presented in this work can also be of use in a more complex scenario, such as the freeplay session. We then explore in detail one activity belonging to the freeplay session, the ball playing activity, as a first example of the potential uses of our approach.
Sharing Interest. It is described as the “ability to use eyes to reference and share interest in an object or event with another person” (Bryson et al. (2007), also known as ”Social interest and shared affect”). Although this behavior is evaluated throughout the AOSI, it can be specifically assessed from a ball playing activity, in which a ball is rolled on the table towards the infant after engaging his/her attention. After receiving the ball, the clinician analyzes the child’s ability to acknowledge the involvement of another person in the gameplay by looking to either the clinician or the caregiver. Infrequent or limited looking to faces is an early ASD risk sign (Zwaigenbaum et al., 2005; Bryson et al., 2007).
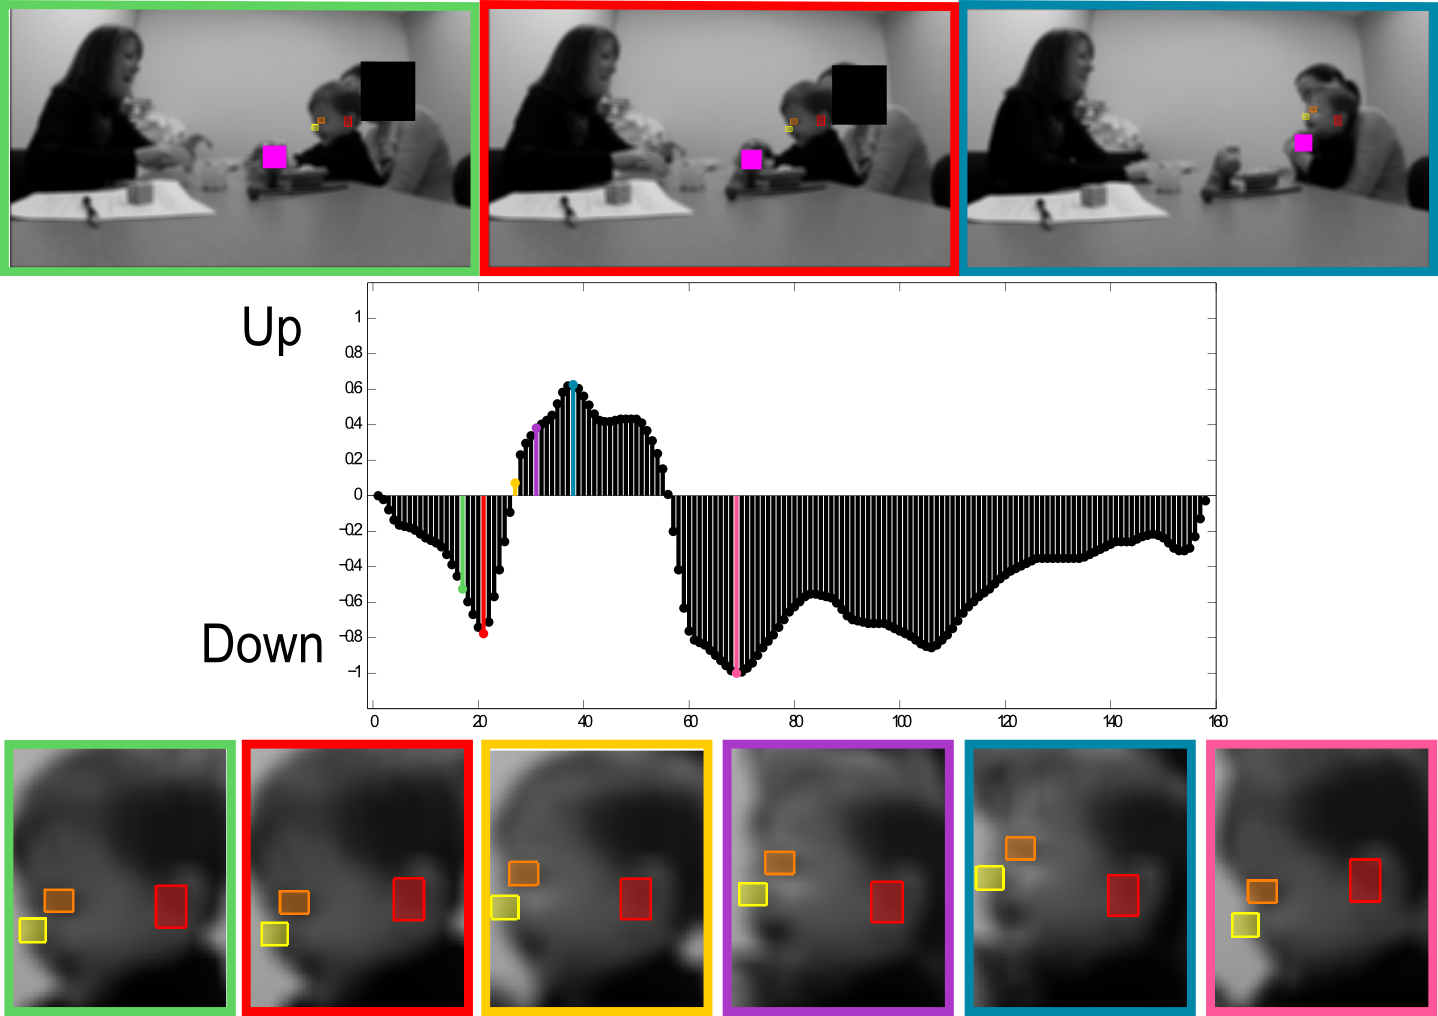
To analyze the child’s reactions in the Visual Attention activities, we automatically estimate the changes of two head pose motions: yaw (left and right motion) and pitch (up and down motion). For the Visual Tracking and Disengagement of Attention tasks, which involve lateral motions, we focus on the yaw motion; conversely, in the Sharing Interest task, we mainly focus on the pitch motion. We present computer vision algorithms for estimating these head motions. The algorithms track specific facial features: the left ear, left eye, and nose, see for example Figure 13. From their positions we compute an estimate of the participant’s yaw and pitch motions. The only user input in our algorithm is during initialization. On the first frame, the user places a bounding box around the left ear, left eye, and nose. This could potentially be avoided by standard feature detection techniques. We marked the playing objects by hand, although this also can be done automatically from prior knowledge of their visual and sound features (e.g., color or squeaking noise). Additional technical details are available in Appendix A.
3 Assessing Motor Patterns
Motor development has often been hypothesized as an early bio-marker of autism, and motor development disorders are considered some of the first signs which could precede social or linguistic abnormalities (Esposito et al., 2011, and references therein). Hence, it is important to find means of detecting and measuring these atypical motor patterns at a very early stage. In the AOSI protocol, atypical motor behavior is portrayed as the “presence of developmentally atypical gait, locomotion, motor mannerisms/postures or repetitive motor behaviours” (Bryson et al., 2007). There is no specific activity for assessing motor patterns; the clinician performs a holistic evaluation of the behaviors by visual inspection whenever they occur throughout the full session (Mullen, 1995; Bryson et al., 2007).
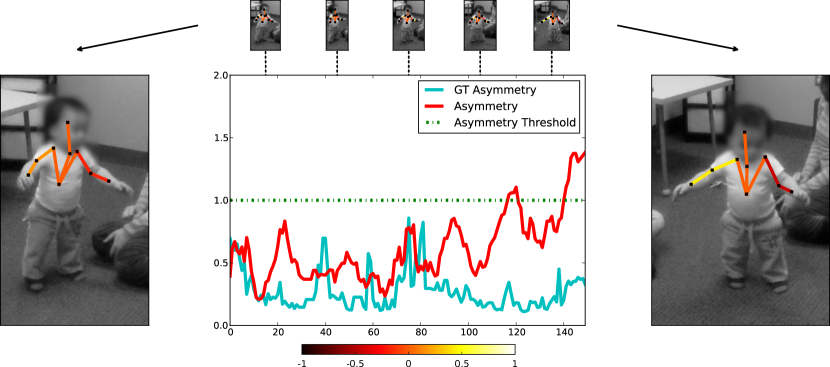
Children diagnosed with autism may present arm-and-hand flapping, toe walking, asymmetric gait when walking unsupportedly, among other atypical motor behaviors. In particular, Esposito et al. (2011) have found that diagnosed toddlers often presented asymmetric arm positions (Figure 5), according to the Eshkol-Wachman Movement Notation (EWMN) (Teitelbaum et al., 2004), in home videos filmed during the children’s early life period. EWMN is essentially a 2D stickman that is manually adjusted to the child’s body on each video frame and then analyzed. Our goal is to semi-automate this task by estimating the 2D body pose of the toddlers in video segments in which they are walking naturally.
Human body pose estimation is a complex and relatively well explored research topic in computer vision (Kohli et al., 2008; Ionescu, Li and Sminchisescu, 2011; Eichner et al., 2012), although it has been mostly restricted to adults, often in constrained scenarios, and not yet exploited in the application we address. We approach 2D human pose estimation task by using an extension of the Object Cloud Model (OCM) segmentation framework that works with articulated structures and video data.222The CSM extension was jointly developed with Alexandre X. Falcão Additional technical details are available in Appendix B. Once the skeleton is estimated for each video segment frame, we may extract angle measures to estimate arm asymmetry. In this work, we treat the arm asymmetry estimation as an application for the 2D body pose estimation, while hypothesizing that action recognition methods based on body pose and/or point trajectory estimation (Yao and Fei-Fei, 2012; Sivalingam et al., 2012) might be further applied to automatically detect and measure other important stereotypical motor behaviors (e.g., arms parallel to the ground pointing forward, arm-and-hand flapping).
3.1 Arm Asymmetry Measurement From 2D Body Pose
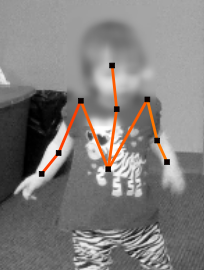
Following Esposito et al. (2011), a symmetrical position of the arms is a pose where similarity in relative position of corresponding limbs (the left and right arms) is shown with an accuracy of . This happens because EWMN defines a 3D coordinate system for each body joint that discretizes possible 2D skeleton poses by equally dividing the 3D space centered at the joints into intervals. Symmetry is violated, for example, when the toddler walks with one arm fully extended downwards alongside his/her body, while holding the other one horizontally, pointing forward (Figure 1).
 |
 |
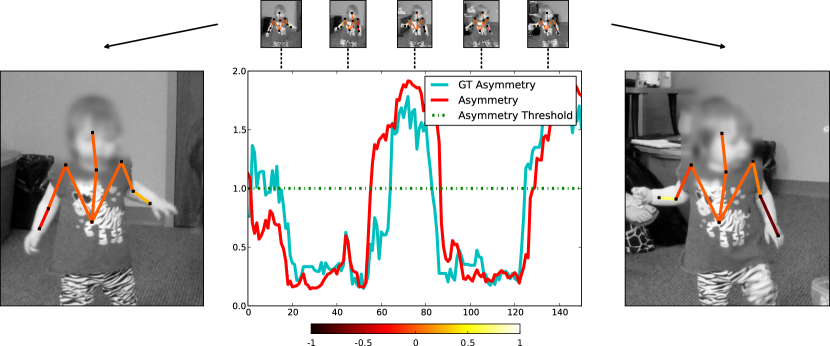
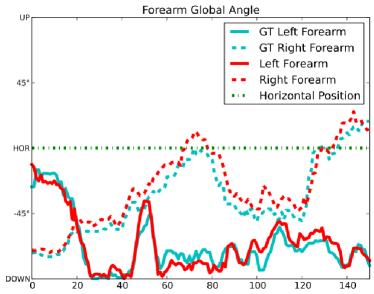
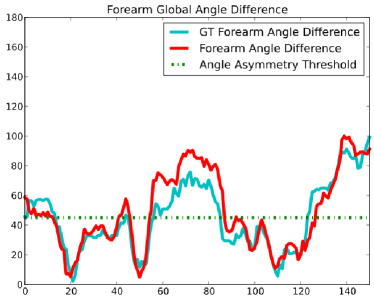
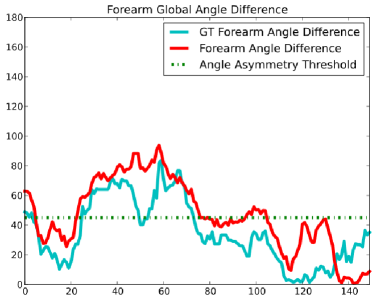
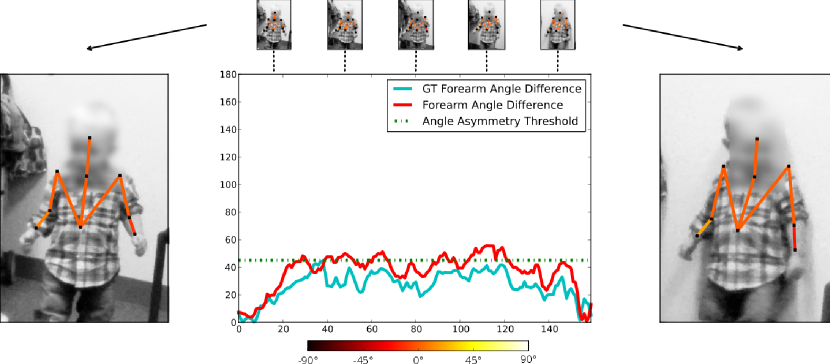
In our dataset, we have observed that using simple measures obtained directly from the automatically computed 2D skeleton is often insightful enough to detect most cases of arm asymmetry, thus avoiding the manual annotation required by EWMN according to the aforementioned coordinate system. For such asymmetry detection task, we define two scores: and . is a normalized asymmetry score (ranging between ) that takes into account both global and relative angles from the skeleton arm segments (forearm and upper arm). is based on the difference between the left and right forearms global angles with respect to the horizontal axis, ranging between (Hashemi et al., 2012). These measures indicate arm asymmetry when either or . Both and have different advantages and shortcomings that will be discussed in the experimental validation section. Nevertheless, is the standard measure we adopt for most of our results. See Appendix B.1 for more details on how to compute and .
4 Experimental Validation
This study involves 15 participants,333Participants and , and are the same. However, the videos we use for and are from their first evaluation sessions, while the ones we use for and are from their second sessions (when they reached walking age). including both males and females ranging in age from 5 to 18 months. All participants were classified as a baby sibling of someone with ASD, a premature infant, or as a participant showing developmental delays. Table 1 presents a summary of this information. Note that, the participants are not clinically diagnosed until they are months of age and only participant has presented conclusive signs of ASD.
| Part # | Age (months) | Gender | Risk Degree |
|---|---|---|---|
| 14 | F | Showing delays | |
| 11 | M | Premature infant | |
| 16 | M | ASD diagnosed | |
| 15 | M | Showing delays | |
| 16 | M | Baby sibling | |
| 12 | F | Premature infant | |
| 10 | F | Premature infant | |
| 9 | M | Premature infant | |
| 7 | M | Premature infant | |
| 6 | M | Baby sibling | |
| 9 | M | Premature infant | |
| 18 | M | Showing delays | |
| 5 | F | Baby sibling | |
| 8 | M | Premature infant | |
| 9 | F | Premature infant |
4.1 Specific AOSI tasks
During the AOSI assessment, the clinician performs three trials for the Disengagement of Attention task and two trials for the Visual Tracking task, per participant. Every trial receives an AOSI-tabulated score, according to the following guidelines:
-
•
Disengagement of Attention. A trial is considered “passed” if the child looks to the second object in less than 1s, considered “delayed” if the child looks after a 1-2s delay, and considered “stuck” if the child looks after more than 2s.
-
•
Visual Tracking. During this task, the AOSI focuses on how smooth the participant is able to track the object. Depending on how continuously and smoothly the partipant is able to track the object, the trial is considered “passed,” “delayed or interrupted,” or “partial or no tracking.”
The clinician makes a “live” judgment about these time frames or may look at videos of this task if available. Finally, an overall score for each task is computed by merging the individual ones. We followed the protocol of comparing the assessments done by: (1) an expert psychologist in autistic children, (2) a child/adolescent psychiatrist, (3) two psychology students with no particular autism training, and (4) the results of our computational tools. This setup allows to contrast the automatic method’s findings with human assessments across the full range of expertise.
| Part. | First Trial Score | Second Trial Score | Third Trial Score | ||||||
| Clin. | Automatic | Clin. | Automatic | Clin. | Automatic | ||||
| Score | Delay (s) | Score | Delay (s) | Score | Delay (s) | ||||
| \cellcolor scoreAcolor Pass | \cellcolor scoreAcolor Pass | \cellcolor scoreAcolor Pass | \cellcolor scoreAcolor Pass | \cellcolor scoreAcolor Pass | \cellcolor scoreAcolor Pass | ||||
| \cellcolor scoreAcolor Pass | \cellcolor scoreAcolor Pass | - | - | - | - | - | - | ||
| \cellcolor scoreAcolor Pass | \cellcolor scoreAcolor Pass | \cellcolor scoreAcolor Pass | \cellcolor scoreAcolor Pass | \cellcolor scoreAcolor Pass | \cellcolor scoreAcolor Pass | ||||
| \cellcolor scoreAcolor Pass | \cellcolor scoreAcolor Pass | \cellcolor scoreAcolor Pass | \cellcolor scoreAcolor Pass | \cellcolor scoreAcolor Pass | \cellcolor scoreAcolor Pass | ||||
| - | - | - | \cellcolor scoreAcolor Pass | \cellcolor scoreAcolor Pass | - | - | - | ||
| - | - | - | - | - | - | \cellcolor scoreBcolor Del | \cellcolor scoreBcolor Del | ||
| \cellcolor scoreAcolor Pass | \cellcolor scoreAcolor Pass | \cellcolor scoreAcolor Pass | \cellcolor scoreAcolor Pass | \cellcolor scoreAcolor Pass | \cellcolor scoreAcolor Pass | ||||
| \cellcolor scoreAcolor Pass | \cellcolor scoreAcolor Pass | \cellcolor scoreAcolor Pass | \cellcolor scoreAcolor Pass | \cellcolor scoreAcolor Pass | \cellcolor scoreAcolor Pass | ||||
| \cellcolor scoreAcolor Pass | \cellcolor scoreAcolor Pass | \cellcolor scoreAcolor Pass | \cellcolor scoreAcolor Pass | \cellcolor scoreAcolor Pass | \cellcolor scoreAcolor Pass | ||||
| N/A | \cellcolor scoreBcolor Del | - | - | - | - | - | - | ||
| \cellcolor scoreBcolor Del | \cellcolor scoreAcolor Pass | \cellcolor scoreBcolor Del | \cellcolor scoreBcolor Del | \cellcolor scoreAcolor Pass | \cellcolor scoreAcolor Pass | ||||
| \cellcolor scoreAcolor Pass | \cellcolor scoreAcolor Pass | \cellcolor scoreAcolor Pass | \cellcolor scoreBcolor Del | \cellcolor scoreAcolor Pass | \cellcolor scoreAcolor Pass | ||||
Table 2 summarizes the results of our method and the clinical assessment for the Disengagement of Attention task. After marking when the second object is presented, our method is able to automatically determine the delay from when the participant disengages from the first object to the second. We present this delay in terms of how many seconds/frames it takes for the participant to disengage (note that we are recording the video at 30 frames per second). We incorporate a of a second margin for each delay to accommodate human error of making a live judgment. Out of the 24 trials that the clinician assigned a “pass” score to, our method agreed on 23 of them and scored a “delayed” for the other trial. And out of the 3 trials the clinican scored “delayed” our method agreed on 2 trials, scoring one as a “pass.” Although our method obtained one false positive by scoring one trial “delayed” which the clinician scored as “pass” and missed one “delayed” trial, we believe one of the greatest impacts of our method is that it gives the clinician quantifiable data for this task and may allow to readjust the rigid scoring intervals provided in the AOSI. With a study on a larger population, new time intervals (and their variability) for scoring may be discovered, and these false positives could be analyzed not as a strict “pass” or “delayed” but as something in between.
| Part. | First Trial Score | Second Trial Score | ||
|---|---|---|---|---|
| Clinician | Automatic | Clinician | Automatic | |
| \cellcolorscoreAcolor Pass | \cellcolorscoreAcolor Pass | \cellcolorscoreAcolor Pass | \cellcolorscoreCcolor Int | |
| \cellcolorscoreBcolor Del | \cellcolorscoreAcolor Pass | \cellcolorscoreAcolor Pass | \cellcolorscoreAcolor Pass | |
| \cellcolorscoreAcolor Pass | \cellcolorscoreAcolor Pass | \cellcolorscoreAcolor Pass | \cellcolorscoreAcolor Pass | |
| - | - | \cellcolorscoreCcolor Int | \cellcolorscoreCcolor Int | |
| \cellcolorscoreAcolor Pass | \cellcolorscoreAcolor Pass | \cellcolorscoreAcolor Pass | \cellcolorscoreAcolor Pass | |
| \cellcolorscoreAcolor Pass | \cellcolorscoreAcolor Pass | \cellcolorscoreAcolor Pass | \cellcolorscoreAcolor Pass | |
| \cellcolorscoreAcolor Pass | \cellcolorscoreAcolor Pass | \cellcolorscoreCcolor Int | \cellcolorscoreCcolor Int | |
| \cellcolorscoreAcolor Pass | \cellcolorscoreAcolor Pass | \cellcolorscoreCcolor Int | \cellcolorscoreCcolor Int | |
| \cellcolorscoreAcolor Pass | \cellcolorscoreAcolor Pass | \cellcolorscoreAcolor Pass | \cellcolorscoreAcolor Pass | |
| \cellcolorscoreCcolor Int | \cellcolorscoreCcolor Int | \cellcolorscoreCcolor Int | \cellcolorscoreCcolor Int | |
| \cellcolorscoreDcolor Prt | \cellcolorscoreCcolor Int | \cellcolorscoreDcolor Prt | \cellcolorscoreDcolor Prt | |
| \cellcolorscoreAcolor Pass | \cellcolorscoreAcolor Pass | - | - | |
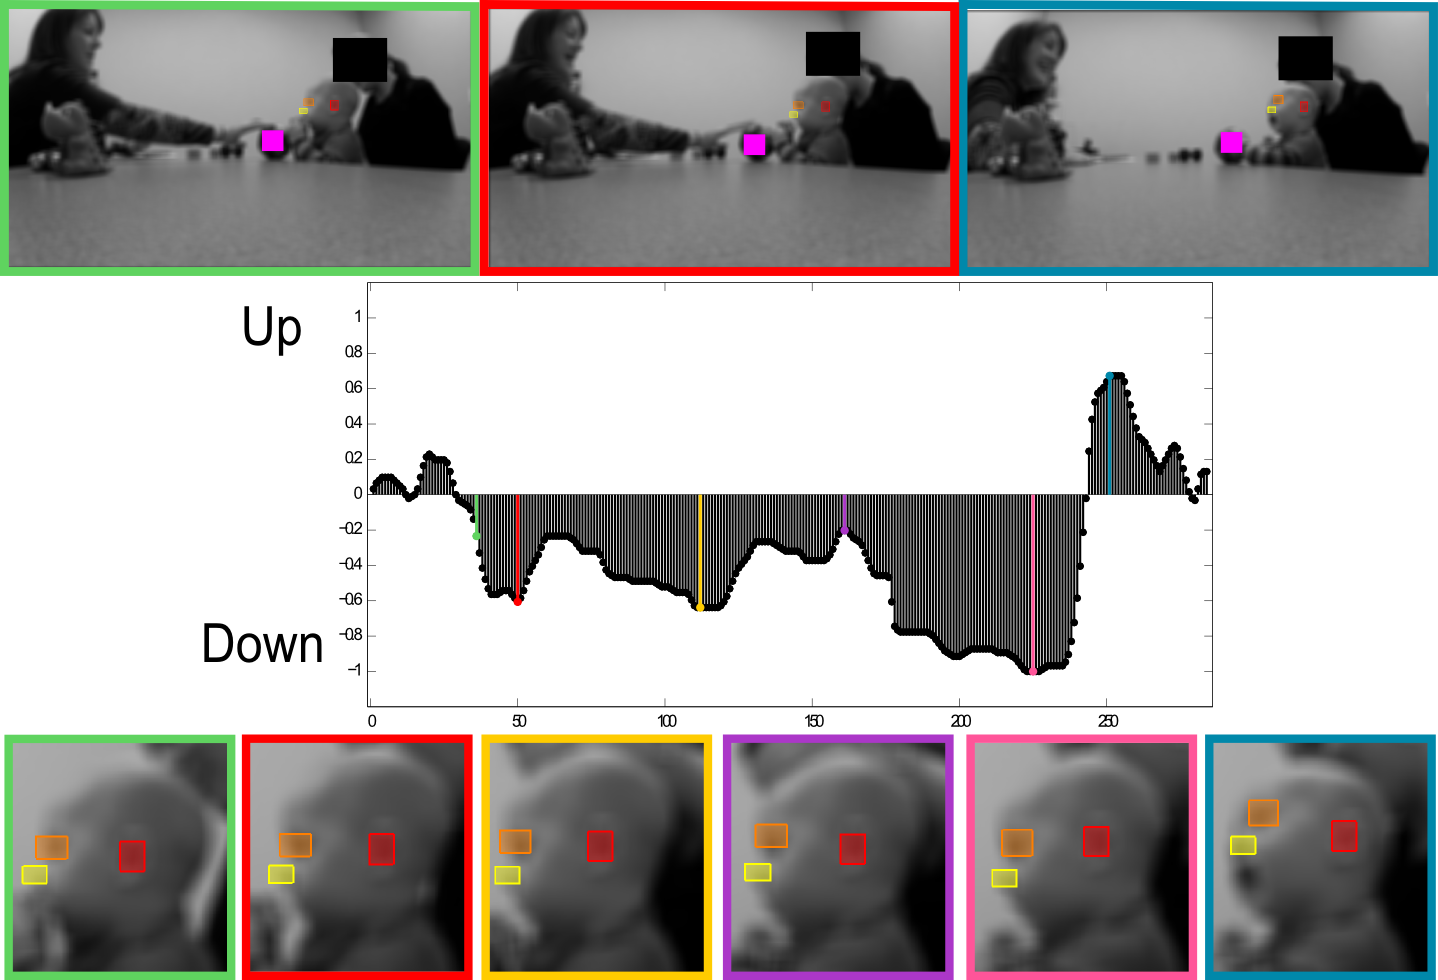
Table 3 summarizes the results of our method and the clinical assessment for the Visual Tracking task. The simple output of our method allows to easily assess each trial by visual inspection and score the trials as either “pass,” “interrupted,” “partial,” or “no tracking.” Examples of our method’s measurements for a “pass,” “interrupted,” and “partial” tracking scores are explained later in this section, see Figure 3 for a few examples. Our results strongly correlate with that of the clinician. Out of the 14 trials that the clinican assessed as “pass,” our method agreed with 13 of them and scored an “interrupted” for 1 of the trials. For all the 4 trials the clinician assessed as “interrupted,” our automatic method was in agreement. The clinician scored two trials as “partial,” our method scored one of them as “partial” and the other as “interrupted.” Lastly, the clinician scored one trial as “delayed;” however, based on our non-intrusive camera placement (as selected by the practitioner), we are not able to continuously extract the object’s location accurately enough to assign “delayed” scores. These results not only show a strong correlation between the assessment of the clinican and our method for the Visual Tracking task, but also provide the clinician and future researchers accurate quantitative data.
The child/adolescent psychiatrist and two psychology students assigned their scores by following the AOSI guidelines, without prior training, while watching the videos used by the automatic method. Their results (tables 4 and 5) not only illustrate the human training that needs to be done for these visual attention tasks but also the novelty of our method and its quantitative results. Out of the 27 Visual Disengagement trials, the two psychology students agreed with the clinician on 13 and 16 of the trials respectively, while the child/adolescent psychiatrist agreed on 22 trials. Similarly for the 22 Visual Tracking trials, the two psychology students agreed with the clinician on 13 and 14 of the trials respectively, while the child/adolescent psychiatrist agreed on 16 trials. Table 6 provides a summary of these results. The benefits of the results obtained with our automatic method for head pose estimation are threefold. First, it provides accurate quantitative measurements for the AOSI tasks, improving the shareability of clinical records (while not compromising anonymity). Second, it can also prove beneficial in the discovery of new behavioral patterns by easily collecting large amounts of data and using data mining on them. Third, it increases the granularity of the analysis by providing results at a finer scale. In the following, we provide in-depth analysis of some trials, which are relevant to show the validity of this argumentation.
| Part. | First Trial Score | Second Trial Score | Third Trial Score | |||||||||
|---|---|---|---|---|---|---|---|---|---|---|---|---|
| Clin. | Psy. | St. 1 | St. 2 | Clin. | Psy. | St. 1 | St. 2 | Clin. | Psy. | St. 1 | St. 2 | |
| \cellcolor scoreAcolor Pass | \cellcolor scoreAcolor Pass | \cellcolor scoreBcolor Del | \cellcolor scoreBcolor Del | \cellcolor scoreAcolor Pass | \cellcolor scoreAcolor Pass | \cellcolor scoreAcolor Pass | \cellcolor scoreAcolor Pass | \cellcolor scoreAcolor Pass | \cellcolor scoreAcolor Pass | \cellcolor scoreAcolor Pass | \cellcolor scoreAcolor Pass | |
| \cellcolor scoreAcolor Pass | \cellcolor scoreAcolor Pass | \cellcolor scoreBcolor Del | \cellcolor scoreBcolor Del | - | - | - | - | - | - | - | - | |
| \cellcolor scoreAcolor Pass | \cellcolor scoreAcolor Pass | \cellcolor scoreAcolor Pass | \cellcolor scoreAcolor Pass | \cellcolor scoreAcolor Pass | \cellcolor scoreAcolor Pass | \cellcolor scoreAcolor Pass | \cellcolor scoreAcolor Pass | \cellcolor scoreAcolor Pass | \cellcolor scoreAcolor Pass | \cellcolor scoreAcolor Pass | \cellcolor scoreAcolor Pass | |
| \cellcolor scoreAcolor Pass | \cellcolor scoreAcolor Pass | \cellcolor scoreBcolor Del | \cellcolor scoreBcolor Del | \cellcolor scoreAcolor Pass | \cellcolor scoreBcolor Del | \cellcolor scoreBcolor Del | \cellcolor scoreBcolor Del | \cellcolor scoreAcolor Pass | \cellcolor scoreAcolor Pass | \cellcolor scoreBcolor Del | \cellcolor scoreBcolor Del | |
| - | - | - | - | \cellcolor scoreAcolor Pass | \cellcolor scoreAcolor Pass | \cellcolor scoreBcolor Del | \cellcolor scoreBcolor Del | - | - | - | - | |
| - | - | - | - | - | - | - | - | \cellcolor scoreBcolor Del | \cellcolor scoreAcolor Pass | \cellcolor scoreBcolor Del | \cellcolor scoreCcolor Stck | |
| \cellcolor scoreAcolor Pass | \cellcolor scoreBcolor Del | \cellcolor scoreBcolor Del | \cellcolor scoreBcolor Del | \cellcolor scoreAcolor Pass | \cellcolor scoreAcolor Pass | \cellcolor scoreAcolor Pass | \cellcolor scoreAcolor Pass | \cellcolor scoreAcolor Pass | \cellcolor scoreBcolor Del | \cellcolor scoreBcolor Del | \cellcolor scoreBcolor Del | |
| \cellcolor scoreAcolor Pass | \cellcolor scoreAcolor Pass | \cellcolor scoreBcolor Del | \cellcolor scoreAcolor Pass | \cellcolor scoreAcolor Pass | \cellcolor scoreAcolor Pass | \cellcolor scoreAcolor Pass | \cellcolor scoreAcolor Pass | \cellcolor scoreAcolor Pass | \cellcolor scoreAcolor Pass | \cellcolor scoreAcolor Pass | \cellcolor scoreAcolor Pass | |
| \cellcolor scoreAcolor Pass | \cellcolor scoreAcolor Pass | \cellcolor scoreAcolor Pass | \cellcolor scoreAcolor Pass | \cellcolor scoreAcolor Pass | \cellcolor scoreAcolor Pass | \cellcolor scoreBcolor Del | \cellcolor scoreBcolor Del | \cellcolor scoreAcolor Pass | \cellcolor scoreAcolor Pass | \cellcolor scoreAcolor Pass | \cellcolor scoreAcolor Pass | |
| \cellcolor scoreBcolor Del | \cellcolor scoreBcolor Del | \cellcolor scoreBcolor Del | \cellcolor scoreBcolor Del | \cellcolor scoreBcolor Del | \cellcolor scoreBcolor Del | \cellcolor scoreCcolor Stck | \cellcolor scoreBcolor Del | \cellcolor scoreAcolor Pass | \cellcolor scoreAcolor Pass | \cellcolor scoreBcolor Del | \cellcolor scoreAcolor Pass | |
| \cellcolor scoreAcolor Pass | \cellcolor scoreAcolor Pass | \cellcolor scoreBcolor Del | \cellcolor scoreAcolor Pass | \cellcolor scoreAcolor Pass | \cellcolor scoreAcolor Pass | \cellcolor scoreAcolor Pass | \cellcolor scoreAcolor Pass | \cellcolor scoreAcolor Pass | \cellcolor scoreBcolor Del | \cellcolor scoreBcolor Del | \cellcolor scoreBcolor Del | |
| Part. | First Trial Score | Second Trial Score | ||||||
|---|---|---|---|---|---|---|---|---|
| Clin. | Psy. | St. 1 | St. 2 | Clin. | Psy. | St. 2 | St. 3 | |
| \cellcolor scoreAcolor Pass | \cellcolor scoreAcolor Pass | \cellcolor scoreAcolor Pass | \cellcolor scoreAcolor Pass | \cellcolor scoreAcolor Pass | \cellcolor scoreCcolor Int | \cellcolor scoreCcolor Int | \cellcolor scoreCcolor Int | |
| \cellcolor scoreBcolor Del | \cellcolor scoreAcolor Pass | \cellcolor scoreAcolor Pass | \cellcolor scoreAcolor Pass | \cellcolor scoreAcolor Pass | \cellcolor scoreAcolor Pass | \cellcolor scoreAcolor Pass | \cellcolor scoreAcolor Pass | |
| \cellcolor scoreAcolor Pass | \cellcolor scoreAcolor Pass | \cellcolor scoreAcolor Pass | \cellcolor scoreAcolor Pass | \cellcolor scoreAcolor Pass | \cellcolor scoreAcolor Pass | \cellcolor scoreAcolor Pass | \cellcolor scoreAcolor Pass | |
| - | - | - | - | \cellcolor scoreCcolor Int | \cellcolor scoreCcolor Int | \cellcolor scoreDcolor Prt | \cellcolor scoreDcolor Prt | |
| \cellcolor scoreAcolor Pass | \cellcolor scoreAcolor Pass | \cellcolor scoreBcolor Del | \cellcolor scoreAcolor Pass | \cellcolor scoreAcolor Pass | \cellcolor scoreAcolor Pass | \cellcolor scoreAcolor Pass | \cellcolor scoreAcolor Pass | |
| \cellcolor scoreAcolor Pass | \cellcolor scoreAcolor Pass | \cellcolor scoreBcolor Del | \cellcolor scoreAcolor Pass | \cellcolor scoreAcolor Pass | \cellcolor scoreAcolor Pass | \cellcolor scoreAcolor Pass | \cellcolor scoreAcolor Pass | |
| \cellcolor scoreAcolor Pass | \cellcolor scoreAcolor Pass | \cellcolor scoreAcolor Pass | \cellcolor scoreAcolor Pass | \cellcolor scoreCcolor Int | \cellcolor scoreCcolor Int | \cellcolor scoreDcolor Prt | \cellcolor scoreDcolor Prt | |
| \cellcolor scoreAcolor Pass | \cellcolor scoreAcolor Pass | \cellcolor scoreAcolor Pass | \cellcolor scoreAcolor Pass | \cellcolor scoreCcolor Int | \cellcolor scoreCcolor Int | \cellcolor scoreDcolor Prt | \cellcolor scoreDcolor Prt | |
| \cellcolor scoreAcolor Pass | \cellcolor scoreAcolor Pass | \cellcolor scoreAcolor Pass | \cellcolor scoreAcolor Pass | \cellcolor scoreAcolor Pass | \cellcolor scoreAcolor Pass | \cellcolor scoreAcolor Pass | \cellcolor scoreAcolor Pass | |
| \cellcolor scoreCcolor Int | \cellcolor scoreAcolor Pass | \cellcolor scoreCcolor Int | \cellcolor scoreAcolor Pass | \cellcolor scoreCcolor Int | \cellcolor scoreAcolor Pass | \cellcolor scoreAcolor Pass | \cellcolor scoreAcolor Pass | |
| \cellcolor scoreDcolor Prt | \cellcolor scoreAcolor Pass | \cellcolor scoreCcolor Int | \cellcolor scoreAcolor Pass | \cellcolor scoreDcolor Prt | \cellcolor scoreBcolor Del | \cellcolor scoreDcolor Prt | \cellcolor scoreDcolor Prt | |
| \cellcolor scoreAcolor Pass | \cellcolor scoreAcolor Pass | \cellcolor scoreAcolor Pass | \cellcolor scoreAcolor Pass | - | - | - | - | |
| Task | Trials | Automatic | Psychiatrist | Student 1 | Student 2 |
|---|---|---|---|---|---|
| Disengagment | 27 | 25 | 22 | 13 | 16 |
| Tracking | 22 | 19 | 16 | 13 | 14 |
| Total | 49 | 44 | 38 | 26 | 30 |
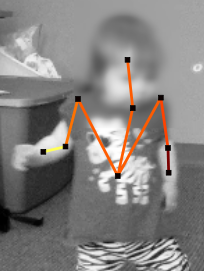
Figure 2 displays three important types of results for the Disengagement of Attention task. In the first example, the participant is able to disengage from the first object and look at the second within 0.7s (21 frames) of the second object being presented. This would be scored as “passed” on the AOSI test. The participant in the second example disengages to the second object within 1.3s (40 frames), which would be scored as “delayed” on the AOSI test. The third example provides an interesting pattern in the participant’s head movement. Not only does it take the third participant over 1s to look at the second object (which is “delayed” on the AOSI), but the participant displays piece-wise constant lateral head movements compared to the other two examples (which presented a much smoother motion), a pattern virtually impossible to detect with the naked eye. Again, such automatic and quantitative measurements are critical for aiding current and future diagnosis.
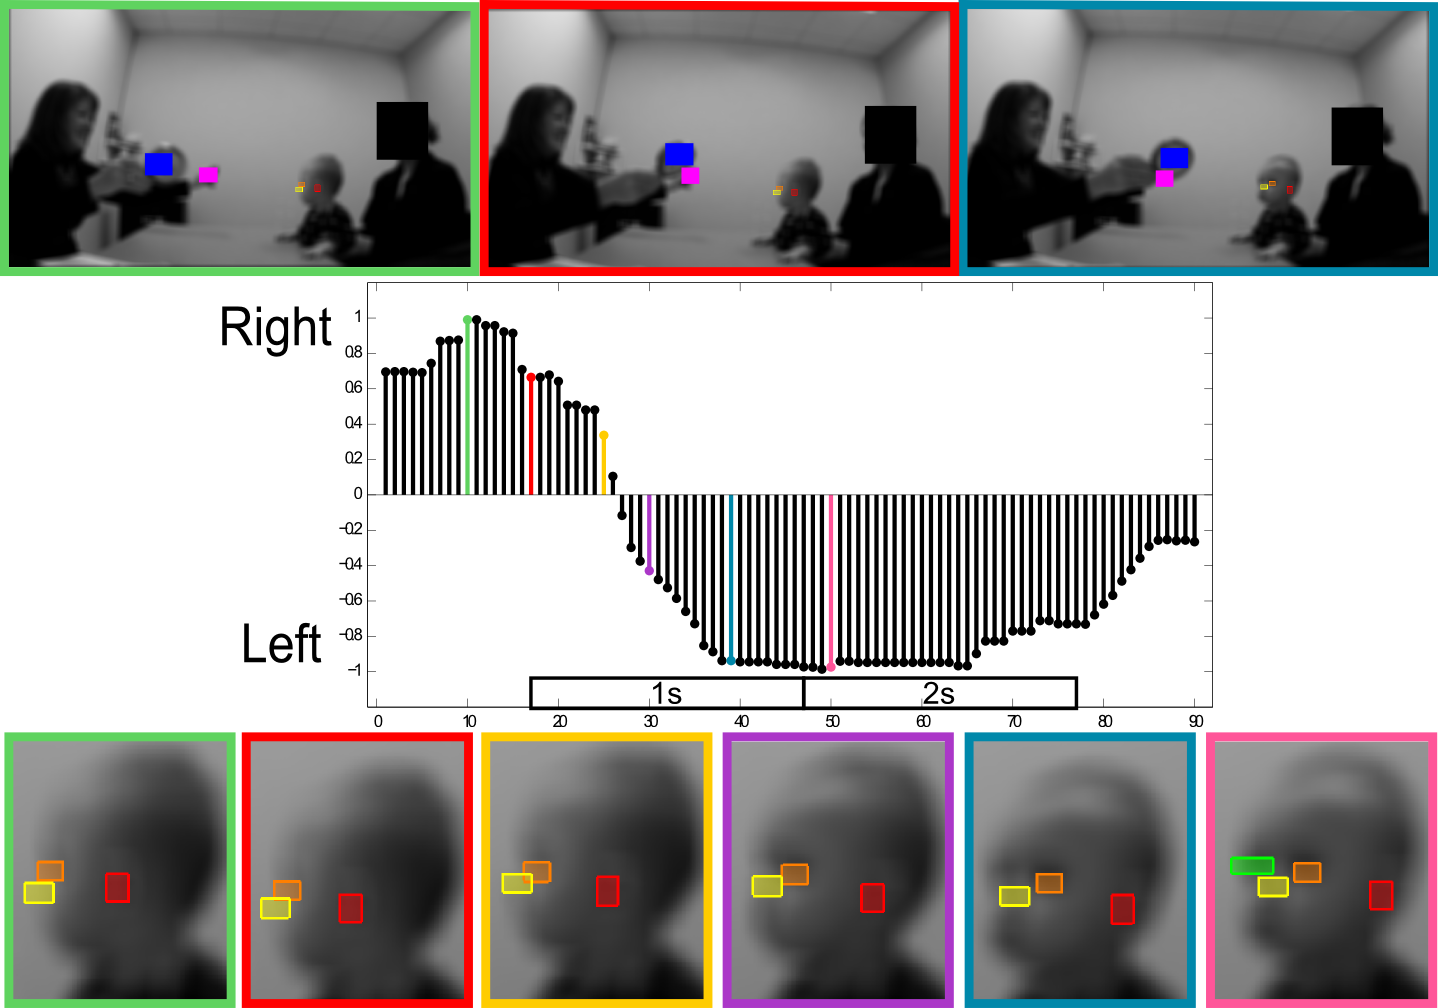
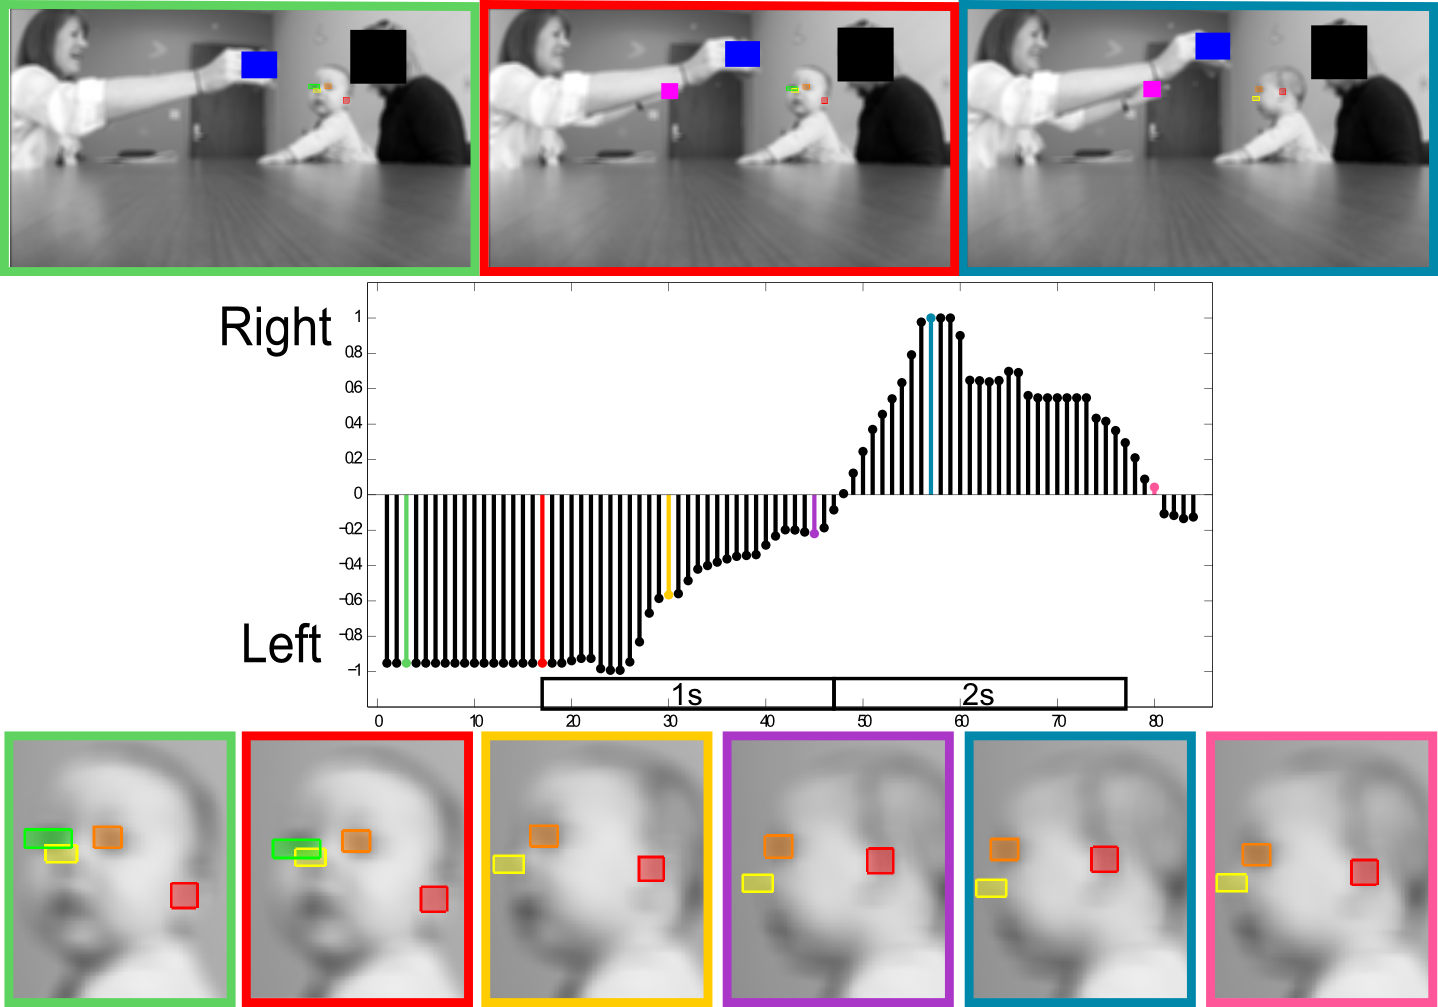
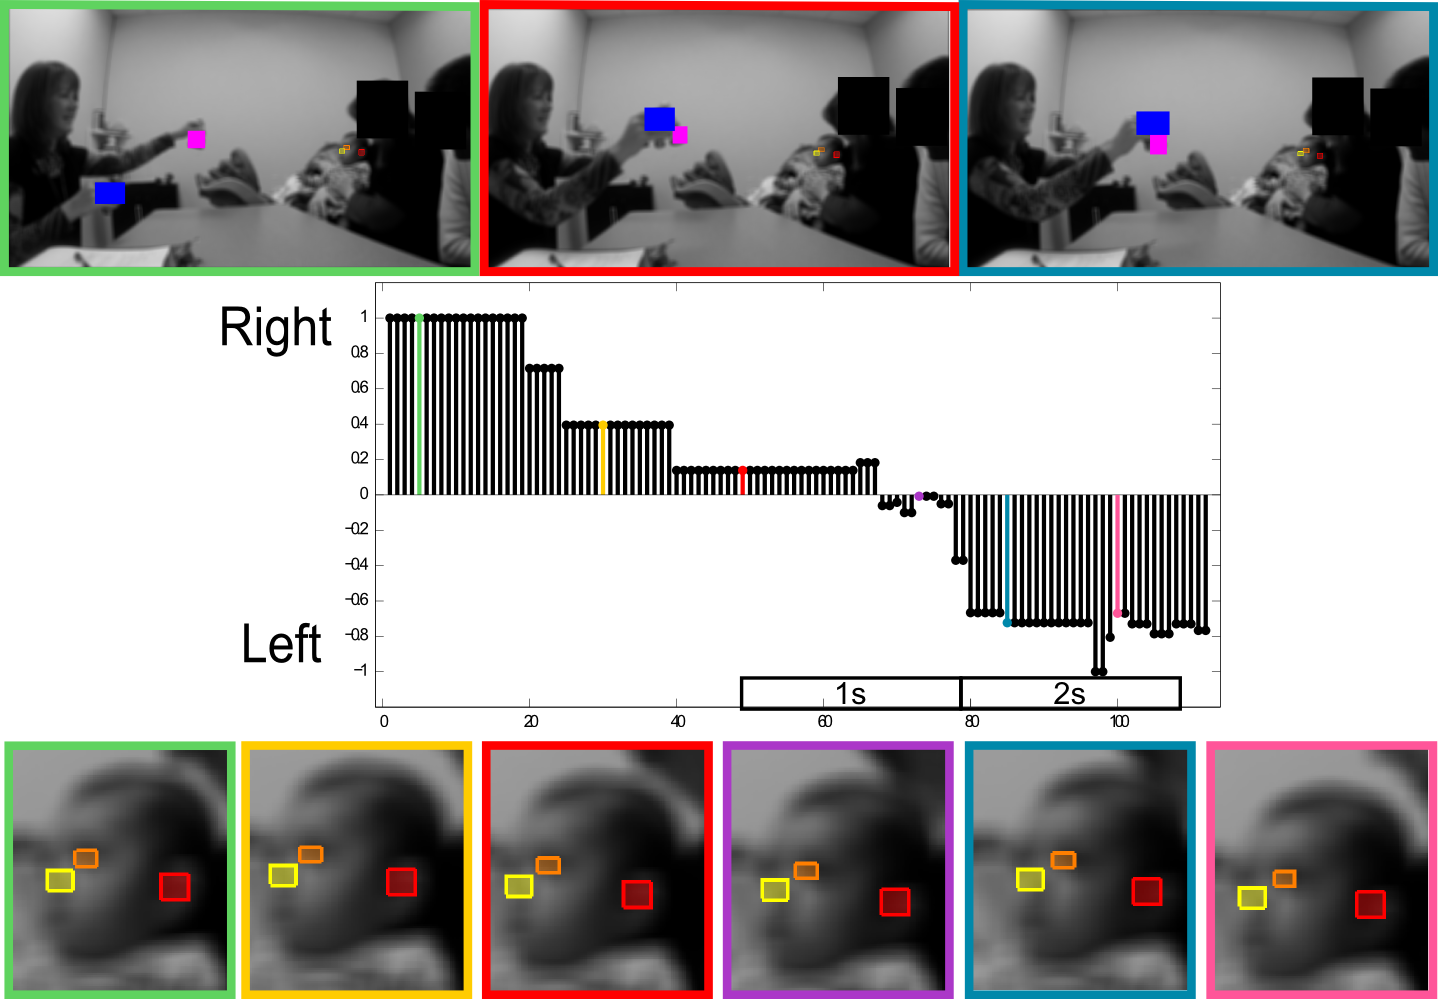
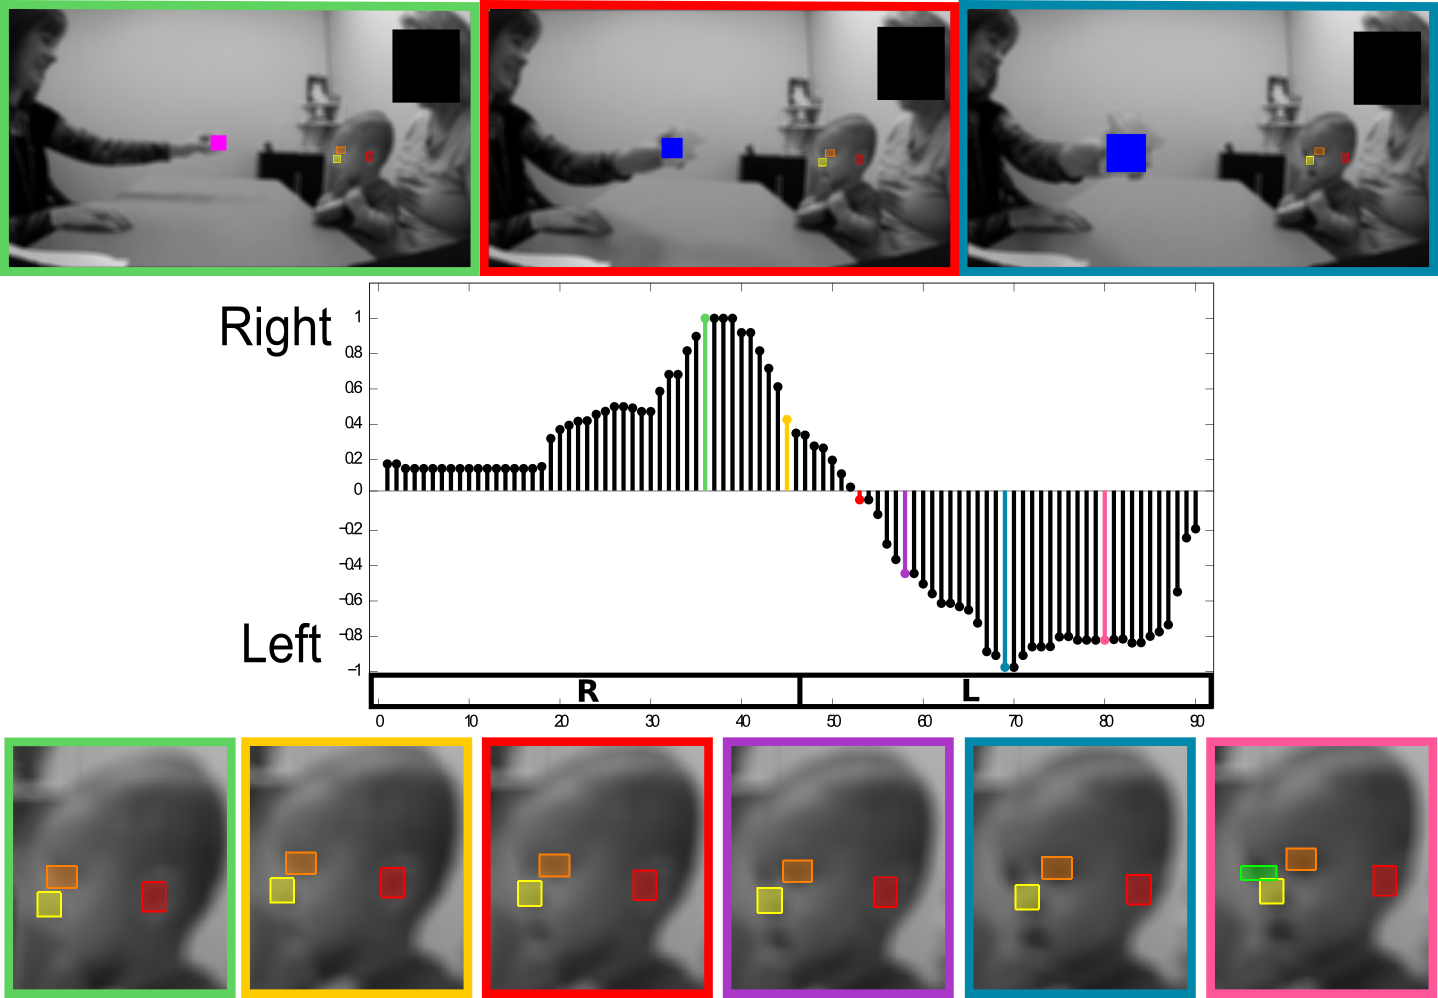
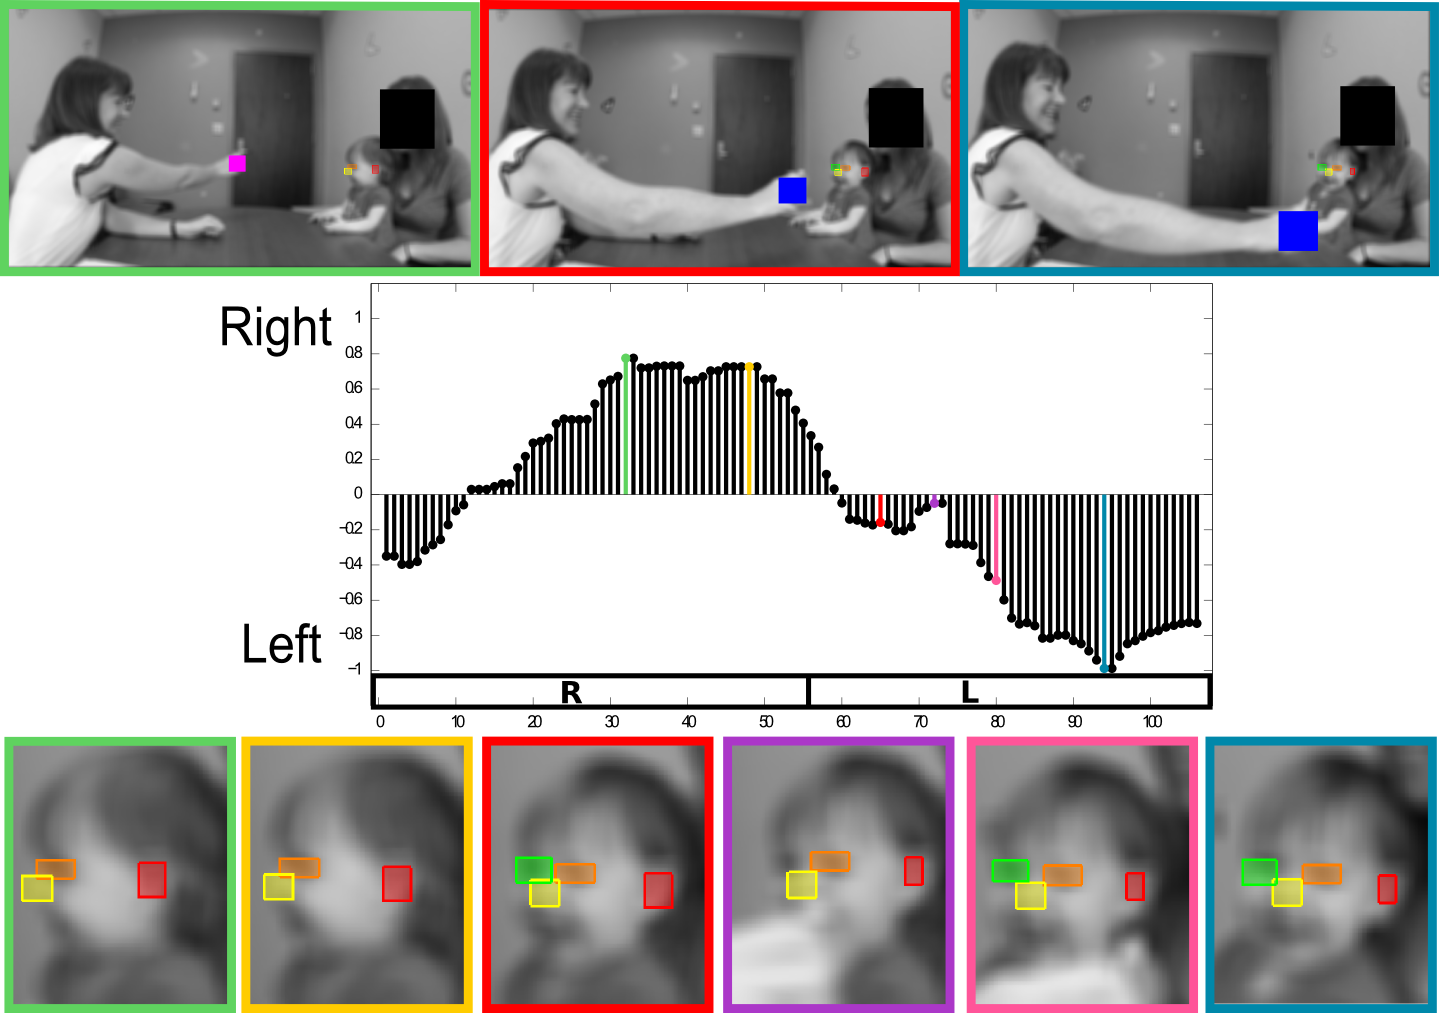
Figure 3 shows three important types of our results for the Visual Tracking task. Not only does our method provide quantitative measurements for the Visual Tracking task, it also records the delay from when the object is at the second extreme side to when the participant’s head is facing this side. The first example demonstrates a participant that received a “passed” on the AOSI’s Visual Tracking task, since the participant was able to smoothly track the object with minimal delay as the object approached the participant’s right. In the second example, the participant exhibited “interrupted” tracking motion. The participant’s tracking of the object was interrupted as the object moved across the clinician’s face. Instead of tracking the object as it moved across the clinician’s face, the participant stopped tracking the object and looked at the clinician for 0.46s (14 frames) before continuing to track the object as it moved to the participant’s left. Another aspect of our method is that it provides accurate and quantitative measurements for the participant’s head tracking, thus one is able to automatically determine the delays between when the participant looks at the object or how long the participant stops his/her tracking. In the third example, the participant displays a “partial” tracking score on the AOSI. As the object crosses the clinician’s face, the participant completely stops tracking the object and instead looks straight at the clinician.
4.2 The Ball Playing Activity During the Freeplay Session
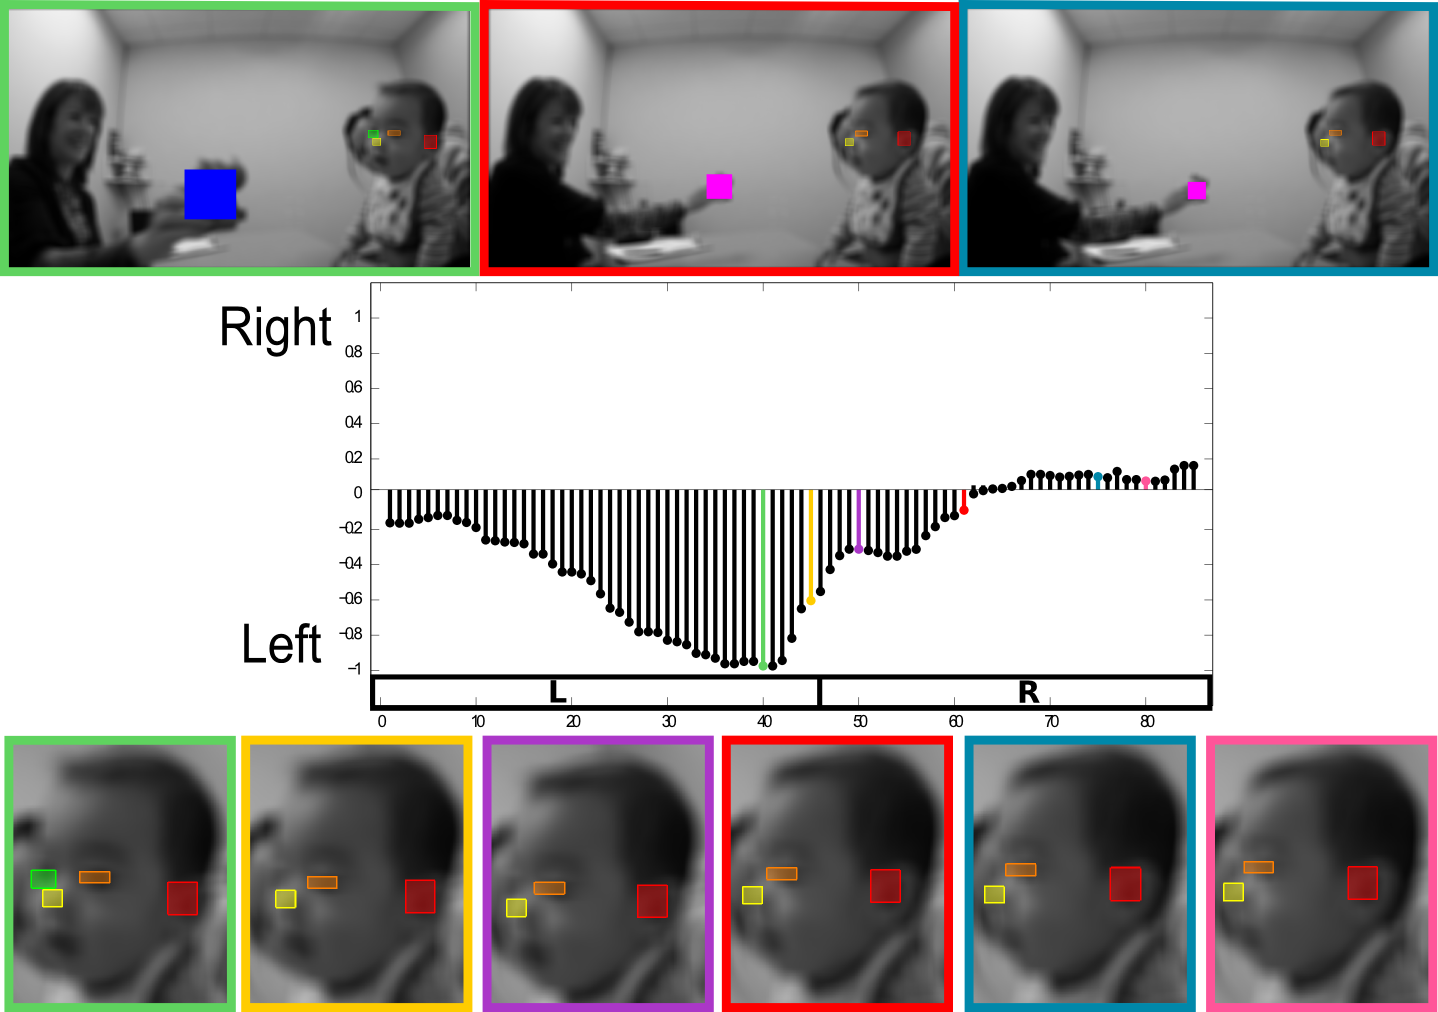
As stated before, the clinician’s assessment of shared interest is partially done in the ball playing activity. Since the AOSI assessment of shared interest is done on a holistic scale, we provide examples of where our automatic method could prove useful. Figure 4 shows examples of our results from the ball playing activity during the freeplay session. For this particular activity, the clinician rolls a ball to the participant and analyzes if the participant shows shared interest. According to the AOSI, the participant shows shared interest if he/she either looks at the clinician or his/her caregiver after receiving the ball. Our automatic method is able to record and display the changes in the pitch motion of the participant. This allows the clinician to not only determine if the participant looked up after receiving the ball, but also how long it took him/her to look up and how long he/she became fixated on the ball. For both examples provided, the participants looked back up at the clinician after receiving the ball. In the first example, the participant looked up at the clinician within 0.73s (22 frames) of receiving the ball. On the other hand, it took the participant in the second example 7.17s (251 frames) to look up at the clinician after receiving the ball. Although each participant showed shared interest, the participant in the second example looks at the ball nearly 6.5s longer than the first participant before he/she looks back up at the clinician. By automating results such as these over large datasets, new patterns and risk behaviors could be established.
4.3 Arm Asymmetry Analysis
We tested our body pose estimation algorithm in video clips in which the entire body of the child can be seen (following Esposito et al., 2011). We compiled video sequences from ASD evaluation sessions of toddlers (aged between to months), using one or two video segments to ensure that each child was represented by one sequence with at least frames in length (). For each video segment of every sequence, a single segmentation mask was obtained interactively in the initial frame (Spina, Falcão and Miranda, 2011). In contrast, Esposito et al. (2011) compiled minutes sequences at fps from participants, that were manually annotated frame-by-frame using EWMN. Our participants are fewer and our sequences shorter, though still sufficient, because our dataset does not contain unsupported gait for longer periods; this is in part because (1) not all participants from our dataset have reached walking age and (2) the sessions took place in a small cluttered room (left image in Figure 14). Hence, we screened our dataset for video segments that better suited the evaluation of our symmetry estimation algorithm, rather than considering each child’s case. We illustrate our results using six of such video segments in figures 5-12 (with groundtruth).
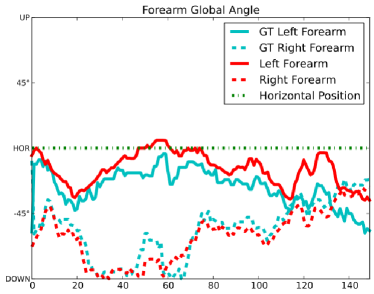
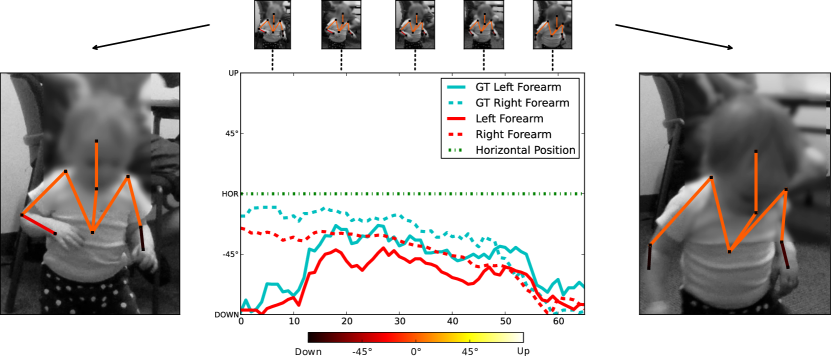
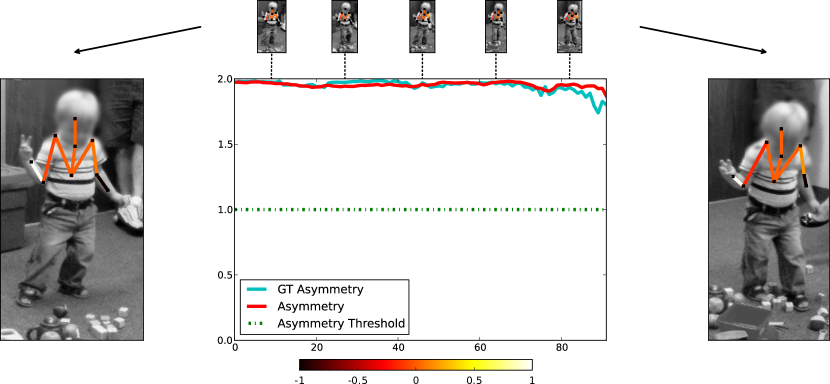
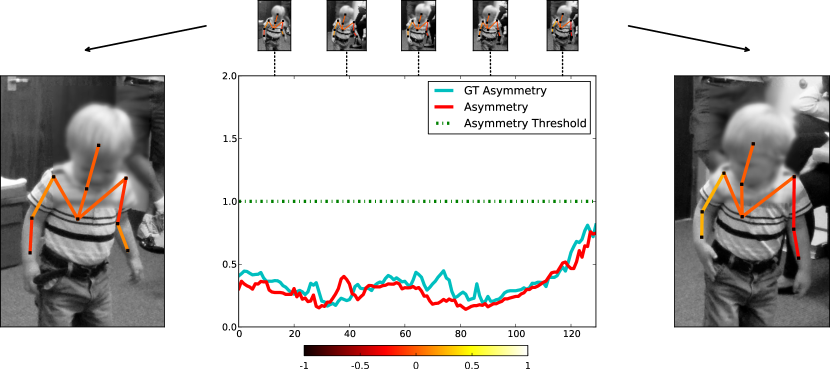
Since we are interested in providing measurements for the clinician, the temporal graphs in figures 5-12 depict the asymmetry score , the left and right forearms’ global angles and corresponding difference , for video segments of participants. Please refer to the captions of the aforementioned figures for a discussion on the advantages and shortcomings of both and . The forearms’ global angles essentially denote where each one is pointing to w.r.t. the horizontal axis (up, down, horizontally). From these measurements, different data can be extracted and interpreted by the specialists. Esposito et al. (2011), for instance, look at two different types of symmetry: Static Symmetry (SS) and Dynamic Symmetry (DS). The former assesses each frame individually, while the latter evaluates groups of frames in a half-second window. If at least one frame is asymmetric in a window, then the entire half-second is considered asymmetric for DS. SS and DS are then the percentage of asymmetric frames and windows in a video sequence, respectively (the higher the number, the more asymmetrical the pattern of walking).
Table 7 summarizes our findings for the participants. We adopt a strict policy by considering a frame asymmetric only when both and agree (i.e., and ). Although we do not aim at fully reproducing the work of Esposito et al. (2011), we attempt to quantify asymmetry for each video sequence by computing SS and DS according to our asymmetry definition. The direct measures reflected by our temporal graphs for each of the participants can be seen in our supplementary results, along with all the videos.
| Part. | Static Sym. | Dynamic Sym. | Clinician’s Seq. Eval. | Seq. Length (s.) | |||
| Aut. (%) | GT (%) | Aut. (%) | GT (%) | Seg. | Seg. | ||
| Asym | - | ||||||
| Sym | - | ||||||
| Asym | Sym/Abn | ||||||
| Sym | Abn | ||||||
| Asym | Sym | ||||||
| Abn | Abn | ||||||
Among the chosen participants, only participant has been diagnosed with autism at age of months. One of the video segments we use clearly shows asymmetric arm behavior (Figure 11), as further confirmed by SS, DS, and the clinician’s evaluation in Table 7. However, such behavior is not a direct example of asymmetry during regular walking pattern. It is rather caused by different types of stereotypical behaviors (e.g., abnormal motor mannerism and “clumsy” gait), as revealed by participant ’s ADOS-T complex mannerism score of ‘’ (‘’-‘’ scale of increasing concern, Luyster et al. (2009)) and AOSI atypical motor behavior score of ‘’ (binary scale using ‘’ for atypical, Bryson et al. (2007)). On the other chosen segment that comprises the video sequence, his arms are symmetric even though he is toe-walking. Still, if such behaviors can be captured by our method, then more complex mannerisms can be addressed in the future, beyond asymmetry detection (e.g., participant also presents frequent arm-and-hand flapping).
Participant has also presented asymmetric arm behavior during regular walking pattern according to both our measurements (figures 5 and 6) and the clinician’s assessment of the video sequence, even though her MSEL (Mullen Scales of Early Learning) gross motor score was ‘’ (below average, Mullen (1995)). Conversely, participants and have presented predominantly symmetric arm behavior, even though received an ADOS-T complex motor mannerism score of ‘’ and an AOSI atypical motor behavior score of ‘.’ Such differences between our measurements and the assessment provided by the clinical tools are probably due to other stereotypical motor behaviors being detected throughout the evaluation session. That is, gait symmetry is not an explicit item of either AOSI nor ADOS-T. On the other hand, MSEL presents a more straightforward evaluation of gross motor patterns which might be more correlated with gait symmetry. The clinician assessed each child using several of these clinical diagnostic tools at different time points. The clinician notes that in the first video segment of participant there might be some arm asymmetry, while in the second video segment of participant he walks with his forearms and hands parallel to the ground, which could be a sign of bad gait. Our method deemed the first segment of participant symmetric mostly because only was able to capture the asymmetry slightly, since it was mild (Figure 9). Hence, we could improve the sensitivity of our measurements, at the cost of obtaining more false positives, by relaxing our criterion and flagging frames if either or point out asymmetry.
In some of the video segments we use, participants and also walk while holding their forearms parallel to the ground pointing forward. In the second video segment of participant , this can be observed in the graph in Figure 10, which shows that the forearms are in near horizontal position thoughout the video segment. Thus, we might also be able to detect those situations in the future from the skeleton we automatically compute. As opposed to participant , participants and might be holding their arms parallel to the ground because they had just learned how to walk a couple of weeks prior to the evaluation session. Only participant has shown signs of concern, as well as higher asymmetry scores from our measurements. In participant ’s video sequence, her unusual arm position seems less natural than that of participant (Figure 7). Regardless, both participants have obtained MSEL gross motor scores within the average range (‘’ and ‘,’ respectively).
Although our method agrees with the clinician’s visual ratings about symmetry in out of video sequences, pointing out when there is asymmetry and/or some other atypical motor pattern, it is far from completely agreeing with the clinical evaluation in every aspect about motor behavior (again, the expert’s assessment is based on significantly more data). We seek instead correlation between our results and the groundtruth skeleton to aid in research and diagnosis by complementing human judgement, since the latter will never be replaced. By analyzing our graphs and Table 7, one can notice that the correlation exists. Thus, all affirmations previously stated are also valid for the groundtruth symmetry measures. We have further shown that our body pose estimation algorithm can be used to detect other potential stereotypical motor behaviors in the future, such as when the toddler is holding his/her forearms parallel to the ground pointing forward. Note that the behaviors here analyzed have only considered simple measures obtained from the skeleton, whereas we can in the future apply pattern classifiers to achieve greater discriminative power.
 |
 |
| (a) | (b) |
 |
 |
| (a) | (b) |
5 Conclusion
This work is the first achieved milestone in a long-term project for non-invasive early observation of children in order to aid in diagnosis of neurodevelopmental disorders. With the goal of aiding and augmenting the visual analysis capabilities in evaluation and developmental monitoring of ASD, we proposed (semi-)automatic computer vision tools to observe specific behaviors related to ASD elicited during AOSI, providing both new challenges and opportunities in video analysis. The proposed tools significantly reduce the effort to only requiring interactive initialization in a single frame. We focused on four activities performed during the battery of assessments of development and behaviors related to ASD: three activities were performed during the AOSI and were related to visual attention and one which involves motor patterns observed at any point during the assessment process. We developed specific algorithms for these activities, obtaining a clinically satisfactory result.
The improvement and extension of the proposed methods is an ongoing work. For the visual attention tests, we plan on complementing the estimation of the child’s motions with estimating the clinician’s movements in order to correlate both. For the assessment of the motor patterns, we will incorporate 3D information using a richer 3D human model. Note that our body pose estimation method can be done in fully automatic fashion by learning the CSM from a sufficiently large training dataset and applying it for single image body pose estimation (similarly to the work of Zuffi, Freifeld and Black (2012)). Also, there is no need for a human intervention in video segment selection, these are easily identified either by time coding, voice commands, or automatically finding the objects (e.g., the ball). Of course, there are additional behavioral red flags of ASD, both included in and beyond the scope of AOSI, which we aim at addressing in the future. An interesting future direction would be to use our symmetry measurements to identify real complex motor mannerisms from more typical toddler movements.444Bilateral and synchronized arm flapping is common in toddlers as they begin to babble, being hard to judge whether this is part of normal development or an unusual behavior. This issue clearly applies to ’s and ’s clips from their 12-month assessments. This extension also includes detecting ASD risk in ordinary classroom and home environments, a challenging task for which the developments here presented are a first step.
Appendix A Tracking and Validating Facial Features
This section provides an overview of the technical aspects of the algorithm for tracking facial features and computing head motions from them. The large variability of the data and the lack of control about the camera positioning call for using very simple and robust features and algorithms.
We assume that, in the first frame, we have bounding boxes of three facial features: the left ear, left eye, and nose. To track these three facial features, and following a scheme loosely based on the KLD tracker (Kalal, Mikolajczyk and Matas, 2010), we use dense motion estimation coupled with a validation step that employs an offline-trained facial feature detector. The dense motion estimator (Tepper and Sapiro, 2012) tracks the features with high accuracy in most cases, but when the child’s head moves quickly, illumination changes can sometimes cause the tracker to lag behind the features. Thus we validate the output of the tracker using facial feature detectors in every frame.
To validate the features we train left eye, right eye, left ear, and nose detectors based on the method proposed by Dalal and Triggs (2005) (see also Everingham, Sivic and Zisserman, 2006). Our method uses multiscale Histograms of Orientated Gradients (HOG) as descriptors to represent each facial feature, and then classifies these descriptors using a Support Vector Machine. As positive training samples, we use hand labeled facial patches from children in our experimental environment. As negative training samples, we extract random patches from around multiple children’s faces.
For each frame, search areas for the facial feature detectors are defined around the bounding boxes given by the tracker. Since the left eye, left ear, and nose are present in every frame for the given camera position, we impose a lenient classifier threshold and geometrical constraints (e.g., the left eye must be higher and to the left of the nose). The tracker’s bounding boxes are validated if their centers are within the bounding boxes returned by the detectors; however, if the tracker’s centers are outside of the detector’s bounding boxes for two consecutive frames, then the corresponding bounding box for the tracker is reset to a new location within the detector’s bounding box. Determining the presence of the right eye aids in the estimation of the yaw motion. The search area for the right eye, which is not tracked since it appears and disappears constantly, is based on the locations of the detected left eye and nose.
A.1 Yaw and Pitch Motion Estimation from Facial Features
In our setup, the child’s face is predominantly in a profile view for the Sharing Interest activity. As a way to provide an accurate motion estimation of the pitch angle we cumulatively sum the vertical coordinate changes of the left eye and nose with respect to the left ear across a period of frames. We expect a positive sum when the child is looking up and a negative sum when the child is looking down, the magnitude representing how much the child is looking up or down.
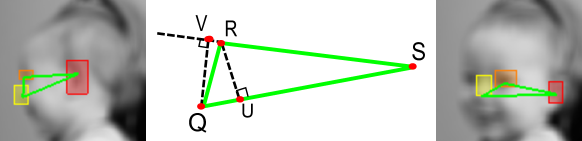
For estimating the yaw angle motion in the Visual Tracking and Disengagement of Attention activities, we calculate two ratios based on the triangle created by the left ear, left eye, and nose (Figure 13); we also use information about the presence of the right eye. Let , , and denote the locations of the nose, left eye, and left ear, respectively. For the first ratio , we project into the line defined by , thus defining the point ; we then define , where is the Euclidian distance. For the second ratio we project into the line defined by , defining .
The two ratios and are inversely proportional. Looking at Figure 13 we can observe that when the face is looking in profile view, will be large and will be small; conversely when the face is in frontal view (looking more towards the camera). To combine these two ratios into one value, we calculate the normalized difference between them, . Thus, as the child is looking to his/her left, goes to -1; and as the child is looking to his/her right, goes to 1. The presence of the right eye further verifies that the infant is looking left.
We incorporate if the right eye is present or not to verify that the infant is looking left or right at the maximum and minimum values.
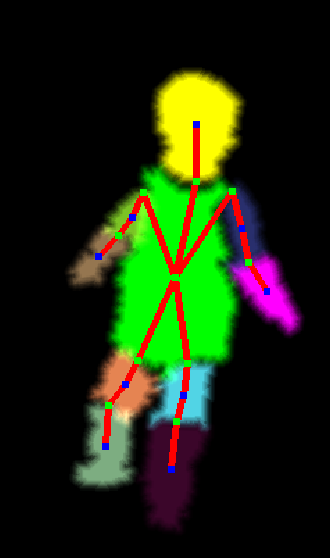
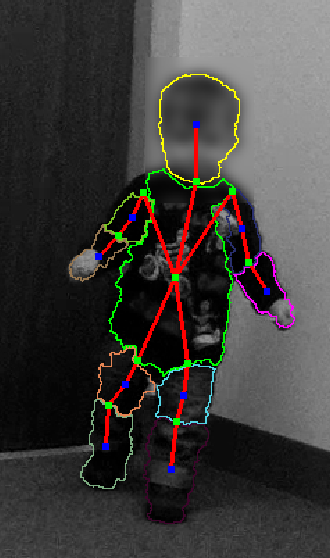
Appendix B Body pose estimation using the Object Cloud Model
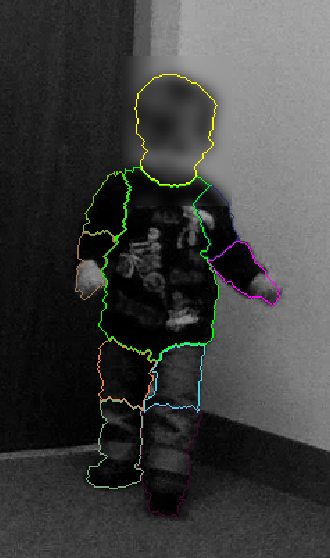
The Object Cloud Model (OCM) is represented by a fuzzy object (cloud image) in which each pixel receives one out of three possible values: object, background, or uncertainty (Miranda, Falcão and Udupa, 2010). The silhouette variations are captured by the uncertainty region, which represents the area where the real object’s boundary is expected to be in a new test image (Figure 14). OCM then treats the object detection task (locating the object of interest in an image) and delineation (defining the object’s spatial extent) in a synergistic fashion. Namely, for each possible object position in an image (frame), OCM executes a delineation algorithm in the uncertainty region and evaluates if the resulting segmentation mask yields a maximum score for a given search criterion. This maximum should be reached when the uncertainty region is properly positioned over the real object’s boundary. Ideally, if the uncertainty region is well adapted to the object’s new silhouette and the delineation is successful, the object search is reduced to translating the model over the image.
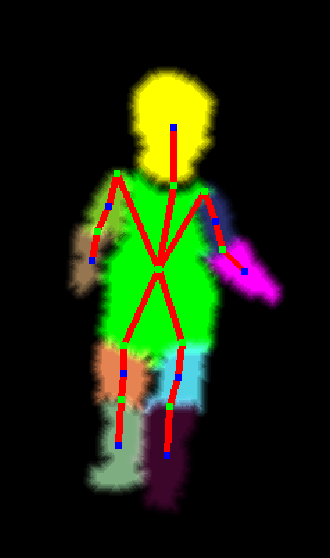
When the object is composed of multiple correlated substructures, such as the parts of the human brain, a Cloud System Model (CSM) may be created by transforming each substructure into an OCM and taking into account the relative position between them during the search (Miranda, Falcão and Udupa, 2010). We consider the human body as the object of interest, divide it into each of its major structures (torso, head, arms, and legs), and connect those structures using a 2D stickman model to create a CSM in a given initial frame (figures 14LABEL:sub@f.pose-estimation1_seg-LABEL:sub@f.pose-estimation1_stick). Then, the resulting CSM is used to automatically find the toddler’s body frame-by-frame in the video segment (figures 14LABEL:sub@f.pose-estimation2_seg-LABEL:sub@f.pose-estimation2_stick).
We require a single segmentation mask, obtained interactively in the first frame (Spina, Falcão and Miranda, 2011), to compute the model. Then, the body pose search maximizes the search criterion by applying affine transforms to each CSM cloud, respecting the body’s tree hierarchy (rooted at the torso), until the model finds the new pose. We use dense optical flow (Tepper and Sapiro, 2012) to reinitialize the pose search for the next frame, which is repeated until the end of the video segment. details about creating and using CSM for 2D body pose estimation). If necessary, one may correct the pose search by stopping our method and providing a new segmentation mask in a given frame. This is a standard procedure in popular video analysis packages such as Adobe’s After Effects.
B.1 Arm Asymmetry Score Computation
For computing the asymmetry score from the estimated skeleton, we first define the following normalized asymmetry score for each arm segment:
| (1) |
where is the absolute difference between either global or relative 2D angles obtained from corresponding left/right arm segments, is a given asymmetry threshold, and is a parameter set to control acceptable asymmetry values. Considering EWMN’s accuracy, we set the asymmetry threshold . We have empirically observed that helps coping with near asymmetrical poses when outputing the asymmetry score.
For the upper arm asymmetry score , we set in Equation 1 with being the absolute difference between the global angles and formed by the left and right upper arms with the vertical axis, respectively (Figure 15). The forearm asymmetry score is similarly defined by setting , where is the relative forearm angle with respect to the upper arm formed by the elbow (Figure 15). To ensure that we are considering symmetric arm poses, we mirror the skeleton on the vertical axis to compute all global angles on the and quadrants of the cartesian plane. The asymmetry score for the entire arm is finally defined as
| (2) |
The rationale behind Equation 2 is that if the toddler’s upper arms are pointing to different (mirrored) directions, then the arms are probably asymmetric and should be high (i.e., ). Otherwise, if is great then one arm is probably stretched while the other one is not, thus suggesting arm asymmetry. Regardless, we may also use where the forearms are pointing to as another asymmetry measure, by analysing their global mirrored angles and w.r.t. the horizontal axis (Figure 15). If the absolute difference between those global angles is greater than , for example, then the arm poses are probably asymmetric (Hashemi et al., 2012).
References
- Bryson et al. (2007) {barticle}[author] \bauthor\bsnmBryson, \bfnmS.\binitsS., \bauthor\bsnmZwaigenbaum, \bfnmL.\binitsL., \bauthor\bsnmBrian, \bfnmJ.\binitsJ., \bauthor\bsnmRoberts, \bfnmW.\binitsW., \bauthor\bsnmSzatmari, \bfnmP.\binitsP., \bauthor\bsnmRombough, \bfnmV.\binitsV. and \bauthor\bsnmMcDermott, \bfnmC.\binitsC. (\byear2007). \btitleA Prospective Case Series of High-risk Infants who Developed Autism. \bjournalJ. Autism Dev. Disord. \bvolume37 \bpages12–24. \endbibitem
- Dalal and Triggs (2005) {binproceedings}[author] \bauthor\bsnmDalal, \bfnmN.\binitsN. and \bauthor\bsnmTriggs, \bfnmB.\binitsB. (\byear2005). \btitleHistograms of Oriented Gradients for Human Detection. In \bbooktitleCVPR. \endbibitem
- Dawson (2008) {barticle}[author] \bauthor\bsnmDawson, \bfnmGeraldine\binitsG. (\byear2008). \btitleEarly behavioral intervention, brain plasticity, and the prevention of autism spectrum disorder. \bjournalDev. Psychopathol. \bvolume20 \bpages775–803. \endbibitem
- Downing et al. (2011) {binproceedings}[author] \bauthor\bsnmDowning, \bfnmK.\binitsK., \bauthor\bsnmConcannon, \bfnmK.\binitsK., \bauthor\bsnmVogel-Farley, \bfnmV\binitsV., \bauthor\bsnmNelson, \bfnmC. A.\binitsC. A. and \bauthor\bsnmTager-Flusberg, \bfnmH.\binitsH. (\byear2011). \btitleCan the AOSI at Nine Months Discriminate Between Infants at High or Low Risk for ASD? In \bbooktitleIMFAR. \endbibitem
- Eichner et al. (2012) {barticle}[author] \bauthor\bsnmEichner, \bfnmM.\binitsM., \bauthor\bsnmMarin-Jimenez, \bfnmM.\binitsM., \bauthor\bsnmZisserman, \bfnmA.\binitsA. and \bauthor\bsnmFerrari, \bfnmV.\binitsV. (\byear2012). \btitle2D Articulated Human Pose Estimation and Retrieval in (Almost) Unconstrained Still Images. \bjournalInt. J. Comput. Vis. \bvolume99 \bpages190-214. \endbibitem
- Esposito et al. (2011) {barticle}[author] \bauthor\bsnmEsposito, \bfnmG.\binitsG., \bauthor\bsnmVenuti, \bfnmP.\binitsP., \bauthor\bsnmApicella, \bfnmF.\binitsF. and \bauthor\bsnmMuratori, \bfnmF.\binitsF. (\byear2011). \btitleAnalysis of unsupported gait in toddlers with autism. \bjournalBrain Dev. \bvolume33 \bpages367–373. \endbibitem
- Everingham, Sivic and Zisserman (2006) {binproceedings}[author] \bauthor\bsnmEveringham, \bfnmM.\binitsM., \bauthor\bsnmSivic, \bfnmJ.\binitsJ. and \bauthor\bsnmZisserman, \bfnmA.\binitsA. (\byear2006). \btitle“Hello! My name is… Buffy” - Automatic Naming of Characters in TV Video. In \bbooktitleBMVC. \endbibitem
- Freeth, Foulsham and Chapman (2010) {barticle}[author] \bauthor\bsnmFreeth, \bfnmM.\binitsM., \bauthor\bsnmFoulsham, \bfnmT.\binitsT. and \bauthor\bsnmChapman, \bfnmP.\binitsP. (\byear2010). \btitleThe influence of visual saliency on fixation patterns in individuals with Spectrum Disorders. \bjournalNeuropsychologia \bvolume49 \bpages156–160. \endbibitem
- Goodwin et al. (2011) {barticle}[author] \bauthor\bsnmGoodwin, \bfnmMatthew S.\binitsM. S., \bauthor\bsnmIntille, \bfnmStephen S.\binitsS. S., \bauthor\bsnmAlbinali, \bfnmFahd\binitsF. and \bauthor\bsnmVelicer, \bfnmWayne F.\binitsW. F. (\byear2011). \btitleAutomated Detection of Stereotypical Motor Movements. \bjournalJ. Autism Dev. Disord. \bvolume41 \bpages770–782. \endbibitem
- Hashemi et al. (2012) {binproceedings}[author] \bauthor\bsnmHashemi, \bfnmJordan\binitsJ., \bauthor\bsnmSpina, \bfnmThiago V.\binitsT. V., \bauthor\bsnmTepper, \bfnmMariano\binitsM., \bauthor\bsnmEsler, \bfnmAmy\binitsA., \bauthor\bsnmMorellas, \bfnmVassilios\binitsV., \bauthor\bsnmPapanikolopoulos, \bfnmNikolaos\binitsN. and \bauthor\bsnmSapiro, \bfnmGuillermo\binitsG. (\byear2012). \btitleA computer vision approach for the assessment of autism-related behavioral markers. In \bbooktitleICDL-EpiRob. \bnoteAccepted. \endbibitem
- Ionescu, Li and Sminchisescu (2011) {binproceedings}[author] \bauthor\bsnmIonescu, \bfnmC.\binitsC., \bauthor\bsnmLi, \bfnmFuxin\binitsF. and \bauthor\bsnmSminchisescu, \bfnmC.\binitsC. (\byear2011). \btitleLatent structured models for human pose estimation. In \bbooktitleICCV. \endbibitem
- Jones, Carr and Klin (2008) {barticle}[author] \bauthor\bsnmJones, \bfnmW.\binitsW., \bauthor\bsnmCarr, \bfnmK.\binitsK. and \bauthor\bsnmKlin, \bfnmA.\binitsA. (\byear2008). \btitleAbsence of Preferential Looking to the Eyes of Approaching Adults Predicts Level of Social Disability in 2-Year-Old Toddlers With Autism Spectrum Disorder. \bjournalArch. Gen. Psyschiatry \bvolume65 \bpages946–954. \endbibitem
- Kalal, Mikolajczyk and Matas (2010) {binproceedings}[author] \bauthor\bsnmKalal, \bfnmZ.\binitsZ., \bauthor\bsnmMikolajczyk, \bfnmK.\binitsK. and \bauthor\bsnmMatas, \bfnmJ.\binitsJ. (\byear2010). \btitleFace-TLD: Tracking-Learning-Detection Applied to Faces. In \bbooktitleICIP. \endbibitem
- Klin et al. (2002) {barticle}[author] \bauthor\bsnmKlin, \bfnmA.\binitsA., \bauthor\bsnmJones, \bfnmW.\binitsW., \bauthor\bsnmSchultz, \bfnmR.\binitsR., \bauthor\bsnmVolkmar, \bfnmF.\binitsF. and \bauthor\bsnmCohen, \bfnmD.\binitsD. (\byear2002). \btitleVisual Fixation Patterns During Viewing of Naturalistic Social Situations as Predictors of Social Competence in Individuals With Autism. \bjournalArch. Gen. Psychiatry \bvolume59 \bpages809–816. \endbibitem
- Kohli et al. (2008) {barticle}[author] \bauthor\bsnmKohli, \bfnmPushmeet\binitsP., \bauthor\bsnmRihan, \bfnmJonathan\binitsJ., \bauthor\bsnmBray, \bfnmMatthieu\binitsM. and \bauthor\bsnmTorr, \bfnmPhilip\binitsP. (\byear2008). \btitleSimultaneous Segmentation and Pose Estimation of Humans Using Dynamic Graph Cuts. \bjournalInt. J. Comput. Vis. \bvolume79 \bpages285-298. \endbibitem
- Landry and Bryson (2004) {barticle}[author] \bauthor\bsnmLandry, \bfnmR.\binitsR. and \bauthor\bsnmBryson, \bfnmS.\binitsS. (\byear2004). \btitleImpaired disengagement of attention in young children with autism. \bjournalJ. Child Psychol. Psychiatry \bvolume45 \bpages1115–22. \endbibitem
- Luyster et al. (2009) {barticle}[author] \bauthor\bsnmLuyster, \bfnmRhiannon\binitsR., \bauthor\bsnmGotham, \bfnmKatherine\binitsK., \bauthor\bsnmGuthrie, \bfnmWhitney\binitsW., \bauthor\bsnmCoffing, \bfnmMia\binitsM., \bauthor\bsnmPetrak, \bfnmRachel\binitsR., \bauthor\bsnmPierce, \bfnmKaren\binitsK., \bauthor\bsnmBishop, \bfnmSomer\binitsS., \bauthor\bsnmEsler, \bfnmAmy\binitsA., \bauthor\bsnmHus, \bfnmVanessa\binitsV., \bauthor\bsnmOti, \bfnmRosalind\binitsR., \bauthor\bsnmRichler, \bfnmJennifer\binitsJ., \bauthor\bsnmRisi, \bfnmSusan\binitsS. and \bauthor\bsnmLord, \bfnmCatherine\binitsC. (\byear2009). \btitleThe Autism Diagnostic Observation Schedule-Toddler Module: A New Module of a Standardized Diagnostic Measure for Autism Spectrum Disorders. \bjournalJ. Autism Dev. Disord. \bvolume39 \bpages1305–1320. \endbibitem
- Miranda, Falcão and Udupa (2010) {btechreport}[author] \bauthor\bsnmMiranda, \bfnmPaulo A. V.\binitsP. A. V., \bauthor\bsnmFalcão, \bfnmAlexandre X.\binitsA. X. and \bauthor\bsnmUdupa, \bfnmJayaram K.\binitsJ. K. (\byear2010). \btitleCloud Models: Their Construction and Employment in Automatic MRI Segmentation of the Brain \btypeTechnical Report No. \bnumberIC-10-08, \binstitutionIC, University of Campinas. \endbibitem
- Mullen (1995) {bbook}[author] \bauthor\bsnmMullen, \bfnmEllen\binitsE. (\byear1995). \btitleThe Mullen Scales of Early Learning. \bpublisherAmerican Guidance Service. \endbibitem
- Nazneen et al. (2010) {binproceedings}[author] \bauthor\bsnmNazneen, \bfnmFnu\binitsF., \bauthor\bsnmBoujarwah, \bfnmFatima A.\binitsF. A., \bauthor\bsnmSadler, \bfnmShone\binitsS., \bauthor\bsnmMogus, \bfnmAmha\binitsA., \bauthor\bsnmAbowd, \bfnmGregory D.\binitsG. D. and \bauthor\bsnmArriaga, \bfnmRosa I.\binitsR. I. (\byear2010). \btitleUnderstanding the challenges and opportunities for richer descriptions of stereotypical behaviors of children with ASD: a concept exploration and validation. In \bbooktitleASSETS. \endbibitem
- Rodier (2002) {barticle}[author] \bauthor\bsnmRodier, \bfnmP.\binitsP. (\byear2002). \btitleConverging evidence for brain stem injury in autism. \bjournalDev. Psychopathol. \bvolume14 \bpages537–557. \endbibitem
- Shattuck et al. (2009) {barticle}[author] \bauthor\bsnmShattuck, \bfnmPaul T.\binitsP. T., \bauthor\bsnmDurkin, \bfnmMaureen\binitsM., \bauthor\bsnmMaenner, \bfnmMatthew\binitsM., \bauthor\bsnmNewschaffer, \bfnmCraig\binitsC., \bauthor\bsnmMandell, \bfnmDavid S.\binitsD. S., \bauthor\bsnmWiggins, \bfnmLisa\binitsL., \bauthor\bsnmLee, \bfnmLi-Ching C.\binitsL.-C. C., \bauthor\bsnmRice, \bfnmCatherine\binitsC., \bauthor\bsnmGiarelli, \bfnmEllen\binitsE., \bauthor\bsnmKirby, \bfnmRussell\binitsR., \bauthor\bsnmBaio, \bfnmJon\binitsJ., \bauthor\bsnmPinto-Martin, \bfnmJennifer\binitsJ. and \bauthor\bsnmCuniff, \bfnmChristopher\binitsC. (\byear2009). \btitleTiming of identification among children with an autism spectrum disorder: findings from a population-based surveillance study. \bjournalJ. Am. Acad. Child Adolesc. Psychiatry \bvolume48 \bpages474–483. \endbibitem
- Sivalingam et al. (2012) {binproceedings}[author] \bauthor\bsnmSivalingam, \bfnmR.\binitsR., \bauthor\bsnmSomasundaram, \bfnmG.\binitsG., \bauthor\bsnmBhatawadekar, \bfnmV.\binitsV., \bauthor\bsnmMorellas, \bfnmV.\binitsV. and \bauthor\bsnmPapanikolopoulos, \bfnmN.\binitsN. (\byear2012). \btitleSparse representation of point trajectories for action classification. In \bbooktitleICRA. \endbibitem
- Spina, Falcão and Miranda (2011) {binproceedings}[author] \bauthor\bsnmSpina, \bfnmThiago Vallin\binitsT. V., \bauthor\bsnmFalcão, \bfnmAlexandre Xavier\binitsA. X. and \bauthor\bsnmMiranda, \bfnmPaulo André Vechiatto\binitsP. A. V. (\byear2011). \btitleUser-steered image segmentation using live markers. In \bbooktitleCAIP. \endbibitem
- Teitelbaum et al. (2004) {barticle}[author] \bauthor\bsnmTeitelbaum, \bfnmOsnat\binitsO., \bauthor\bsnmBenton, \bfnmTom\binitsT., \bauthor\bsnmShah, \bfnmPrithvi K.\binitsP. K., \bauthor\bsnmPrince, \bfnmAndrea\binitsA., \bauthor\bsnmKelly, \bfnmJoseph L.\binitsJ. L. and \bauthor\bsnmTeitelbaum, \bfnmPhilip\binitsP. (\byear2004). \btitleEshkol-Wachman movement notation in diagnosis: The early detection of Asperger ’s syndrome. \bjournalProc. Natl. Acad. Sci. USA \bvolume101 \bpages11909–11914. \endbibitem
- Tepper and Sapiro (2012) {binproceedings}[author] \bauthor\bsnmTepper, \bfnmM.\binitsM. and \bauthor\bsnmSapiro, \bfnmG.\binitsG. (\byear2012). \btitleDecoupled coarse-to-fine matching and nonlinear regularization for efficient motion estimation. In \bbooktitleICIP. \endbibitem
- Yao and Fei-Fei (2012) {binproceedings}[author] \bauthor\bsnmYao, \bfnmBangpeng\binitsB. and \bauthor\bsnmFei-Fei, \bfnmLi\binitsL. (\byear2012). \btitleAction Recognition with Exemplar Based 2.5D Graph Matching. In \bbooktitleECCV. \endbibitem
- Zuffi, Freifeld and Black (2012) {binproceedings}[author] \bauthor\bsnmZuffi, \bfnmS.\binitsS., \bauthor\bsnmFreifeld, \bfnmO.\binitsO. and \bauthor\bsnmBlack, \bfnmM. J.\binitsM. J. (\byear2012). \btitleFrom pictorial structures to deformable structures. In \bbooktitleCVPR. \endbibitem
- Zwaigenbaum et al. (2005) {barticle}[author] \bauthor\bsnmZwaigenbaum, \bfnmL.\binitsL., \bauthor\bsnmBryson, \bfnmS.\binitsS., \bauthor\bsnmRogers, \bfnmT.\binitsT., \bauthor\bsnmRoberts, \bfnmW.\binitsW., \bauthor\bsnmBrian, \bfnmJ.\binitsJ. and \bauthor\bsnmSzatmari, \bfnmP.\binitsP. (\byear2005). \btitleBehavioral manifestations of autism in the first year of life. \bjournalInt. J. Dev. Neurosci. \bvolume23 \bpages143–152. \endbibitem