The SW Sex enigma
Abstract
The SW Sex stars are a class of cataclysmic variables, originally identified because they shared a number of enigmatic properties – most notably, single-peaked emission lines instead of the double-peaked lines one would expect from their high-inclination accretion discs. We present high time-resolution spectrophotometry of the eclipsing nova-like variables SW Sex and DW UMa, two of the founding members of the SW Sex class. Both systems show single-peaked Balmer and He II 4686Å emission lines that appear to originate from a region in the disc that lies close to, but downstream of, the bright spot. The emission-line light curves are consistent with the finding from X-ray and ultraviolet observations that we predominantly see the flared disc rim and the unobscured back portion of the disc in these systems. In DW UMa, the He II 4686Å emission line originates from close to the white dwarf and exhibits flaring. Such flares have been used to argue for magnetically-channelled accretion, as in the intermediate polars, but the lack of a clear periodicity in the flares argues for a simpler model in which we are viewing the central regions of the disc through the non-uniform upper edge of a flared disc rim. We also observe narrow, blue-shifted, transient absorption features in the Balmer lines of DW UMa, which we attribute to blobs of material ejected from the system, possibly by a magnetic propeller, that happen to be passing between us and the binary. Our results suggest that the solution to the SW Sex enigma is a combination of dominant bright-spot emission and a self-occulting disc. We also propose a simplified classification scheme for nova-like variables.
keywords:
accretion, accretion discs – binaries: eclipsing – binaries: spectroscopic – stars: individual: SW Sex, DW UMa – novae, cataclysmic variables.1 Introduction
Cataclysmic variables (CVs) are close binaries consisting of a white dwarf accreting material from a companion star via an accretion disc or magnetic accretion stream. Nova-like variables (NLs) are those CVs which have not been observed to undergo a nova or dwarf nova outburst. The absence of dwarf nova outbursts in NLs is believed to be due to their high mass transfer rates, producing ionised accretion discs in which the disc instability mechanism is suppressed. For a review of CVs and NLs, see Warner (1995) and Hellier (2001).
Over two decades ago, a sub-class of NLs was identified that shared common but inexplicable properties (e.g. Szkody & Piché 1990; Dhillon 1990; Thorstensen et al. 1991). These so-called “SW Sex stars” exhibit deep continuum eclipses, implying a high-inclination accretion disc. However, their emission lines show single-peaked profiles and shallow eclipses, instead of the deeply-eclipsing, double-peaked profiles one would expect (Horne & Marsh, 1986). Moreover, their emission lines do not share the orbital motion of the white dwarf, and exhibit transient absorption features, all indicative of a complex, possibly non-disc origin. One could argue that determining the precise origin of the emission lines is an unimportant detail, if it were not for the fact that the orbital periods of SW Sex stars lie tightly clustered just above the period gap of CVs (Rodríguez-Gil et al., 2007a). Hence, understanding the processes responsible for making SW Sex stars appear so different to other classes of CV might also provide a clue as to the nature of the period gap, which remains one of the most poorly understood links in the chain of CV evolution (Knigge et al., 2011).
At the time of writing, there are 30 confirmed members of the SW Sex class111See D. W. Hoard’s Big List of SW Sextantis Stars at http://www.dwhoard.com/home/biglist (Hoard et al., 2003).. The membership criteria since the class was first recognised in 1991 has changed somewhat (e.g. see Rodríguez-Gil et al. 2007b). Most notably, large numbers of lower-inclination, non-eclipsing SW Sex stars have been found, making up approximately half of the population (Rodríguez-Gil et al., 2007a). Moreover, the SW Sex stars are now known to make up over half of the CV population within the 2–3 h period gap, as well as dominating the population of CVs in the 3–4.5 h range immediately above the gap (Rodríguez-Gil et al., 2007a).
Several models11footnotemark: 1 have been proposed to explain the behaviour of SW Sex stars, most of which include one or more of the following ingredients: accretion disc wind, gas-stream overflow, magnetic accretion, and obscuration by the disc rim. None are entirely satisfactory – see Dhillon et al. (1991), Hellier (2000), Hoard et al. (2003) and Rodríguez-Gil et al. (2007a) for detailed discussions. With the aim of discriminating between the various models, we obtained time-resolved, spectrophotometric data of two of the founding members of the SW Sex class: DW UMa (see Hoard et al. (2010) and references therein) and SW Sex (see Dhillon et al. (1997), hereafter DMJ97, and references therein). To the best of our knowledge, the data presented in this paper are the highest quality optical data published to date on these systems, having been obtained with a telescope of twice the aperture of previous studies.
2 Observations and data reduction
On the nights of 1997 February 22 and 23 we obtained spectrophotometry of DW UMa and SW Sex with the 4.2-m William Herschel Telescope (WHT) on La Palma. The ISIS spectrometer (Carter et al., 1993) with the R1200R and R1200B gratings and the TEK CCD chips gave a wavelength coverage of approximately Å at Å (50 km s-1) resolution in the blue arm and Å at Å (36 km s-1) resolution in the red arm. On the first night we obtained 414 red and 420 blue spectra of DW UMa, covering 3.0 orbits. On the second night we obtained 347 red and 345 blue spectra of SW Sex covering 2.3 orbits, and were also able to obtain a further 94 red and 94 blue spectra of DW UMa. The exposures were all 60 s with 15 s dead-time for the archiving of data. The slit was oriented to cover a nearby comparison star and wide slit exposures were taken in order to correct for slit losses. Comparison arc spectra were taken every min to calibrate the spectrograph flexure. Both nights were photometric, with the seeing ranging from .
Data reduction was performed using TRM’s pamela and molly packages. We first corrected for pixel-to-pixel sensitivity variations in the spatial and dispersion directions using sky and tungsten lamp flat-fields, respectively. After sky subtraction, the data were optimally extracted to give raw spectra of SW Sex, DW UMa and the comparison stars. Arc spectra were then extracted from the same locations on the detector as the targets. The wavelength scale for each spectrum was interpolated from the wavelength scales of two neighbouring arc spectra. The comparison stars were too faint to allow for a wavelength-dependent slit-loss correction, so each SW Sex and DW UMa spectrum was divided by the total flux in the corresponding comparison star spectrum and multiplied by the total flux in the wide slit comparison star spectrum. The observations were placed on an absolute flux scale by using observations of the standard star HD 19445 (Oke & Gunn, 1983) taken at the end of each night. The red spectra contained significant telluric features which were removed using spectra of the rapidly rotating B stars HR1037 and HR1786.
3 Results
3.1 Average spectra


The averages of all blue and red spectra of SW Sex and DW UMa, uncorrected for orbital motion, are displayed in Fig. 1, and in Table 1 we list fluxes, equivalent widths and velocity widths of the most prominent lines measured from the average spectrum.
SW Sex shows broad emission lines due to the Balmer series, He I, He II 4686Å and C III / N III Å. The average spectrum in the blue is similar in appearance to that presented by DMJ97. The continuum is weaker (around 3 mJy, compared to the 6 mJy reported by DMJ97), but the emission lines are of similar strength. The weak He I 4922Å line appears to be double peaked, as expected for a line originating in a high-inclination accretion disc, but the Balmer, He II and C III / N III lines are all single-peaked. There are no visible secondary-star absorption features. The spectrum of SW Sex resembles that of the other SW Sex stars; a direct comparison of the spectrum of SW Sex with four other members of the class is given by Dhillon (1996).
DW UMa shows the same broad Balmer and He I lines as SW Sex (with the addition of the He I 4713Å line), as well as the high-excitation lines of He II 4686Å and C III / N III Å. The system appears to have come out of the low state observed by Dhillon et al. (1994; hereafter DJM94) and returned to the high state observed by Shafter et al. (1988): the continuum, at around 5 mJy, and the return of the He II 4686Å line to a strength comparable to that of H is in marked contrast to the spectra shown by DJM94, in which there was no He II 4686Å and the continuum was around 0.1 mJy. H and C III / N III Å show more structure in the average spectrum of DW UMa than in SW Sex, the He I lines are not double-peaked, and the He II 4686Å line also differs from that in SW Sex, having a narrow core on top of a wide base. No absorption lines from the secondary star are detected.
| Line | Flux | EW | FWHM | FWZI |
| 10-14 | Å | km s-1 | km s-1 | |
| erg cm-2 s-1 | ||||
| SW Sex | ||||
| H | ||||
| H | ||||
| He II 4686Å | – | |||
| C III/N III | – | |||
| He I 4922Å | ||||
| He I 6678Å | ||||
| DW UMa | ||||
| H | ||||
| H | ||||
| He II 4686Å | – | |||
| C III/N III | – | |||
| He I 4922Å | ||||
| He I 6678Å |
3.2 Light curves


We recorded two eclipses each of SW Sex (at and ) and DW UMa (at and ). For SW Sex, we combined these mid-eclipse timings with those of Penning et al. (1984), Dhillon et al. (1997), Ashoka et al. (1994) and Groot et al. (2001) to obtain the following ephemeris:
For DW UMa, we combined our eclipse timings with those of Shafter et al. (1988) and Dhillon et al. (1994) to obtain the following ephemeris:
The residuals from these fits show no evidence for period changes in the decade-long baseline of eclipse timings. The above ephemerides were used to place all of the data presented in this paper on a phase scale. Note that a more up-to-date ephemeris for each target has recently been presented by Boyd (2012).
Regions of the spectrum devoid of emission lines were selected in the blue and red (Å and Å, respectively). The blue and red continuum light curves for SW Sex and DW UMa were then computed by summing the flux in the above wavelength ranges. A third-order polynomial fit to the continuum was subtracted from the blue and red spectra and the emission-line light curves were then computed by summing the residual flux between km s-1 for the Balmer lines, km s-1 for the He I and He II 4686Å lines and between Å for C III / N III Å. The resulting light curves for SW Sex and DW UMa are plotted in Fig. 2.
Our light curves of SW Sex are qualitatively similar to those presented by DMJ97 and Groot et al. (2001). The continuum shows a deep, slightly asymmetrical eclipse, the ingress being steeper than the egress, and the blue light curve having a deeper eclipse than the red, consistent with the presence of a bright spot. There is the clear signature of an orbital hump around phase , as also seen by Rutten et al. (1992) and Ashoka et al. (1994), caused by the changing aspect of the bright spot. The only other feature in the continuum light curves is the flickering seen in all CVs. The eclipses of the Balmer lines in SW Sex are shallower than the continuum eclipses, and the asymmetry is reversed, the egress being steeper than the ingress which begins around phase 0.8. The eclipse appears to have two components, a narrow central component from orbital phase to 0.05, which is presumably the eclipse of the disc, and a broader, shallower component from orbital phase to 0.2, which may be attributed to the obscuration of the inner disc by a raised disc rim downstream of the bright spot. The He II 4686Å and C III / N III Å eclipses are quite deep and slightly narrower than the continuum light curves, but show no other significant features. The light curves of both He I lines show peculiar behaviour – the 4922Å line is barely eclipsed and is strongest around orbital phase 0.7, while the 6678Å line appears to be eclipsed early, with mid-eclipse around orbital phase 0.95.
There is no evidence of a reduction in flux around phase 0.5 in any of the lines of SW Sex, despite the fact that this is supposedly one of the defining features of SW Sex stars and SW Sex itself is the proto-type of the class (Thorstensen et al., 1991). The system brightness of SW Sex during our observations was approximately the same as observed by Groot et al. (2001), who also failed to see the phase 0.5 absorption feature. This is in contrast to the observations of SW Sex presented by DMJ97, Honeycutt et al. (1986), and Szkody & Piché (1990), during which SW Sex was a factor of two brighter and clearly showed the phase 0.5 absorption feature. It is likely, therefore, that the presence of phase 0.5 absorption is accretion-rate dependent.
The continuum light curves of DW UMa show deep symmetrical eclipses (the eclipse at orbital phase 31284.0 was missed because of cloud), but there is no orbital hump apparent in these light curves, in contrast to those of SW Sex. The system appeared to brighten on the second night, the continuum brightness out of eclipse rising from around 5 mJy during cycles to mJy during cycles 31289 and 31292. The eclipses of the Balmer lines are shallow, especially in H, in which the flux around phase 0.5 is lower than during primary eclipse. The high-excitation lines of He II 4686Å and C III / N III Å are deeply eclipsed, as in SW Sex, and again the eclipses of these lines are centred on phase zero and narrower than the continuum eclipses, implying an origin coincident with the inner disc region. The light curves of the He I lines are similar to those of the Balmer lines. Note also that the fluxes of all the lines do not change substantially on the second night, despite the significantly increased continuum brightness.
3.3 Trailed spectra
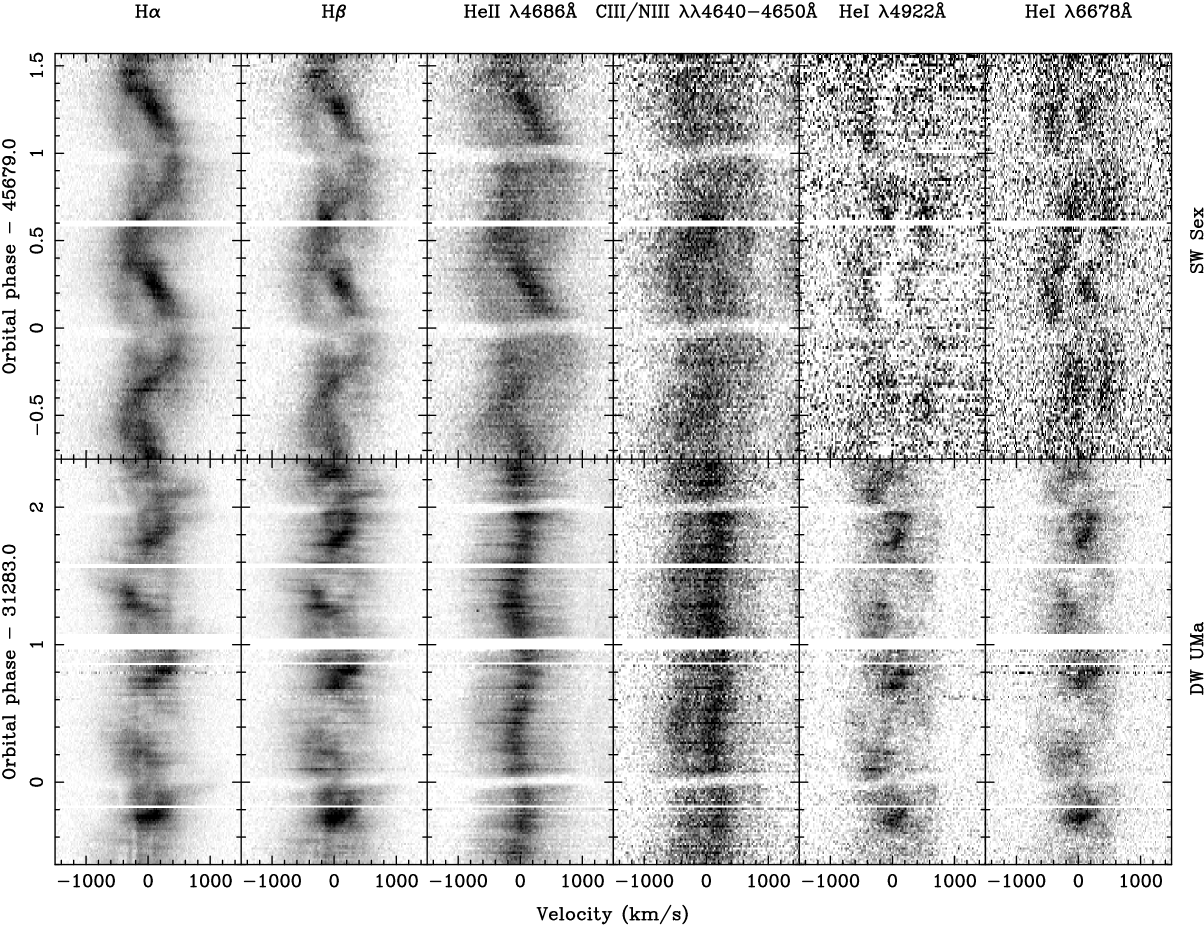
We subtracted the continuum from each of the spectra using a third-order polynomial fit and then rebinned the spectra onto a constant velocity-interval scale centred on the rest wavelengths of the lines. Fig. 3 shows the trailed spectra of the H, H, He II 4686Å, C III / N III Å, He I 4922Å and He I 6678Å lines in SW Sex (top) and DW UMa (bottom).
In SW Sex, the Balmer lines appear to have two major components. The first and strongest starts at a velocity of km s-1 just after eclipse and moves towards the blue. The second, weaker component starts at a velocity of approximately km s-1 and is in approximate anti-phase with the first component. The dominant component in the He II 4686Å trail shows a similar amplitude and phase to the strongest Balmer-line component, but is clearly visible only through orbital phases and shows a high velocity component out of phase with the expected motion of the white dwarf. The weaker lines have less structure, though the double peaks of the He I lines can be seen to follow an S-wave in approximate phase with the expected motion of the white dwarf. All of the lines show evidence for the eclipse of an accretion disc, with the blue wings of the lines obscured before the red wings. The trailed spectra of SW Sex show no evidence for phase 0.5 absorption (see also Section 3.2); apart from this, they are in good agreement with the trailed spectra presented by DMJ97 and Honeycutt et al. (1986), but of significantly higher quality.
In DW UMa, the Balmer lines are dominated by a single-peaked S-wave of semi-amplitude km s-1, which is at its strongest during and . At other phases it is almost entirely absent. There is a faint, high-velocity component which shows up most clearly in the trail of the H line, running from around +1000 km s-1 at orbital phase 0.0 to km s-1 at orbital phase 0.5. There are also blue-shifted stationary absorption features running through the Balmer-line trailed spectra, strongest in the first hour of observation, but also faintly visible at some later times. These are discussed in more detail in Section 3.4.1. The He II 4686Å line has a single S-wave component, in phase with the expected motion of the white dwarf, with a lower velocity amplitude than the Balmer lines ( km s-1). The blend of C III / N III Å shows a similar trail to that of He II 4686Å. Note also the quasi-periodic flaring of the He II 4686Å line in DW UMa, visible as horizontal stripes in the trailed spectra. This is discussed in more detail in Section 3.4.2. Both He I lines appear similar to the Balmer lines with strong components at orbital phases and .
3.4 Doppler maps
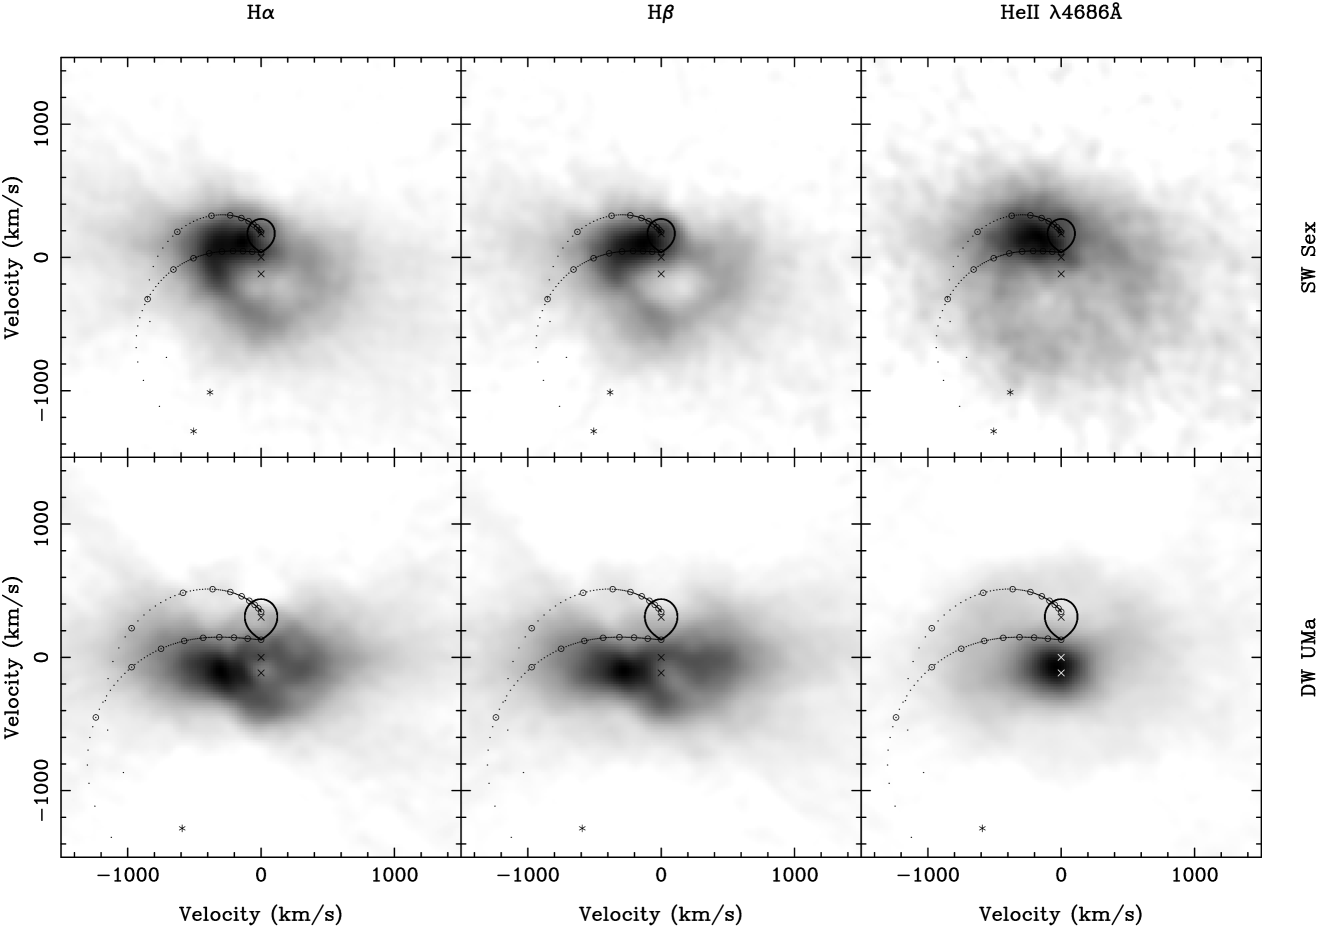
The Doppler maps (see Marsh (2001) for a review) of the three strongest lines in SW Sex and DW UMa are shown in Fig. 4. These have been computed from the trailed spectra shown in Fig. 3 with the eclipse spectra between orbital phases and removed.
In SW Sex, the Balmer and He II 4686Å tomograms are dominated by emission from a single component lying between the gas stream velocity and the Keplerian velocity along the gas stream. There is also some evidence for a ring of weak disc emission with km s-1 in the Balmer-line tomograms, but not in the He II 4686Å line. These tomograms are quite different to those presented by DMJ97, which showed Balmer emission from the inner face of the secondary star, and Balmer and He II 4686Å emission from the bright spot.
In DW UMa, the tomograms look very different. The Balmer lines show hints of a low velocity ring-like structure – the outer disc – but the position of peak intensity is around km s-1, well away from the anticipated ballistic stream trajectory. This emission in the quadrant is typical of SW Sex stars, e.g. see Kaitchuck et al. (1994). The He II 4686Å line appears to be centred on or near the white dwarf and shows no evidence for a ring of disc emission.
3.4.1 Tramlines in the trailed spectra
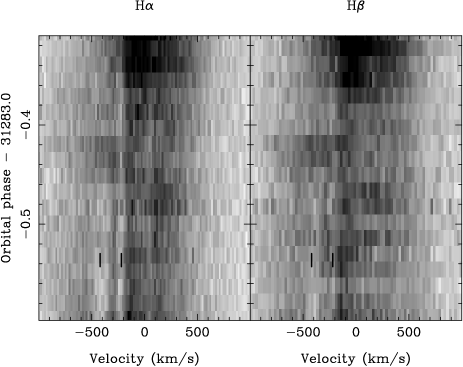
Looking carefully at the trailed spectra of H in DW UMa (Fig. 3), one notices vertical features running from when observations commenced, at orbital phase 31282.4, until orbital phase 31282.7, with possible reappearances at later times. At first we believed these narrow absorption lines at around –420 and –220 km s-1 (and possibly also at +50 km s-1) were due to telluric absorption, but they defied elimination. Careful inspection of the H trailed spectrum, however, then revealed similar features at similar velocities (at –420 and –220 km s-1 but not at +50 km s-1). We are therefore convinced that these blue-shifted ‘tramlines’ are real features of the spectra. Fig. 5 represents our best enhancement of these features. They do not appear in any of the other emission lines. QU Car has shown similar absorption features in H, albeit at higher velocities (Kafka et al., 2012). We discuss the origin of these tramlines and their significance for models of SW Sex stars in Section 4.2.
3.4.2 Flaring in the emission lines
The He II 4686Å trailed spectrum of DW UMa (Fig. 3) shows quasi-periodic flaring similar to the features seen more clearly in the trailed spectra of intermediate polars (IPs), e.g. FO Aqr (Marsh & Duck, 1996) and DQ Her (Bloemen et al., 2010). In the IPs, the flaring is believed to be due to disc-reprocessing of X-ray beams emitted from the magnetic poles of the asynchronously rotating white dwarf. Emission-line flaring has already been observed in the SW Sex stars BT Mon (Smith et al., 1998), LS Peg (Rodríguez-Gil et al., 2001), V533 Her (Rodríguez-Gil & Martínez-Pais, 2002), RX J1643.7+3402 (Rodríguez-Gil et al., 2009), BO Cet and V380 Oph (Rodríguez-Gil et al., 2007b), and interpreted as evidence for magnetic accretion in these systems.
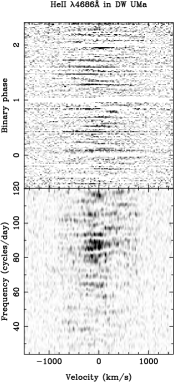
Because the flares are weak in DW UMa, we attempted to enhance them by removing the underlying line emission. This was achieved by median filtering the trailed spectrum in the time direction using a filter of significantly greater duration than the flares (15 spectra), and then subtracting the result from the original trailed spectrum. The enhanced trailed spectrum is displayed in the top panel of Fig. 6.
To determine if a periodicity is present, we removed the orbital motion from the enhanced trailed spectrum plotted in the upper panel of Fig. 6 and then computed the Lomb-Scargle periodogram at each wavelength (Press & Rybicki, 1989). The result is plotted in the bottom panel of Fig. 6. The periodograms do not show clear evidence for a single periodicity, but instead show a broad set of peaks with a maximum around 88.5 cycles/day ( s), indicating that the flaring is quasi-periodic, with tentative evidence that the flaring is strongest in the blue side of the He II 4686Å emission line. Unfortunately, the flares are too weak to do a more sophisticated analysis than that presented here.
3.4.3 Radial velocities and system parameters
We measured the radial velocities of the most prominent emission lines in SW Sex and DW UMa using both the double-Gaussian method of Schneider & Young (1980) and cross correlation with a single Gaussian. Following the methods outlined by Smith et al. (1998), we plotted the resulting data on diagnostic diagrams (Shafter et al., 1986) and modified light-centre diagrams (Marsh, 1988) in order to account for the observed phase shifts in the radial-velocity curves. Unfortunately, we found that none of the lines could be used to represent the motion of the white dwarf and hence it is not possible to determine reliably the system parameters of SW Sex and DW UMa with these data. DMJ97 and Groot et al. (2001) reached a similar conclusion in their studies of SW Sex and, to date, no reliable system parameters exist for this object. The system parameters of DW UMa, however, have been constrained during low-state observations by DJM94 and Araujo-Betancor et al. (2003), and via observations of the superhump period by Boyd & Gaensicke (2009).
4 Discussion
As the number of objects identified as SW Sex stars has increased over recent years, so the definition of SW Sex behaviour has become broader (see Rodríguez-Gil et al. (2007b) for a detailed description). Also, individual SW Sex stars can show very different behaviour from one observation to the next, due to the mass-accretion rate at the time of observation, e.g. compare the low-state observations of DW UMa (DJM94) with those of the high state (this paper). Even the proto-typical NL UX UMa has now been shown to exhibit SW Sex-like behaviour (Neustroev et al., 2011), leading one to suspect that all NLs could be classified as SW Sex stars if one looks long and hard enough. We are faced with having to explain a wide range of variable, high- related phenomena, making it difficult to produce a single, simple, self-consistent model for SW Sex stars.
Before discussing each object in detail, it is important to clarify the NL classification scheme. In the scheme described by Warner (1995), the non-magnetic NLs are sub-divided into two main classes, UX UMa stars and RW Tri stars, where the former have persistent, broad Balmer absorption-line spectra and the latter have pure emission-line spectra. As Warner (1995) notes, this difference is probably a matter of inclination (see also Fig. 4 of Dhillon 1996). However, it is probably also something to do with at the time of observation, e.g. UX UMa itself has been shown to exhibit an emission-line spectrum at certain times (Neustroev et al., 2011). Hence the sub-classification into UX UMa and RW Tri stars is not useful. Instead, we propose that all non-magnetic NLs (excluding the double-degenerate AM CVn systems) should be called UX UMa stars. Some UX UMa stars show low states, in which case they should also be referred to as VY Scl stars (or anti-dwarf novae), and some UX UMa stars show SW Sex characteristics, in which case they should also be referred to as SW Sex stars. Hence a particular UX UMa star can be a VY Scl star and an SW Sex star – DW UMa is one such example.
4.1 SW Sex
The observations of SW Sex presented in this paper appear to be relatively straight-forward to interpret. The Balmer and He II 4686Å emission lines are single peaked because they are formed in a single region in the disc, close to where the material in the gas stream and disc merge. The resulting radial-velocity curves reflect the motion of this region about the centre of mass, and hence exhibit phase shifts with respect to photometric minimum. The phase 0.5 absorption is not present in our observations of SW Sex, most probably due to a lower mass accretion rate (see Section 3.2).
The only difficulty is in explaining the emission-line light curves of Fig. 2 – if line emission from the vicinity of the bright spot is dominant, one would expect a deep, narrow eclipse that is not centred on phase 0. This is not observed in Fig. 2, but there are two caveats. First, the bright spot is not necessarily as dominant as it appears – sharp features tend to dominate Doppler maps making it difficult to assess their overall significance. Second, the emission-line light curves presented in Fig. 2 show the sum of the line flux at each phase, whereas it is more instructive to inspect how the fluxes of the different components that make up each emission line vary with phase in the trailed spectra (Fig. 3). The latter figure shows that the eclipse appears to be dominated by two components: the eclipse of an accretion disc centred on phase zero where, as expected, the blue-shifted region of the disc is eclipsed prior to the red-shifted region, and the eclipse of the dominant single-peaked bright-spot component, which starts earlier and finishes later than the accretion disc eclipse. The eclipse of the bright-spot component is too wide to be explained by obscuration by the secondary star. Instead, we propose that the bright spot overflows the disc edge and is obscured around primary eclipse by a raised disc rim that only allows the back portion of the disc to be seen. Such a self-occulting disc has already been proposed for DW UMa (Knigge et al., 2000) and the SW Sex star V348 Pup Froning et al. (2003), and would explain why the disc appears to show only a weak, narrow double-peaked profile. The relatively shallow depth of the Balmer-line eclipses can then be understood if the bright-spot emission region is vertically extended, as proposed by Groot et al. (2001) and Hoard et al. (2003), and modelled by Kunze et al. (2001), or if there is a region of line absorption in the disc that is obscured by the secondary star, as proposed by DMJ97 and observed by Groot et al. (2001).
4.2 DW UMa
The observations of DW UMa presented in this paper are quite different to those of SW Sex; in fact, DW UMa looks more like an SW Sex star than SW Sex itself, with Balmer emission from the quadrant in the Doppler maps and Balmer light curves showing only shallow eclipses and evidence for phase 0.5 absorption. Our observations of DW UMa have also presented us with two new features that have not been observed before in this object: flaring and tramlines in the trailed spectra. We must also take into account the fact that, unlike SW Sex, DW UMa has been extensively studied at ultraviolet and X-ray wavelengths (Knigge et al. 2000, Araujo-Betancor et al. 2003, Knigge et al. 2004, Hoard et al. 2003, Hoard et al. 2010) – these observations have shown conclusively that the inner disc of DW UMa is obscured by the flared edge of the disc.
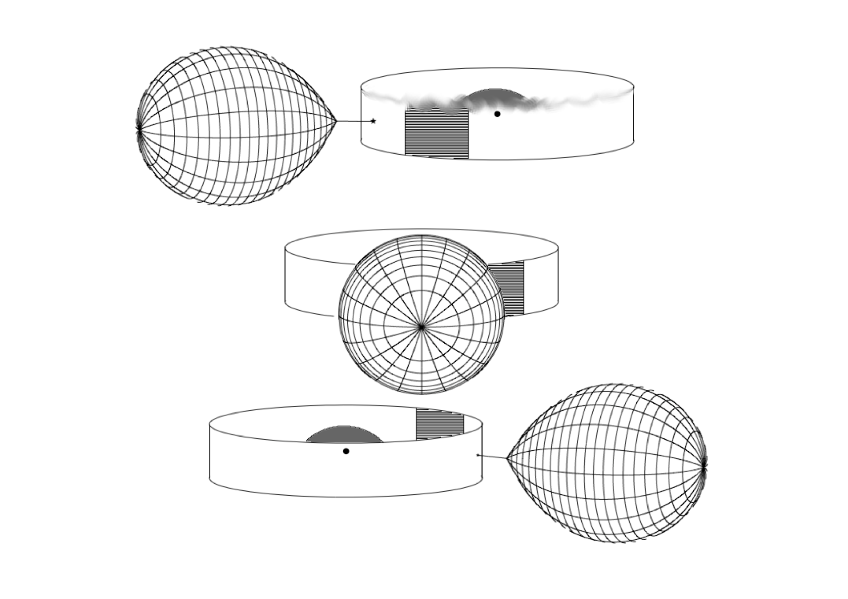
The above observational constraints lead us to the following model for DW UMa, shown pictorially in Fig. 7. The Doppler maps suggest that the bulk of the Balmer emission originates in a single post-shock region that lies downstream (along the disc edge) from the bright spot. Theoretical estimates by Spruit & Rutten (1998) suggest that it is feasible for this region to lie many tens of degrees in disc azimuth from the impact zone. Since our view of the disc is dominated by the rim, we see only very weak, narrow, double-peaked underlying emission from the face of the disc, as modelled by Knigge et al. (2000). Hence this model explains the single-peaked lines and the phase-shifted radial-velocity curves (or equivalently, their location in the quadrant of the Doppler maps). To explain the Balmer-line light curves, we again urge the reader to inspect the variation in the strength of the dominant single-peaked component in the trailed spectra (Fig. 3) rather than the summed line flux shown in Fig. 2. It can be seen that, as expected in our model, the line flux peaks around phase 0.8 when the post-impact region passes across the line of sight, and then gradually diminishes in strength due to foreshortening and obscuration by the secondary star. There is not a deep eclipse of the Balmer emission because it is dominated by emission from the disc rim and a substantial fraction of the rim remains visible at phase 0. The line flux then grows in strength again as we begin to see the back side of the post-impact region around phase 0.2, and peaks around phase 0.3 as the region passes across the line of sight on the back side of the disc. One would then expect a gradual reduction in line flux around phase 0.5 due to foreshortening, before it comes to a maximum again around phase 0.8. This is not observed. Instead, we see a dramatic drop in line flux around phase 0.5, which we attribute to absorption by material in our line of sight to the post-impact region – see below.
One of the major differences between SW Sex and DW UMa is the location of the He II 4686Å emission. In SW Sex it is more or less coincident with the Balmer emission in the outer disc, whereas in DW UMa the Doppler map and deep, narrow eclipse indicate that the He II 4686Å emission originates from close to the white dwarf. We know that we don’t see the white dwarf in the high state of DW UMa due to obscuration by the flared disc rim (Knigge et al., 2004), so the He II 4686Å most likely originates from a region lying above the inner disc, possibly in an accretion disc wind (as modelled by Hoare 1994). This region must be low enough to be almost totally eclipsed by the secondary star at phase 0, yet high enough to be visible above the disc rim at all other phases, which means that we must be viewing the He II 4686Å emission region through the upper edge of the disc rim. This edge is unlikely to be uniform, and hence at some phases we will see more of the emission region than at other phases, resulting in the apparent flaring that we have observed in the line. Of course, obscuration by a non-uniform disc edge would not explain the flaring that has apparently been seen in lower-inclination SW Sex stars (see Section 3.4.2).
An alternative explanation for the origin of the He II 4686Å emission in DW UMa is in a magnetic accretion curtain above the plane of the disc but close to the white dwarf (Williams 1989;Dhillon et al. 1991; Hoard et al. 2003). This model would explain why the line is single peaked and deeply eclipsed, and also provides a possible explanation for the flaring: an accretion hot spot on an asynchronously rotating white dwarf that periodically illuminates the He II 4686Å emission region in the curtain. The big problem with this interpretation is the lack of coherence in the pulsations.
There remain two observed features in DW UMa that we have not yet addressed: the phase 0.5 absorption and the tramlines. Both are absorption features and both are only visible in the Balmer lines. The tramlines are transient, narrow, blue-shifted features, whereas the phase 0.5 absorption repeats every orbit and occurs over a much wider range of velocity. The transient nature of the tramlines rules out absorption by widespread circumbinary gas, such as may have been ejected during ancient nova outbursts. Instead, the tramlines are more likely to be due to absorption by blobs of material recently ejected from the system which happen to be passing between us and the CV and are moving outwards. Honeycutt et al. (1986) invoked disc-wind material overflowing the point to explain the phase 0.5 absorption in SW Sex stars, and perhaps the same mechanism accounts for the tramlines. However, in this model, one would expect any absorption to occur after phase 0.5, whereas both the tramlines and phase 0.5 absorption start around phase 0.4. Another mechanism to produce the absorbing blobs of material is a magnetic propeller (Wynn et al., 1997), where accreting material encounters the rapidly spinning magnetosphere of the white dwarf and is ejected from the binary. In fact, Horne (1999) has proposed that a magnetic propeller can also explain the phase 0.5 absorption, where we view the system through the exit stream. Alternatively, the phase 0.5 absorption might be due to obscuration by a vertically raised structure in the disc, such as an overflowing gas stream – see Hellier (2000) and Hoard et al. (1998).
5 Conclusions
Using high-quality optical spectrophotometry, we have presented a detailed comparison of two of the founding members of the SW Sex class of CVs: SW Sex itself and DW UMa. We find that our view of both systems is dominated by the disc rim, which is largely responsible for the variations in line flux that we observe. The Balmer emission appears to originate from a region around the bright spot: in DW UMa this region lies further downstream from the impact point, and closer to the disc edge, than in SW Sex, indicative of differing mass transfer rates and/or disc densities in these two systems (see Hoard et al. (1998) for a discussion). We have discovered flaring in the He II 4686Å emission line and transient, blue-shifted tramlines in the Balmer lines of DW UMa. Both features can be explained if the system is magnetic, but the lack of a clear periodicity in the flares leads us to prefer a simpler model in which we are viewing the central regions of the disc through the non-uniform upper edge of the flared disc rim. The most marked difference between the two systems is the location of the He II 4686Å emission. In SW Sex, this line seems to originate from the bright spot region, whereas in DW UMa it originates from close to the white dwarf. Again, this could be indicative of a higher mass-transfer rate in SW Sex.
Acknowledgements
We thank Paul Groot for communicating his eclipse timings, and Keith Horne and Stuart Littlefair for useful discussions. We would also like to thank the anonymous referee for comments that improved the paper. The WHT is operated on the island of La Palma by the Isaac Newton Group in the Spanish Observatorio del Roque de los Muchachos of the Instituto de Astrofisica de Canarias.
References
- Araujo-Betancor et al. (2003) Araujo-Betancor S. et al., 2003, ApJ, 583, 437
- Ashoka et al. (1994) Ashoka B. N., Seetha S., Marar T. M. K., Kasturirangan K., Rao U. R., Bhattacharyya J. C., 1994, A&A, 283, 455
- Bloemen et al. (2010) Bloemen S., Marsh T. R., Steeghs D., Østensen R. H., 2010, MNRAS, 407, 1903
- Boyd (2012) Boyd D., 2012, JAAVSO, 198
- Boyd & Gaensicke (2009) Boyd D., Gaensicke B., 2009, Society for Astronomical Sciences Annual Symposium, 28, 127
- Carter et al. (1993) Carter D. et al., 1993, Wht – isis users’ manual. User Manual 24, Isaac Newton Group, La Palma
- Dhillon (1990) Dhillon V. S., 1990, PhD thesis, University of Sussex
- Dhillon (1996) Dhillon V. S., 1996, in Astrophysics and Space Science Library, Vol. 208, IAU Colloq. 158: Cataclysmic Variables and Related Objects, Evans A., Wood J. H., eds., p. 3
- Dhillon et al. (1994) Dhillon V. S., Jones D. H. P., Marsh T. R., 1994, MNRAS, 266, 859
- Dhillon et al. (1991) Dhillon V. S., Marsh T. R., Jones D. H. P., 1991, MNRAS, 252, 342
- Dhillon et al. (1997) Dhillon V. S., Marsh T. R., Jones D. H. P., 1997, MNRAS, 291, 694
- Froning et al. (2003) Froning C. S., Long K. S., Baptista R., 2003, AJ, 126, 964
- Groot et al. (2001) Groot P. J., Rutten R. G. M., van Paradijs J., 2001, A&A, 368, 183
- Hellier (2000) Hellier C., 2000, New Astronomy Reviews, 44, 131
- Hellier (2001) Hellier C., 2001, Cataclysmic Variable Stars. Springer, London
- Hoard et al. (2010) Hoard D. W. et al., 2010, AJ, 140, 1313
- Hoard et al. (2003) Hoard D. W., Szkody P., Froning C. S., Long K. S., Knigge C., 2003, AJ, 126, 2473
- Hoard et al. (1998) Hoard D. W., Szkody P., Still M. D., Smith R. C., Buckley D. A. H., 1998, MNRAS, 294, 689
- Hoare (1994) Hoare M. G., 1994, MNRAS, 267, 153
- Honeycutt et al. (1986) Honeycutt R. K., Schlegel E. M., Kaitchuck R. H., 1986, ApJ, 302, 388
- Horne (1999) Horne K., 1999, in Astronomical Society of the Pacific Conference Series, Vol. 157, Annapolis Workshop on Magnetic Cataclysmic Variables, Hellier C., Mukai K., eds., p. 349
- Horne & Marsh (1986) Horne K., Marsh T. R., 1986, MNRAS, 218, 761
- Kafka et al. (2012) Kafka S., Honeycutt K., Williams B., 2012, MNRAS, in press (arXiv:1206.6798)
- Kaitchuck et al. (1994) Kaitchuck R. H., Schlegel E. M., Honeycutt R. K., Horne K., Marsh T. R., White J. C., Mansperger C. S., 1994, ApJS, 93, 519
- Knigge et al. (2004) Knigge C., Araujo-Betancor S., Gänsicke B. T., Long K. S., Szkody P., Hoard D. W., Hynes R. I., Dhillon V. S., 2004, ApJ, 615, L129
- Knigge et al. (2011) Knigge C., Baraffe I., Patterson J., 2011, ApJS, 194, 28
- Knigge et al. (2000) Knigge C., Long K. S., Hoard D. W., Szkody P., Dhillon V. S., 2000, ApJ, 539, L49
- Kunze et al. (2001) Kunze S., Speith R., Hessman F. V., 2001, MNRAS, 322, 499
- Marsh (1988) Marsh T. R., 1988, MNRAS, 231, 1117
- Marsh (2001) Marsh T. R., 2001, in Lecture Notes in Physics, Berlin Springer Verlag, Vol. 573, Astrotomography, Indirect Imaging Methods in Observational Astronomy, Boffin H. M. J., Steeghs D., Cuypers J., eds., p. 1
- Marsh & Duck (1996) Marsh T. R., Duck S. R., 1996, New Astronomy, 1, 97
- Neustroev et al. (2011) Neustroev V. V., Suleimanov V. F., Borisov N. V., Belyakov K. V., Shearer A., 2011, MNRAS, 410, 963
- Oke & Gunn (1983) Oke J. B., Gunn J. E., 1983, ApJ, 266, 713
- Penning et al. (1984) Penning W. R., Ferguson D. H., McGraw J. T., Liebert J., Green R. F., 1984, ApJ, 276, 233
- Press & Rybicki (1989) Press W. H., Rybicki G. B., 1989, ApJ, 338, 277
- Rodríguez-Gil et al. (2001) Rodríguez-Gil P., Casares J., Martínez-Pais I. G., Hakala P., Steeghs D., 2001, ApJ, 548, L49
- Rodríguez-Gil et al. (2007a) Rodríguez-Gil P. et al., 2007a, MNRAS, 377, 1747
- Rodríguez-Gil & Martínez-Pais (2002) Rodríguez-Gil P., Martínez-Pais I. G., 2002, MNRAS, 337, 209
- Rodríguez-Gil et al. (2009) Rodríguez-Gil P., Martínez-Pais I. G., de la Cruz Rodríguez J., 2009, MNRAS, 395, 973
- Rodríguez-Gil et al. (2007b) Rodríguez-Gil P., Schmidtobreick L., Gänsicke B. T., 2007b, MNRAS, 374, 1359
- Rutten et al. (1992) Rutten R. G. M., van Paradijs J., Tinbergen J., 1992, A&A, 260, 213
- Schneider & Young (1980) Schneider D. P., Young P. J., 1980, ApJ, 238, 946
- Shafter et al. (1988) Shafter A. W., Hessman F. V., Zhang E. H., 1988, ApJ, 327, 248
- Shafter et al. (1986) Shafter A. W., Szkody P., Thorstensen J. R., 1986, ApJ, 308, 765
- Smith et al. (1998) Smith D. A., Dhillon V. S., Marsh T. R., 1998, MNRAS, 296, 465
- Spruit & Rutten (1998) Spruit H. C., Rutten R. G. M., 1998, MNRAS, 299, 768
- Szkody & Piché (1990) Szkody P., Piché F., 1990, ApJ, 361, 235
- Thorstensen et al. (1991) Thorstensen J. R., Ringwald F. A., Wade R. A., Schmidt G. D., Norsworthy J. E., 1991, AJ, 102, 272
- Warner (1995) Warner B., 1995, Cataclysmic Variable Stars. Cambridge University Press, Cambridge
- Williams (1989) Williams R. E., 1989, AJ, 97, 1752
- Wynn et al. (1997) Wynn G. A., King A. R., Horne K., 1997, MNRAS, 286, 436