Two-dimensional compressibility of surface states on three-dimensional topological insulators
Abstract
We develop a theory for the compressibility of the surface states of three-dimensional topological insulators and propose that surface probes of the compressibility via scanning single electron transistor microscopy will be a straightforward way to access the topological states without interference from the bulk states. We describe the single-particle nature of the surface states taking into account an accurate Hamiltonian for the bands and then include the contribution from electron–electron interactions and discuss the implications of the ultra-violet cutoff, including the universality of the exchange contribution when expressed in dimensionless units. We also compare the theory with experimentally obtained as extracted from angle-resolved photoemission spectroscopy measurements. Finally, we point out that interaction-driven renormalization of the Fermi velocity may be discernible via this technique.
Recently, there has been great interest in trying to engineer materials with topologically protected states because of the applications that such states may find in quantum computing. In particular, it was predicted that certain three-dimensional (3D) layered crystals with strong spin-orbit coupling and an inverted conduction band would have an insulating band gap in the bulk, but topologically robust conducting surface states with linear low-energy dispersion protected by time-reversal symmetry. Zhang et al. (2009) Angle-resolved photoemission spectroscopy (ARPES) experiments on crystals such as Bi2Te3 and Bi2Se3 have proven the existence of these midgap surface states with nearly linear spectra. Chen et al. (2009); Zhang et al. (2010); Xia et al. (2009); Zhu et al. (2011) However, in most current samples, the Fermi energy is well above the bulk gap, meaning that transport measurements of the surface states are difficult because current can also flow in the bulk of the crystal, Steinberg et al. (2010) i.e., the bulk is a conductor rather than an insulator even at low temperature.Butch et al. (2010) This can be mitigated to some extent by using thin films of the topological insulator (TI) crystalKim et al. (2012) or by doping the crystal to compensate for the bulk conduction.Ren et al. (2012) Therefore, it is essential that methods are found to both control and characterize these topologically protected states.
In this Rapid Communication, we propose using single electron transistor (SET) microscopy Yoo et al. (1997); Yacoby et al. (1999); Martin et al. (2008) as a way of mitigating the effect of the bulk states by approaching the surface directly. Local capacitance measurements made via this technique can be converted straightforwardly into the quantity (where is the chemical potential and is the carrier density in the surface state), which is directly linked to the band structure and the electronic compressibility. A great advantage of measuring this thermodynamic compressibility is that it is a probe of the ground-state properties, which incorporates single-particle many-body renormalization directly, Li et al. (2011) and thus quantitative information both about the single-particle (SP) band structure and many-body renormalization are obtained as a function of 2D carrier density (or, equivalently, the 2D Fermi energy of the surface states). We begin by calculating for two different commonly used approximations for the noninteracting band structure of the Hamiltonian for the surface states of TIs such as Bi2Se3 and Bi2Te3 and then take into account the electron-electron interaction, demonstrating that this contribution is universal and identical for both band structure approximations when expressed in dimensionless units. However, we show that the high dielectric constant of these materials reduces the quantitative effect of the interactions at high density. We also argue that it may be possible to observe renormalization of the quasiparticle Fermi velocity at sufficiently low density by this technique. We then compare the results of our analytical SP calculations to estimations of extracted from ARPES measurements of the band structure. Finally, we comment on the role of disorder and charge inhomogeneity on in these systems.
If the surface corresponds to the (111) crystal direction (i.e., parallel to the layered structure of the lattice), then the simplest approximation for the band structure is the commonly used linear form given by the Hamiltonian Zhang et al. (2009) , where is the band velocity, is the two-dimensional wave vector in the plane of the surface, and are Pauli matrices in the real spin space. The spectrum of this Hamiltonian is trivially the massless Dirac dispersion given by , where denotes the band. The corresponding eigenvectors are two-component spinors in the spin space. The 2D density of carriers in the SP limit is given by , where is the Fermi wave vector and, as a matter of convention, we say that zero density corresponds to the chemical potential being located at the Dirac point. Elementary manipulations show that
| (1) |

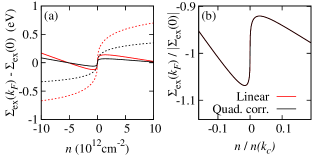
A more sophisticated approximation for the band Hamiltonian including the curvature in the valence band which is noticeable in the ARPES data is , where is the effective mass of the carriers Culcer et al. (2010) with spectrum . These band structures are shown in Fig. 1(a). In the case with the quadratic correction, there is an unphysical turning point in the valence band, which demands that some care must be taken when describing this band. The turning point is located at , the energy at this wave vector is , and the associated density is . Hence, defining wave vectors, energies, or densities which are greater in magnitude than , , and requires a specific definition of the band structure and this will become vital when the interaction effects are incorporated. We defer further discussion of this specific point until it is relevant. However, for , we use the relationship for the density above, and find
| (2) |
where denotes the sign of the argument. Figure 1(b) shows the single-particle for each approximation as a function of density. Unless otherwise stated, we use , ( is the electron mass), and throughout this paper. The quadratic correction preserves the dominant behavior at low density, but introduces an asymmetry between the conduction and valence bands. In addition, goes to zero at .
Note that some papers include a cubic term in the Hamiltonian, which introduces a hexagonal distortion to the Fermi surface.Fu (2009); Baum and Stern (2012) However, our calculations show that this contribution makes very little difference to the single-particle in the range of Fermi energy which we are interested in, and so we do not consider it further.
We now include the effect of the electron-electron interaction on the compressibility. Evaluating the self-energy contribution from the exchange interaction gives
| (3) |
where is the two-dimensional Fourier-transformed unscreened Coulomb interaction, is the static dielectric constant of the environment, is the occupancy of the state with wave vector in band , and is the angle that the wave vector makes with the axis. It is well known that for the compressibility, the exchange energy (the Hartree-Fock term) is the dominant interaction correction, and this is even more true for TI systems because of their very large background dielectric constant. Therefore, we anticipate very small interaction corrections beyond exchange in this problem. Note that the only place that the band structure enters into this expression is in the occupancy factors so that it is applicable to systems described by both and . At zero temperature, the angular part of the integration of can be computed analytically and yields
where the appropriate SP energy must be inserted into the step function,
and are complete elliptic integrals of the first and second kind, and . The radial integral must be evaluated numerically. We note that the exchange integral of Eq. (3) has an ultraviolet high-momentum divergence arising from the linear dispersion, which must be regularized through a high wave vector cutoff . As is usual in condensed matter physics, there is a real cutoff in the momentum arising from the lattice structure and, therefore, , implying that the interaction strength depends explicitly on the short-distance lattice cutoff in the theory. To illustrate the qualitative features of the physics and to determine the dependence of on , we start by describing the case in which interactions are the strongest. This function is shown in Fig. 2(a) for both the linear band and the band with a quadratic correction for two different values of the ultraviolet cutoff. Details of the definition of the band structure for the quadratic correction are given below. In Fig. 2(b), the same data is shown but the units are scaled to demonstrate how the self-energy depends on the cutoff . The linear and quadratic bands give identical results when the self-energy is scaled by its value at zero density. We emphasize that this result shows the universality of the exchange contribution, which is reminiscent of similar results found in semiconductor heterostructures. Das Sarma et al. (1990); Hwang and Das Sarma (1998) The independence of the dimensionless many-body corrections of the details of the TI band structure is an important new result of our work.
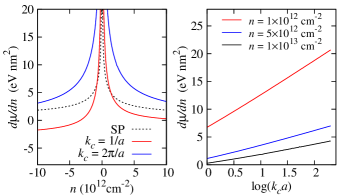
The exchange self-energy is incorporated into the calculation for in the following way. The Hartree-Fock chemical potential is the sum of the SP kinetic energy and the exchange self-energy: and the corresponding compressibility is given by , which may be computed numerically. When applied to the linear band structure associated with , the expression in Eq. (3) contains an ultraviolet divergence and so the value of the high-frequency cutoff becomes important, as hinted at in Fig. 2. In Fig. 3(a), we show for the linear band with the exchange contribution for two different physically reasonable values of . In all cases, the behavior persists at low density. For , the exchange causes a reduction in relative to the SP case for all but the lowest densities and may become negative for large valence band doping. In contrast, gives an enhancement to . This indicates that the precise value of the ultraviolet has an important quantitative effect on . In Fig. 3(b), we show the dependence of on for three different values of the density. Noting the logarithmic scale on the axis, we see that . Hence, in order to make quantitative predictions of the behavior of at finite density, some physical intuition must be used for choosing the “correct” value of . It has also been shown that Baum and Stern (2012) the cubic term, which we do not consider, can introduce a scale above which the cutoff dependence is negligible for the calculation of magnetization. In our case, the integrand remains finite at all even with the cubic term, but the value of extracted from this reasoning could be imposed on the self-energy calculation. The logarithmic dependence of the interaction effect on translates into a slow logarithmic renormalization of the coupling strength in units of which could manifest itself at very low carrier densities. 111Note that in graphene, the cut-off may be set by stipulating that number of states in each band corresponds to one electron per atom but no such reasoning exists for TI crystals.
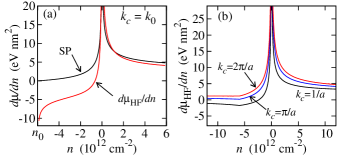
For the quadratic band, Eq. (3) still holds, but the appropriate dispersion must be used in the Fermi function. The shape of the valence band introduces a further complication. Taken at face value, the band minimum at should be interpreted as producing a Fermi surface with nontrivial topology, and contributions to should be included from both branches of the valence band. However, this does not correspond to the experimental data (see, for example, Ref. Hasan and Kane, 2010) where the turning point is not seen. The first (and most intuitive choice) is to set . This may be physically reasonable because the topological surface bands typically merge with the bulk bands at roughly this wave vector. Another possibility is to artificially turn the band structure for in the valence band [as illustrated by the dotted line in Fig. 1(a)] so that for we have . Then, from a technical point of view, can be set arbitrarily high and the quadratically dispersing nature of the band is retained. Figure 4(a) shows the first of these cases. Since is relatively small, the density can reach the regime where the self-energy is decreasing rapidly, . In that case, the negative slope of the exchange energy is stronger than the positive slope of the SP chemical potential so that is a decreasing function of for , implying that is negative. We believe that these questions about the precise value of the ultraviolet cutoff in this problem can actually be answered through a careful comparison between experiment and theory on the TI compressibility.
For the turned band structure with , the evolution of with increasing means that the sign of the exchange contribution can be positive or negative. For a given density, we have , as was the case for the linear band.
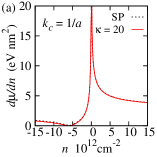
The static dielectric constant of crystals such as Bi2Se3 and Bi2Te3 is estimated to be Richter and Becker (1977); Butch et al. (2010) greater than 50, reducing the strength of the interactions. We assume that the effective dielectric constant is the average of that in the material and the vacuum, and take a physically reasonable value of . Figure 5 shows that the exchange contribution to is reduced so much that it is essentially nonexistent. Hence, for the purposes of examining the compressibility of the surface states, the SP calculation is likely to be quantitatively sufficient.
At this point, we pause to comment on another experimental manifestation of the exchange self-energy. In principle, the Fermi velocity is renormalized by this interaction Hwang et al. (2007); Das Sarma and Hwang (2012) and there has been some experimental hint of this in graphene in both zero magnetic field Elias et al. (2011) and high magnetic fields. Jiang et al. (2007); Li et al. (2009); Zhou et al. (2006) The renormalized quasiparticle velocity can be written as
with , and thus the interaction-induced correction will be proportional to . Of course, the Fermi velocity measured in experiment includes this renormalization so it is not directly measurable, but since the self-energy is a nonmonotonic function of the wave vector, its effect may be seen by a density-dependent deviation of the Fermi velocity from a constant value which represents the combination of the SP and mean interaction contributions. Such a nonlinear reconstruction of the 2D TI Fermi surface at low carrier density will be a direct manifestation of its Dirac spectrum and the associated ultraviolet renormalization effect familiar in quantum electrodynamics.
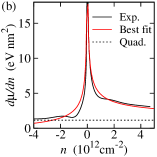
We can also extract from ARPES measurements of the band structure. Digitizing curves from Zhu et al. Zhu et al. (2011) gives the band structure of Bi2Se3 in the direction from which we can numerically extract for comparison to theory. To combat difficulties caused by imperfections in the experimental data, we apply a Gaussian smoothing convolution with a width to both branches shown in the plot and take the average of the two to arrive at the approximate band structure. The density is then computed and a numerical derivative of the chemical potential with respect to the density may then be taken. The results of this procedure are shown in Fig. 5(b) along with a least-squares best fit of the quadratic correction dispersion using and as fitting parameters from the conduction band data. This fitting procedure yielded and , both of which are larger than the current common estimates for these parameters in Bi2Se3. The dashed line corresponds to the predicted for a purely quadratic band. This indicates that the contribution from the quadratic part of the band is dominated by the linearity of the band structure over the whole experimentally pertinent range of carrier density, clearly establishing that the Dirac spectrum is dominating the physics in these systems.
One likely challenge to using the compressibility to investigate the topological surface states is the observed existence of substantial disorder-induced inhomogeneity in the charge landscape of the surface. Beidenkopf et al. (2011) Surface probes such as scanning tunneling microscopy have shown that the screening of an external disorder potential created by charged impurities in the lattice of Bi2Te3 and Bi2Se3 lead to the formation of “puddles” of electron and holes with spatial extent of the order of and associated fluctuations in the local chemical potential of approximately . This fluctuation has previously been investigated in the context of charge transport,Adam et al. (2012) but in the case of our proposed SET measurements, it should be pointed out that the area of the sample which influences the tip has a radiusYoo et al. (1997); Yacoby et al. (1999) of the order of , which is much larger than one puddle. Therefore, the SET will experience some averaged field corresponding to the inhomogeneous landscape. The effect of the inhomogeneity is that even when the global average of the density is zero, the local density is always finite and may be positive or negative. Therefore, in the inhomogeneous case, the local density never approaches zero and, hence, the divergence is curtailed. At high density, the slow change of with density implies that the inhomogeneity will have little effect on the measured compressibility. Therefore, the extraction of band parameters from SET data is likely to be most accurate at higher density.
In this Rapid Communication, we have proposed that a capacitive surface probe such as SET microscopy will reveal the properties of the topological surface states of crystals such as Bi2Te3 and Bi2Se3 via measurement of . We have analytically computed the SP contribution to for model band structures and described the role that electron-electron interactions and charge inhomogeneity in the crystal will play. In summary, the high dielectric constant implies that the quantitative effect of interactions is negligible (although, at low density, there is some hope of detecting a renormalization of the Fermi velocity due to electron-electron interactions) and the inhomogeneity can be accounted for via a straightforward phenomenological averaging technique which will result in the low-density divergence being cut off. We have established that compressibility measurements, when compared with theory, could provide valuable information about both SP and many-body properties of 2D TI surface states.
We thank the U.S. ONR for support.
References
- Zhang et al. (2009) H. Zhang, C.-X. Liu, X.-L. Qi, X. Dai, Z. Fang, and S.-C. Zhang, Nat Phys 5, 438 (2009).
- Chen et al. (2009) Y. L. Chen, J. G. Analytis, J.-H. Chu, Z. K. Liu, S.-K. Mo, X. L. Qi, H. J. Zhang, D. H. Lu, X. Dai, Z. Fang, S. C. Zhang, I. R. Fisher, Z. Hussain, and Z.-X. Shen, Science 325, 178 (2009).
- Zhang et al. (2010) Y. Zhang, K. He, C.-Z. Chang, C.-L. Song, L.-L. Wang, X. Chen, J.-F. Jia, Z. Fang, X. Dai, W.-Y. Shan, S.-Q. Shen, Q. Niu, X.-L. Qi, S.-C. Zhang, X.-C. Ma, and Q.-K. Xue, Nat Phys 6, 584 (2010).
- Xia et al. (2009) Y. Xia, D. Qian, D. Hsieh, L. Wray, A. Pal, H. Lin, A. Bansil, D. Grauer, Y. S. Hor, R. J. Cava, and M. Z. Hasan, Nat Phys 5, 398 (2009).
- Zhu et al. (2011) Z.-H. Zhu, G. Levy, B. Ludbrook, C. N. Veenstra, J. A. Rosen, R. Comin, D. Wong, P. Dosanjh, A. Ubaldini, P. Syers, N. P. Butch, J. Paglione, I. S. Elfimov, and A. Damascelli, Phys. Rev. Lett. 107, 186405 (2011).
- Steinberg et al. (2010) H. Steinberg, D. R. Gardner, Y. S. Lee, and P. Jarillo-Herrero, Nano Lett. 10, 5032 (2010).
- Butch et al. (2010) N. P. Butch, K. Kirshenbaum, P. Syers, A. B. Sushkov, G. S. Jenkins, H. D. Drew, and J. Paglione, Phys. Rev. B 81, 241301 (2010).
- Kim et al. (2012) D. Kim, S. Cho, N. P. Butch, P. Syers, K. Kirshenbaum, S. Adam, J. Paglione, and M. S. Fuhrer, Nat. Phys. 8, 460 (2012).
- Ren et al. (2012) Z. Ren, A. A. Taskin, S. Sasaki, K. Segawa, and Y. Ando, Phys. Rev. B 85, 155301 (2012).
- Yoo et al. (1997) M. J. Yoo, T. A. Fulton, H. F. Hess, R. L. Willett, L. N. Dunkleberger, R. J. Chichester, L. N. Pfeiffer, and K. W. West, Science 276, 579 (1997).
- Yacoby et al. (1999) A. Yacoby, H. Hess, T. Fulton, L. Pfeiffer, and K. West, Solid State Communications 111, 1 (1999).
- Martin et al. (2008) J. Martin, N. Akerman, G. Ulbricht, T. Lohmann, J. H. Smet, K. von Klitzing, and A. Yacoby, Nat. Phys. 4, 144 (2008).
- Li et al. (2011) Q. Li, E. H. Hwang, and S. Das Sarma, Phys. Rev. B 84, 235407 (2011).
- Culcer et al. (2010) D. Culcer, E. H. Hwang, T. D. Stanescu, and S. Das Sarma, Phys. Rev. B 82, 155457 (2010).
- Fu (2009) L. Fu, Phys. Rev. Lett. 103, 266801 (2009).
- Baum and Stern (2012) Y. Baum and A. Stern, Phys. Rev. B 85, 121105 (2012).
- Das Sarma et al. (1990) S. Das Sarma, R. Jalabert, and S.-R. E. Yang, Phys. Rev. B 41, 8288 (1990).
- Hwang and Das Sarma (1998) E. H. Hwang and S. Das Sarma, Phys. Rev. B 58, R1738 (1998).
- Note (1) Note that in graphene, the cut-off may be set by stipulating that number of states in each band corresponds to one electron per atom but no such reasoning exists for TI crystals.
- Hasan and Kane (2010) M. Z. Hasan and C. L. Kane, Rev. Mod. Phys. 82, 3045 (2010).
- Richter and Becker (1977) W. Richter and C. R. Becker, physica status solidi (b) 84, 619 (1977).
- Hwang et al. (2007) E. H. Hwang, B. Y.-K. Hu, and S. Das Sarma, Phys. Rev. Lett. 99, 226801 (2007).
- Das Sarma and Hwang (2012) S. Das Sarma and E. H. Hwang, ArXiv e-prints (2012), arXiv:1203.2627 [cond-mat.mes-hall] .
- Elias et al. (2011) D. C. Elias, R. V. Gorbachev, A. S. Mayorov, S. V. Morozov, A. A. Zhukov, P. Blake, L. A. Ponomarenko, I. V. Grigorieva, K. S. Novoselov, F. Guinea, and A. K. Geim, Nat Phys 7, 701 (2011).
- Jiang et al. (2007) Z. Jiang, E. A. Henriksen, L. C. Tung, Y.-J. Wang, M. E. Schwartz, M. Y. Han, P. Kim, and H. L. Stormer, Phys. Rev. Lett. 98, 197403 (2007).
- Li et al. (2009) G. Li, A. Luican, and E. Y. Andrei, Phys. Rev. Lett. 102, 176804 (2009).
- Zhou et al. (2006) S. Y. Zhou, G.-H. Gweon, J. Graf, A. V. Fedorov, C. D. Spataru, R. D. Diehl, Y. Kopelevich, D.-H. Lee, S. G. Louie, and A. Lanzara, Nat Phys 2, 595 (2006).
- Beidenkopf et al. (2011) H. Beidenkopf, P. Roushan, J. Seo, L. Gorman, I. Drozdov, Y. S. Hor, R. J. Cava, and A. Yazdani, Nat Phys 7, 939 (2011).
- Adam et al. (2012) S. Adam, E. H. Hwang, and S. Das Sarma, Phys. Rev. B 85, 235413 (2012).