Prospects for a radio air-shower detector at South Pole
Abstract
IceCube is currently not only the largest neutrino telescope but also one of the world’s most competitive instruments for studying cosmic rays in the PeV to EeV regime where the transition from galactic to extra-galactic sources should occur. Further augmenting this observatory with an array of radio sensors in the 10-100 regime will additionally permit observation of the geomagnetic radio emission from the air shower. Yielding complementary information on the shower development a triple-technology array consisting of radio sensors, the ground sampling stations of IceTop and the in-ice optical modules of IceCube, should significantly improve the understanding of cosmic rays, as well as enhance many aspects of the physics reach of the observatory. Here we present first results from two exploratory setups deployed at the South Pole. Noise measurements from data taken in two consecutive seasons show a very good agreement of the predicted and observed response of the antennas designed specifically for this purpose. The radio background is found to be highly dominated by galactic noise with a striking absence of anthropogenic radio emitters in the frequency band from 25-300. Motivated by the excellent suitability of the location, we present first performance studies of a proposed Radio Air-Shower Test Array (RASTA) using detailed MonteCarlo simulation and discuss the prospects for its installation.
Keywords:
Cosmic rays, air-showers, radio detection, South Pole:
96.50.sd, 07.57.Kp, 93.30.Ca1 Introduction
Detection of air-showers through geomagnetic radio emission in the regime offers various advantages compared to other detection technologies. In contrast to ground-based shower sampling, the radio signal represents the integral shower development and hence promises excellent energy resolution. In contrast to fluorescence measurements, high duty-cycles can be achieved with a low-cost technology. Further, the lateral distribution of the radio signal will provide an independent measure of the depth of the shower maximum. Consequently, radio extensions are now being developed in many existing air-shower experiments.
The IceCube observatory at the South Pole employs a 1 volume, instrumented with an array of photo-sensors as an ice-Cherenkov detector mainly targeted at the detection of astrophysical neutrinos. Installed at a depth between 1450-2450, it is also sensitive to muons from air-showers above an energy at the surface of . This detector is complemented by a surface array of ice-Cherenkov tanks that sample electrons and muons with a threshold of from air-showers. Coincident detection of high-energy muons in ice and the shower particles on the surface provides a unique mechanism to study cosmic ray composition from the knee to the ankle with a primary threshold of , albeit with a limited aperture of .
Extending this observatory with a large array of radio antennas can significantly enhance the physics potential of this observatory Böser et al. (2012): adding a third detection technology with complementary shower observables will permit significant reduction of the systematic uncertainties in the composition measurement. Extending to several , it may serve as a veto for cosmic ray air-showers, and thus enhance the neutrino sensitivity in the southern hemisphere. Inverting the veto logic, it may also serve as an instrument for ultra-high energy gamma-rays by searching for muon-poor air-showers.
In this paper, we show results from exploratory studies of the South Pole for the radio detection technique, as well as a first simulation of the performance that can be achieved with a dedicated test array. We also discuss the prospects for this approach.
2 Site exploration
To establish the feasibility of radio air-shower detection at the South Pole beyond the proof of principle provided by the LOPESFalcke et al. (2005), CodalemaRavel (2012) and AERAFliescher (2012) experiments, two question applying to this particular location must be addressed: is it possible to build antennas that operate reliably at the environmental low temperatures; and does the ambient noise permit a sufficiently low trigger threshold.
2.1 Antenna design
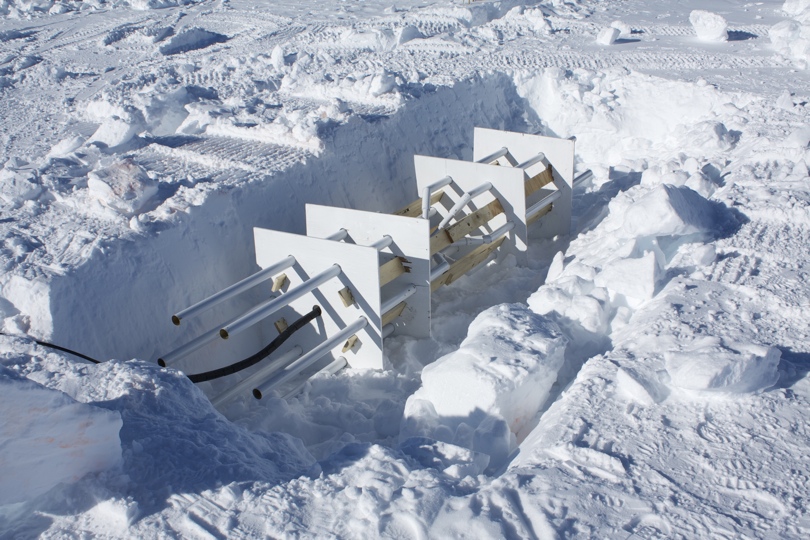
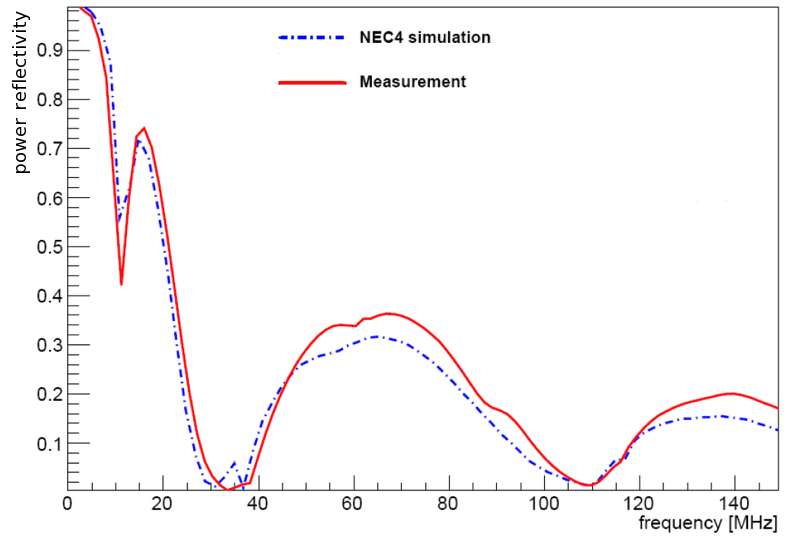
The harsh environment at the South Pole, in particular the low temperatures, pose significant challenges to antenna construction. On the other hand, the good radio transparency of the upper most layer of the glacier, or firn, allows to deploy antennas where temperatures are stable at throughout the year and they are not affected by occasional high winds. A number of designs have been studied for this environment Vehring (2011) using NEC4 simulations. It was found that the fat tube-dipole, shown in Figure 1, offers a low power reflectivity in the frequency range above 25 as well as a low group delay, matching the predictions from NEC4 simulations well (c.f. Figure 2). Manufactured from 5 copper tubes with a shrinking diameter towards the feedpoint, this design has proven very robust for the six antennas of this type deployed at the South Pole thus far.
2.2 Experimental setups
To study the radio environment for air-shower detection, two experimental setups have been installed in the 2010/2011 and 2011/2012 polar seasons. Co-deployment with the ARA installations, and use of their DAQ system, allowed for a minimum investment. In the first season, two fat tube-dipole antennas have been deployed at a distance of 30.5 and at a relative azimuthal orientation of 21. Both antennas were buried in trenches at a depth of , and the trenches were backfilled with snow. The antennas are connected to the ARA-testbed DAQ system Allison et al. (2012), where they are read out with a sampling rate of up to 2 at 12 bit and a bandwidth of 30-300. In this setup, no dedicated trigger is available for these two surface antennas, so only events from a forced trigger every 2 enter the analysis. In the second setup, four fat tube-dipole antennas were deployed, approximately in an equilateral triangle with one antenna in the center. Three of these antennas are aligned east-west, within of the magnetic field, while one antenna is offset to that direction by +22. To avoid different signal propagation times, all antennas are connected to the central DAQ by 200 of highly shielded cables and an overall gain of 74. In this setup the signal from the four surface antennas in the 25-120 band is diplexed with the signal above 120 from the V-pol antennas deployed in the ice for readout. In addition to the in-ice and minimum bias triggers, a dedicated surface trigger has been operated in a 3-out-of-4 mode with individual thresholds adjusted per channel. Due to low-temperature instability of the commercial single-board computer employed in the DAQ system, only a limited amount of data has been collected with this setup from Jan, 26th to May, 3rd 2012, with an uptime of less than 50%.
2.3 Noise measurement
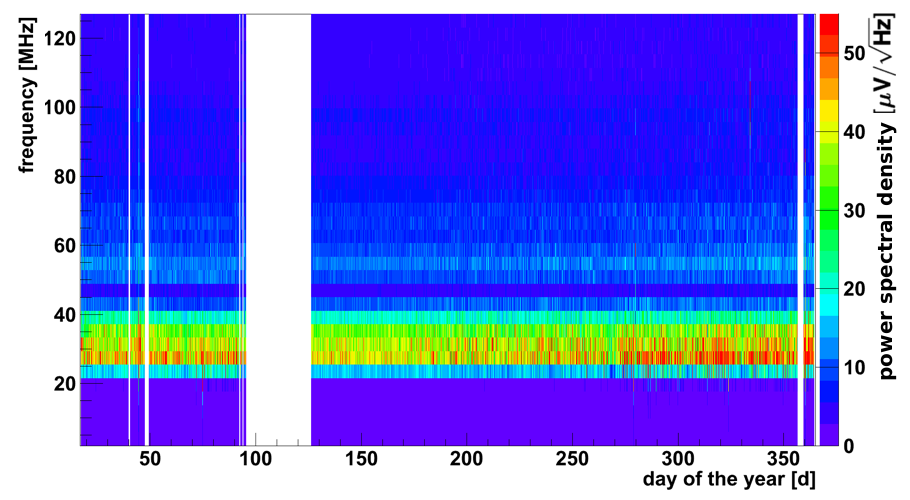
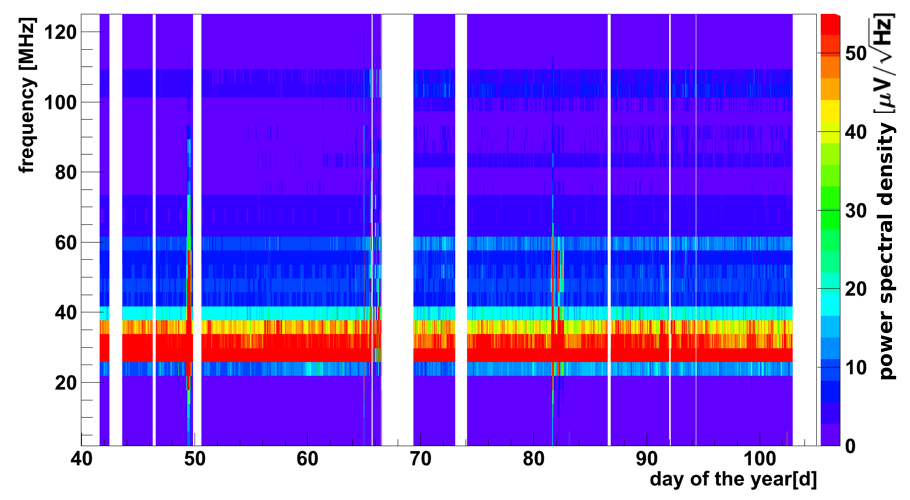
Figure 3 shows the power spectral density, averaged over all waveforms, obtained in one hour as a function of the day from the forced trigger data in 2011. The signal is dominated by the falling spectrum of galactic noise from the low-pass boundary at 25 up to about 90, above which it is limited by thermal noise in the DAQ chain. A single notch filter at 46.4 is used to mitigate the signal of the meteor radar Forbes et al. (1999). The absence of any other features and the very low overall levels reflect the stability of the conditions at South Pole and the absence of any steady-mode radio transmitters. Figure 4 shows the power spectral density averaged over one hour for the surface triggered data obtained in 2012. The enhancement of the galactic noise band and the absence of contributions in the frequency range above 50 indicates that most triggers are caused by fluctuations in the thermal noise. Broadband emission not consistent with galactic noise is only observed for three short time ranges, possibly associated with exceptional air-craft communication activity. This absence of transient broadband emitters makes South Pole a unique location for the radio detection of air-showers.
We have also studied the correlation of the noise with wind speed, air pressure on the ground and air temperature and found no significant dependence. A dependence of the trigger rate on the wind speed, as previously observed with radio antennas deployed with the RICE setup Kravchenko et al. (2012), has not been confirmed. This supports the hypothesis that these arise from discharge events on structures above the firn surface that are absent in the setup discussed here.
To establish the overall calibration of the system we have used the galactic noise model by de Olivera de Oliveira-Costa et al. (2008), that provides interpolated full-sky intensity maps in the range from 10 to 10. Convolving these maps for each frequency with the antenna response taken from the NEC4 simulation described in section 2.1, we obtain a noise spectrum prediction. Noise values for each component in the DAQ system are taken from manufacturer information and are traced through the full chain. Above 25, the resultant spectrum agrees to within with the measured spectrum. Since the antenna sensitivity is not isotropic in azimuth, this agreements only holds if averaging the noise spectra over time periods much longer than one day. By convolving the galactic noise prediction with the antenna response instead for a particular antenna orientation, i.e. a particular time of the day, a time dependant noise level is expected in each frequency band. Figure 5 shows the variation in noise RMS amplitudes for three frequency bands normalized to the daily average in each band. Higher noise levels are predicted in the lower frequency band when the antenna is aligned perpendicular to the direction of the galactic center (for co-polarized radio-waves). However, for the highest frequency band, the largest noise levels are predicted when the antenna is oriented towards the galactic center (in cross-polarized mode). The inversion point, defined as the frequency at which the antenna becomes more sensitive in cross-polarized than in co-polarized mode, as well as the amplitude of the azimuthal modulation of the antenna response, function will depend on the electrical permittivity of the surrounding snow. From a fit procedure we find the best agreement with the measured noise level variations for a permittivity of at . Different approximations have been proposed for the dependence of the permittivity of snow on the snow density Stiles and Ulaby (1980); Sihyola et al. (1985), suggesting a corresponding snow density of . Values of have been measured for pristine snow at the South Pole at a depth of one meter, but lower values are plausible for the backfilled trenches in which the antennas are located.

3 Performance estimate
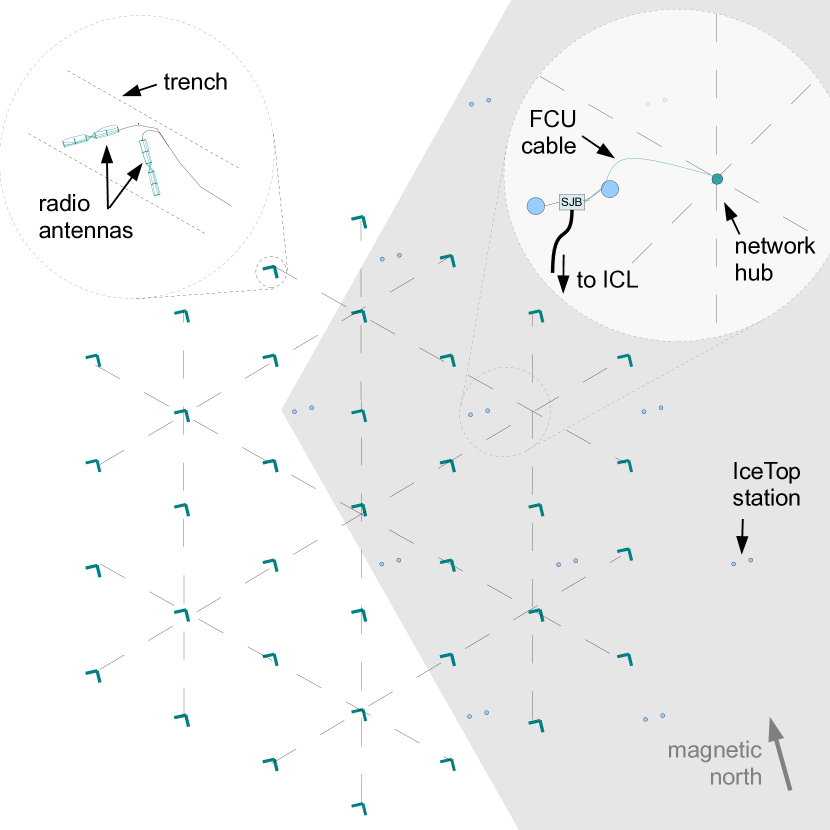
Given the ideal environmental conditions outlined above, a Radio Air-Shower Test Array (RASTA) has been proposed to establish the feasibility of radio air-shower detection and study the physics potential Böser et al. (2012). A dedicated simulation has been developed to study the response. The proposed detector geometry, shown in figure 6, consists of 74 antennas arranged in pairs in a hexagonal grid with a spacing of 62.5, half the grid size of the IceTop array. In each pair, one antenna is oriented north-south and the other east-west relative to the geomagnetic field.
3.1 Simulation chain
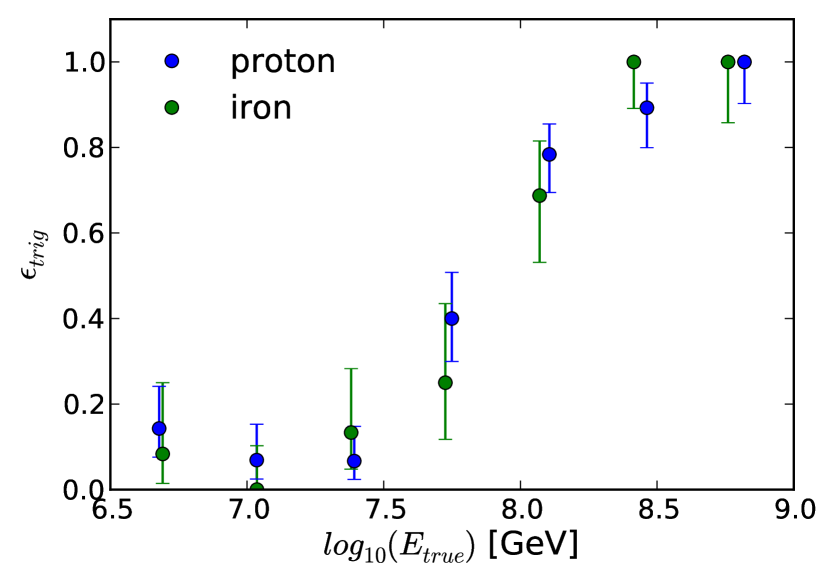
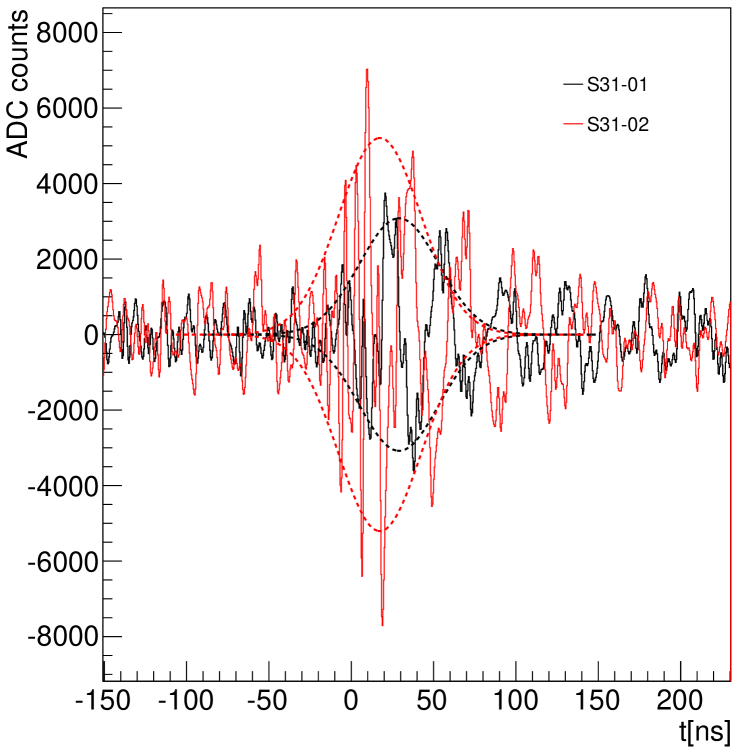
Three different emission models have been used as inputs for the simulation chain: MGMR Scholten et al. (2010), REAS3.0 Ludwig and Huege (2010) and CoREAS Huege (2012). For each model, we have simulated several hundred events in the energy range between 3 to 1 and with zenith angles up to 60. The electric field as a function of time is sampled at each antenna pair location and folded with the antenna response (c.f. section 2.1). Galactic noise, following the model of Cane Cane (1979), and thermal noise are added assuming a feedpoint impedance of 50. We simulate a second order bandpass filter from 25-300 and assume digitization with 300 at 16-bit resolution. An event is defined to trigger the array if 4 antennas in 4 distinct pairs have a signal 5 times above the thermal noise within a time window of 1. A sample trace of the simulated signal after digitization is shown in Figure 8. Figure 7 shows the trigger efficiency for proton and iron primaries from the CoREAS simulation which includes refractive index variation throughout the atmosphere. A 50% efficiency is reached at , while for the REAS3.0 simulation, that assumes a constant refractive index, we find a 50% efficiency at . It should be noted that, due to the strong dependence of the signal strength on the orientation w.r.t to the Earth’s magnetic field and the zenith angle, a fraction of the events will also be detected at energies well below this threshold and with a steeply falling cosmic ray spectrum that may dominate the accumulated data.
3.2 Event reconstruction
In a first attempt of event reconstruction, we employ an iterative plane wave fit procedure. We perform a Hilbert transform to the signal in each antenna and fit a Gaussian to the peak (c.f. Figure 8). The peak time and amplitude of this Gaussian fit are used as a proxy to define a signal hit if the amplitude exceeds five times the RMS amplitude in the trace. Using singular value decomposition (which is faster and more accurate than minimization), we obtain the best plain wave best match to the set of antenna positions and arrival times. Excluding one of the single antenna hits at a time, we find the hit with the largest pull on the reconstructed direction and recursively remove these hits until the resulting direction does not vary by more than 0.3 (or not enough hits are left to continue the procedure). Figure 9 shows the resulting angular resolution for CoREAS simulated events. A median angular resolution of can be achieved even with this simple approach, comparable to the resolution of IceTop. We also use the amplitude weighted geometric mean of all hits as a proxy for the shower core location, and find an average resolution of for REAS3.0 simulations not including refractive index variations. This simple proxy does not work for CoREAS simulation. With refractive index effects included, the lateral distribution no longer falls monotonically with the radius for small distances to the shower axes Werner et al. (2012).
4 Summary and Outlook
A series of experimental setups has been installed at the South Pole to explore the suitability of the location for an air-shower detector based on radio technology. Noise measurements from more than a year of data-taking demonstrated the excellent suitability of the South Pole for this approach. A detailed comparison of the measured noise spectra show agreement with model predictions on the few level, and hence a profound understanding of the antenna response and DAQ chain calibration. Motivated by this success, proposals have been submitted to the BMBF and the NSF for an extended radio air-shower test array — RASTA — consisting of 74 antennas deployed over a few 100 area. Performance estimates using particle-level shower simulations, as well as detailed simulation of the galactic noise, the DAQ response and antenna response show that a 50% detection efficiency at may be achievable in such a geometry for a simple threshold-based trigger. Using straightforward plane-wave reconstruction methods, with iterative signal cleaning algorithms, suggest that angular resolutions of about 1 and shower core reconstructions of 10 may be obtained. This performance is comparable to the performance that has been measured for the IceTop detector. While successfully funded by the BMBF in 2011, funding for logistic support for such an installation at the South Pole has remained elusive, temporarily delaying future research for this promising project.
References
- Böser et al. (2012) S. Böser, et al., NIM A662, S66–S68 (2012).
- Falcke et al. (2005) H. Falcke, et al., Nature 435, 313–316 (2005).
- Ravel (2012) O. Ravel, NIM A662, S89–S94 (2012).
- Fliescher (2012) S. Fliescher, NIM A662, S124–S129 (2012).
- Vehring (2011) M. Vehring, Master’s thesis, RWTH Aachen (2011).
- Allison et al. (2012) P. Allison, D. Z. Besson, S. Böser, et al., Astroparticle Physics 35, 457–477 (2012), 1105.2854.
- Forbes et al. (1999) J. M. Forbes, I. Y. Portnyagin, N. A. Makarov, Palo, et al., Earth, Planets, and Space 51, 611–620 (1999).
- Kravchenko et al. (2012) I. Kravchenko, S. Hussain, D. Seckel, D. Besson, et al., Phys.Rev. D85, 062004 (2012), 1106.1164.
- de Oliveira-Costa et al. (2008) A. de Oliveira-Costa, et al., ArXiv (2008), 0802.1525.
- Stiles and Ulaby (1980) W. H. Stiles, and F. T. Ulaby, Tech. Rep. 572-1, Kansas Univ. Center for Research (1980).
- Sihyola et al. (1985) A. Sihyola, E. Nyfors, and M. Tiuri, Journal of Glaciology 31, 163–170 (1985).
- Scholten et al. (2010) O. Scholten, et al., ArXiv (2010), 1010.5268.
- Ludwig and Huege (2010) M. Ludwig, and T. Huege, ArXiv (2010), 1010.5343.
- Huege (2012) T. Huege, private communication (2012).
- Cane (1979) H. V. Cane, Mon. Not. R. astr. Soc. 189, 465–478 (1979).
- Werner et al. (2012) K. Werner, K. D. De Vries, and O. Scholten, Astropart.Phys. 37, 5–16 (2012), 1201.4471.