Superdense galaxies and the mass-size relation at low redshift
Abstract
We search for massive and compact galaxies (superdense galaxies, hereafter SDGs) at in the Padova-Millennium Galaxy and Group Catalogue, a spectroscopically complete sample representative of the local Universe general field population. We find that compact galaxies with radii and mass densities comparable to high-z massive and passive galaxies represent 4.4% of all galaxies with stellar masses above , yielding a number density of . Most of them are S0s (70%) or ellipticals (23%), are red and have intermediate-to-old stellar populations, with a median luminosity-weighted age of 5.4 Gyr and a median mass-weighted age of 9.2 Gyr. Their velocity dispersions and dynamical masses are consistent with the small radii and high stellar mass estimates. Comparing with the WINGS sample of cluster galaxies at similar redshifts, the fraction of superdense galaxies is three times smaller in the field than in clusters, and cluster SDGs are on average 4 Gyr older than field SDGs. We confirm the existence of a universal trend of smaller radii for older luminosity-weighted ages at fixed galaxy mass. As a consequence, the median mass-size relation shifts towards smaller radii for galaxies with older stars, but the effect is much more pronounced in clusters than in the field. Our results show that, on top of the well known dependence of stellar age on galaxy mass, the luminosity-weighted age of galaxies depends on galaxy compactness at fixed mass, and, for a fixed mass and radius, on environment. This effect needs to be taken into account in order not to overestimate the evolution of galaxy sizes from high- to low-z. Our results and hierarchical simulations suggest that a significant fraction of the massive compact galaxies at high-z have evolved into compact galaxies in galaxy clusters today. When stellar age and environmental effects are taken into account, the average amount of size evolution of individual galaxies between high- and low-z is mild, a factor .
Subject headings:
galaxies: clusters: general — galaxies: evolution — galaxies: structure — galaxies: fundamental parameters1. Introduction
Recent observations have found that the sizes of high-z quiescent and massive galaxies at are on average much smaller than those of high Sersic index () galaxies in the local Universe (Daddi et al. 2005, Trujillo et al. 2006, Toft et al. 2007, Zirm et al. 2007, Buitrago et al. 2008, Cimatti et al. 2008, van Dokkum et al. 2008, van der Wel et al. 2008, Saracco et al. 2009, Cassata et al. 2011, Damjanov et al. 2011). Recent tantalizing observations from CANDELS may have identified the compact, star-forming progenitors of the passive population (Barro et al. 2012). At a given stellar mass, passive galaxies exhibit a wide range of sizes, from those with radii comparable to nearby galaxies to ultra-compact galaxies up to six times smaller (Saracco et al. 2009, Mancini et al. 2010, Cassata et al. 2011). Searches for superdense galaxies in the Sloan at low-z have found very few such galaxies in the general field (Trujillo et al. 2009, Taylor et al. 2010).
These results suggest a strong evolution in galaxy size between and . The galaxy size growth appears to be stronger for more massive galaxies (Ryan et al. 2012, Huertas-Company et al. 2012), and at least at dependent on morphological type (Huertas-Company et al. 2012).
Several mechanisms have been proposed to explain these observations. One such mechanism is expansion for mass loss, due to an active galactic nucleus (Fan et al. 2008) or stellar winds (Damjanov et al. 2009), though Ragone-Figueroa & Granato (2011) have found that these are insufficient to explain the observed evolution. Major mergers are another possible process at work, but the major merger rate seems to be insufficient to explain the observed evolution. More frequent minor mergers are currently considered the most likely explanation for the evolution of galaxy sizes, since they reduce the effective stellar densities, strongly increasing the galaxy size while leaving the mass almost unaffected (Khochfar & Silk 2006, Naab et al. 2009, Hopkins et al. 2009, Bezanson et al. 2009, Hilz et al. 2012, Oser et al. 2012, see also Trujillo et al. 2011). However, several studies struggle to reconcile the minor merger scenario with the large amount of evolution required when comparing at face value high- and low-z galaxy populations (Nipoti et al. 2009, 2012, Saracco et al. 2011, Newman et al. 2012, Oogi & Habe 2012).
Two new aspects that have been recently highlighted may lead to a modification of the current paradigm of size evolution. The first one has been the detection of a significant fraction of superdense galaxies with radii and masses comparable to high-z galaxies in nearby galaxy clusters (Valentinuzzi et al. 2010a, hereafter V10) and in clusters at intermediate redshift (Valentinuzzi et al. 2010b). This may imply a strong environmental dependence of the distribution of massive and compact galaxies in the local Universe, but no study so far has carried out a detailed comparison between clusters and field at low-z.
The second aspect concerns the effects of galaxy selection in the high-z samples. Several studies have found that smaller galaxies have older stellar populations. As a result, by selecting galaxies that are already passive, high-z studies might be preferentially selecting the most compact ones (Valentinuzzi et al. 2010, Saracco et al. 2009, 2011, Cassata et al. 2011, Szomoru et al. 2011). The existence of a trend of size with age at fixed mass is however still debated (e.g. cf. Valentinuzzi et al. 2010 and Trujillo et al. 2012).
In this paper we search for superdense galaxies and analyze the mass-size relation of galaxies in a new sample representative of the general field population in the local Universe, the Padova-Millennium Galaxy and Group Catalogue (PM2GC, Calvi et al. 2011). This is the first non-Sloan-based work of this kind in the field at low-z, on a much smaller sky area than Sloan, but with a better quality imaging and higher spectroscopic completeness.
We investigate the incidence and properties of superdense galaxies as a function of environment, comparing the general field with clusters, and a range of finer environments including isolated galaxies and groups. We also focus on the dependence of the mass-size relation on galaxy ages and environment, attempting to quantify the importance of selection effects when inferring the size evolution of individual galaxies.
After presenting our dataset (§2), in §3 we show our results for the fraction, number density and properties of superdense galaxies in the field, comparing with clusters in §4. The mass-size relation for different types of galaxies, different stellar population ages and as a function of environment is discussed in §5. We conclude by comparing with previous works (§6) and summarizing our results (§7). We release our surface photometry catalog describing it in the Appendix.
Throughout this paper we will use the cosmology (, , ) = (70,0.3,0.7). All the masses in this paper have been scaled to a Kroupa (2001) IMF (0.1-100 ).
2. The dataset
We draw our galaxy sample from the Padova-Millennium Galaxy and Group Catalogue (hereafter, PM2GC, Calvi et al. 2011) consisting of a spectroscopically complete sample of galaxies at brighter than . This sample is sourced from the Millennium Galaxy Catalogue (MGC, Liske et al. 2003, Driver et al. 2005), a B-band contiguous equatorial survey of complemented by a 96% spectroscopically complete survey down to B=20. The image quality and the spectroscopic completeness are superior to Sloan, and these qualities make it an interesting dataset to study galaxy sizes in a complete sample of galaxies at low-z. In particular, the MGC is based on INT data (2.5m telescope) obtained with a median seeing of 1.3” and at least 750 sec of exposure, with a pixel scale of 0.333”/pixel, while the Sloan (again 2.5m telescope) has a median seeing of 1.5” in (the closest band to our data), an exposure time of only 54.1 sec and 0.396”/pixel. As for completeness, 14% of all galaxies and 25% of SDGs in our spectroscopic PM2GC sample do not have an SDSS spectrum.
The whole PM2GC sample consists of 3210 galaxies and is representative of the general field population. Within the PM2GC, Calvi et al. (2011) identified 176 galaxy groups with at least three members brighter than using a Friends-of-Friends group-finding algorithm. A galaxy is a group member if its spectroscopic redshift lies within from the median group redshift and if it is located within a projected distance of 111 is defined as the radius of a sphere whose interior mean density is 200 times the critical density of the Universe, and it approximates the cluster virial radius. from the group geometrical centre. Galaxies which have no neighbour or solely one with a projected mutual distance and a redshift within 1500 are considered “single” galaxies or “binary-system” galaxies, respectively.
The PM2GC sample is complete for masses (), corresponding to the mass of the faintest and reddest galaxy (, B-V = 0.9) at our redshift upper limit (z = 0.1), as described in Calvi et al. (2012). In this paper, however, we consider only those 1057 galaxies with () to be consistent with the cluster work from Valentinuzzi et al. (2010). Surface profile fits were obtained for 94% of these galaxies as outlined below. Hereafter, we will use the mass-limited sample with radii estimates consisting of 995 galaxies at z=0.03-0.11.
2.1. Galaxy radii and Sersic indices
Effective-radii, axial ratios and Sersic indexes are measured on MGC B-band images with GASPHOT (Pignatelli & Fasano et al. 2006, Bindoni et al. in prep.), an automated tool which performs a simultaneous fit of the major and minor axis light growth curves with a 2D flattened Sersic-law, convolved by the appropriate, space-varying PSF. In this way GASPHOT exploits the robustness of the 1D fitting technique, keeping at the same time the capability (typical of the 2D approach) of dealing with PSF convolution in the innermost regions.
GASPHOT has proved to be very efficient in recovering the best fitting parameters, and to give the appropriate weight to the external parts of the galaxies, where PSF effects are negligible. Indeed we tested GASPHOT on more than 15,000 simulated and real galaxies, obtaining robust upper limits for the errors of the global parameters of galaxies, even for non-Sersic profiles and blended objects (Pignatelli & Fasano 2006). The error (median difference between retrieved and input value) is -0.0040.003 and -0.0300.024 for simulated and galaxies, respectively, and -0.0570.101 for real galaxies. GASPHOT was also tested against the widely used tools GALFIT (Peng et al. 2002) and GIM2D (Marleau & Simard 1998). It was found (Pignatelli & Fasano 2006) that the performances of these tools are quite similar for large and regular simulated galaxies, while GASPHOT has proved to be more robust for real galaxies with some kind of irregularity, which is a crucial feature when dealing with blind surface photometry of huge galaxy samples.
The GASPHOT output effective radius value is calculated along the major-axis, and for the purposes of this paper is circularized with the usual formula:
| (1) |
where and are the major- and minor-axis of the best-fit model, respectively.
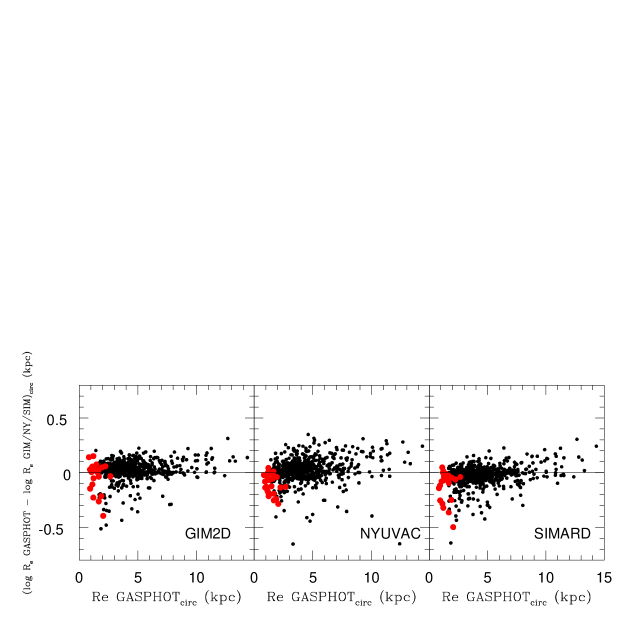
Besides our own size measurements, there are four other independent size estimates for PM2GC galaxies: GIM2D Sersic fits from the Millennium Galaxy Catalogue data (Allen et al. 2006), New York University Value Added Catalogue (NYUVAC) radii (Blanton et al. 2005), GIM2D Sersic fits from Sloan DR7 data (Simard et al. 2011), and DR7/SDSS de Vaucouleurs sizes accessed via the Catalog Archive Server (Abazajian et al. 2009, Thakar et al. 2008), the last three being based on Sloan -band data.
Figure 1 shows the comparison between GASPHOT and GIM2D(MGC)+NYUVAC+SIMARD size estimates for the 618 galaxies in common among the four samples. The agreement is generally good, with a tendency for GASPHOT radii to be larger than the others. The median difference between PM2GC radii and GIM2D/NYUVAC/SIMARD radii is 0.030.04/0.030.06/-0.010.04dex for all galaxies and 0.010.08/-0.12/-0.060.11dex for superdense galaxies (SDGs) as defined in §3. Therefore, for SDGs the Sloan-based estimates tend to be slightly larger than the MGC-based estimates, by a factor 1.3 and 1.1 for the NYUVAC and the Simard catalogues, respectively. The effect is clearly very small, especially when using GIM2D on Sloan data.
Since there are previous low-z studies that have used de Vaucoulers DR7 radii (Taylor et al. 2010, Trujillo et al. 2011), in Fig. 1 we also show the comparison between DR7 size estimates obtained for a de Vaucoulers (n=4) fit and both GASPHOT and NYUVAC radii (764 in common among the three samples). The NYUVAC estimates have been obtained from the same data (Sloan g-band imaging) of the de Vaucoulers radii. As could be expected, the agreement is good for , but de Vaucoulers radii are much larger for lower values, where most of the galaxies and, as we will see, most of our SDGs are found.
2.2. Galaxy stellar masses
Galaxy stellar mass estimates were derived by Calvi et al. (2011) using the Bell & de Jong (2001) relation which correlates the stellar mass-to-light ratio with the optical colours of the integrated stellar population, using the B-band photometry taken from the MGC, and the rest-frame B-V color computed from the Sloan color corrected for Galactic extinction (see Calvi et al. 2011 for details). The typical uncertainty on stellar mass estimates is 0.2-0.3dex.
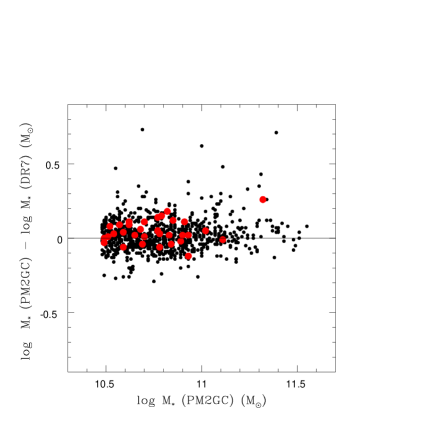
Figure 2 shows that there is no systematic difference between our mass estimates and DR7222http:www.mpa-garching.mpg.deSDSSDR7Datastellar mass.html ones, and the scatter is dex. The median mass difference ( (DR7)) is -0.010.07dex and 0.020.1dex for all and SDG galaxies, respectively.
2.3. Morphologies
To morphologically classify galaxies, we used MORPHOT, an automatic tool designed to reproduce as closely as possible the visual classifications (Fasano et al. 2012). MORPHOT adds to the classical CAS (concentration/ asymmetry/clumpiness) parameters a set of additional indicators derived from digital imaging of galaxies and has been proved to give an uncertainty only slightly larger than the eyeball estimates (Fasano et al. 2011). MORPHOT was applied to the B-band MGC images to identify ellipticals, lenticulars (S0s) and later-type galaxies. These are the three broad morphological classes we will use in this paper (see Calvi et al. 2012 for details).
It is well known that separating ellipticals from S0s could be sometimes challenging even for human experienced classifiers. The challenge is obviously enhanced when dealing with compact objects like SDGs. That being stated, the MORPHOT ability of recognizing visually classified S0 galaxies on MGC-like imaging has been shown to be of the order of % (see Figure 11 in Fasano et al. 2012; see also Figures 6 and 16 therein), which is comparable to the level of agreement reached by different experienced visual classifiers.
2.4. Stellar population ages
The MGC spectroscopic database of PM2GC galaxies consists of SDSS, 2dFGRS and MGCz spectra (Driver et al. 2005), the latter taken with the same instrument and setup of the 2dFGRS. Choosing always the highest quality spectrum available, we preferred to use SDSS spectra when possible (858 cases, 86% of the sample), alternatively 2dFGRS spectra when available (93 cases) and MGCz spectra in the remaining cases. SDSS spectra are flux-calibrated, while we performed a relative flux calibration for all 2dF spectra using the response curve provided by the 2dF team (http:www.mso.anu.edu.au2dFGRS) and a refined, second order calibration using a curve derived by the ratio between the 2dF spectra and the corresponding SDSS spectra for objects with both spectra available, as described in Cava et al. (2009).
To derive the stellar populations ages, we fitted the spectra with the spectro-photometric model fully described in Fritz et al. (2007). All the main spectro-photometric features (such as the continuum flux and shape, and the equivalent widths of emission and absorption lines) are reproduced by summing the theoretical spectra of Simple Stellar Population (SSP) of 12 different ages (from to years).
Dust extinction is allowed to vary as a function of SSP age, in a screen uniformly distributed in front of the SSP stars. The Galactic extinction law follows the Cardelli et al. (1989) scheme, with . As explained in detail in Fritz et al. (2007), for the fit we use a fixed metallicity, exploring three values: Z=0.004, Z=0.02 and Z=0.05. The adopted star formation histories refer to the model with the metallicity value that provides the lowest .
SSP spectra are built using Padova evolutionary tracks and the observed MILES spectral library (Sanchez-Blazquez et al. 2006) for ages older than , complemented by the Jacoby et al. (1984) library for young SSPs, and in the UV and infrared by means of the Kurucz theoretical library. Nebular emission is included, modeled with values that are typical of Hii regions: this significantly affects spectra of SSPs younger than years.
From our spectral analysis, it is possible to derive an estimate of the average age of the stars in a galaxy. Following the definition of Cid-Fernandes et al. (2005), we compute the luminosity–weighted (LW) age by weighting the age of each SSP composing the integrated spectrum with its bolometric flux. This provides an estimate of the average age of the stars weighted by the light we actually observe. A mass–weighted (MW) age is computed in a similar way: each SSP age is weighted with its mass value. The mass–weighted age is the “true” average age of the galaxy’s stars. By construction, the MW age is always older than the LW age.
3. Results: Superdense galaxies in the field at low redshift
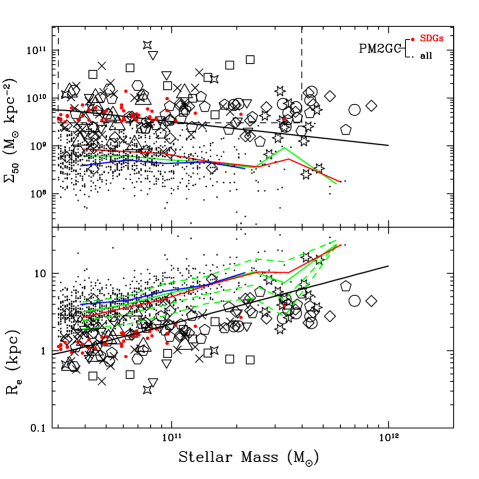
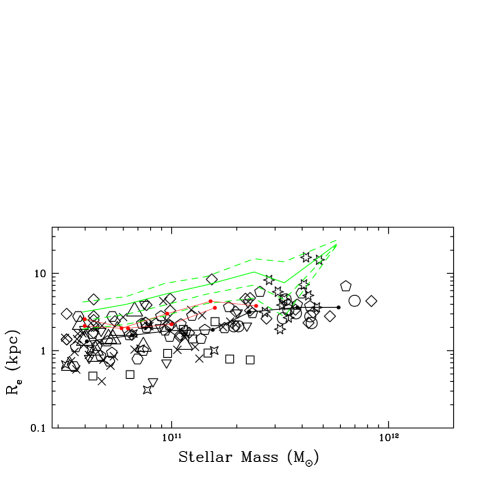
In the bottom panel of Fig.3, we plot the circularized effective radius as a function of stellar mass for PM2GC galaxies with stellar masses . In the upper-panel, we plot the mean mass surface density inside :
| (2) |
as usually defined by other authors (see, among others, Cimatti et al. 2008 and van der Wel et al. 2008). The plots include the median PM2GC mass-size relation for all (green, with 1 and 2 dashed lines), early-type (ellipticals + S0s, red line) and late-type (blue line) galaxies. The binned values of these mass-size relations are given in Table 1.
High-z literature data at are plotted as large empty symbols: HUDF (Daddi et al. 2005, exagons), MUNICS (Trujillo et al. 2006, circles), MUSYC (van Dokkum et al. 2008, squares), Saracco et al. (2009) (diamonds), GMASS (Cimatti et al. 2008, triangles), van der Wel et al. (2008) (pentagons), Damjanov et al. (2009) (reversed triangles), Mancini et al. (2010) (stars), Cassata et al. (2011) (crosses , starred crosses ). All data have been converted to a Kroupa IMF (Kroupa 2001) and Maraston (2005) models as done in V10. The data, methods of analysis, galaxy mass ranges and selection criteria differ from one study to another, but all these works, with the exception of van der Wel et al. (2008) that have used a visual morphological classification, have selected galaxies to be already passively evolving with old stellar populations at the redshift they are observed, based on SED spectral fitting, absence of emission lines, line index age dating and other spectrophotometric techniques.
Following V10, we define SDGs trying to match as much as possible the position of most high-z SDG data in Fig. 3 applying the following criteria:
| (3) | |||||
| (4) |
SDG candidates complying these criteria have been individually inspected, to check their size and mass estimates. A merging system has been excluded from the analysis. When the GASPHOT and GIM2D estimates significantly disagreed, a galaxy-by-galaxy analysis performed with iraf was used to decide which radius was the most accurate. Most of these cases are galaxies with a nearby galaxy or star. There were three galaxies for which the DR7 mass estimate agreed with the mass obtained using SDSS CAS magnitudes but disagreed with the PM2GC mass. For these, the SDSS CAS mass was adopted. This left a total sample of 44 SDGs.
The fraction of SDGs among PM2GC galaxies with masses is %. The corresponding number density of SDGs within the PM2GC volume is .
We note that if we used only literature information the fraction of SDGs would be only slightly lower, but still comparable within the statistical error, 3.7% using GIM2D radii and DR7 masses and 3.3% for NYUVAC radii and DR7 masses.
We also note that the fraction of PM2GC galaxies and PM2GC SDGs with a size measurement from the NYUVAC are 85% and 73%, and the fractions with DR7 masses are 86% and 75%, respectively. This supports the notion that the SDSS sample might be indeed slightly biased against compact massive galaxies (less complete for compact than non-compact galaxies), as discussed in detail by other authors (e.g. Taylor et al. 2010).
It can be seen from Fig.3 that our SDG definition corresponds to galaxies with sizes more than 2 smaller than the median mass-size relation. The region at radii below and densities above the solid straight line is the ”zone of avoidance” where galaxies are rare in the ATLAS3D sample of 260 nearby early-type galaxies, a complete and statistically representative sample of the nearby early-type population (Cappellari et al. 2011). Our SDGs are truly exceptionally dense objects, and outliers in the local mass-radius and mass-density relations.
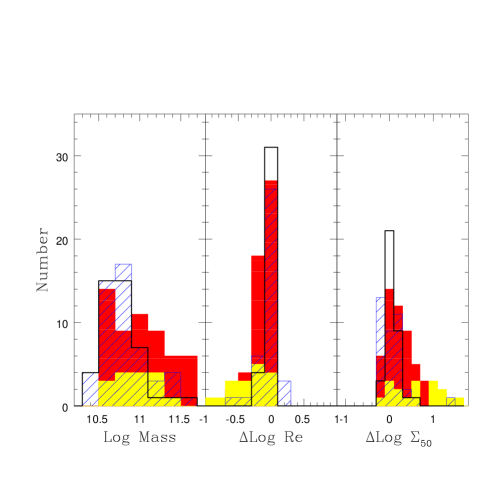
In Fig. 4 we compare the distributions of galaxy mass, radius and density values of the PM2GC SDG sample with those of the high-z SDG data, together with the cluster low-z WINGS sample that will be discussed later. We do this to check that in the local Universe we are selecting galaxies with a ”degree of compactness” that is comparable to that of high-z galaxies. For masses, we plot the simple distributions, while for radii and densities we plot the offset with respect to the high-z median mass-radius and mass-density relations obtained using all the high-z samples considered in this paper.
The PM2GC, WINGS and high-z distributions largely overlap (cf. Fig.7 in Taylor et al. 2010). However, the low-z and high-z distributions do not coincide, and they are not expected to, simply because the low-mass datasets are mass-limited galaxy samples, while the high-z histograms are the results of a collection of different surveys, with different mass ranges, selection criteria etc. As a result, the mass distributions at high- and low-z differ, with the high-z histogram being more populated at high masses than the local samples, and the consequent differences are visible also in the radii and density panels. Nevertheless, the large overlap of the and distributions of low-z and high-z SDGs shows that we are indeed comparing local and distant samples of galaxies with a large overlap in degree of compactness and density.
We note however that datapoints (yellow histograms in Fig. 4) have more prominent low-radii and high-densities tails with respect to the distributions. This is mainly due to the van Dokkum et al. (2008) sample, while Cassata et al. (2011) datapoints resemble the distribution. It is unclear whether the fact that galaxies seem to be extreme in their compactness is due to rapid evolution between and (Cimatti et al. 2012) or selection effects (Saracco et al. 2010), but observationally the difference with appears quite strikingly and is worth further investigation.
| Late Types | ||
| Early Types | ||
| All galaxies | ||
3.1. The properties of superdense field galaxies at low-z
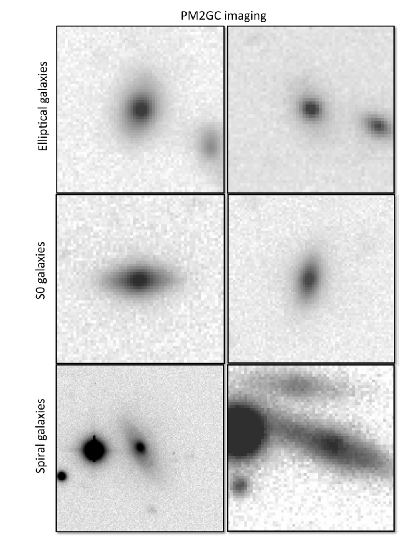
23% of our SDGs are ellipticals, 70% are S0s and only 7% are later-type galaxies. Figure 5 shows some example postage stamps of PM2GC elliptical, S0 and late-type SDGs. In the whole mass-limited sample, 29% are ellipticals, 30% are S0s and 41% are late-types.333Comparing with the Sloan Bayesian automated morphological classifications of Huertas-Company et al. (2011), our morphological classifications agree with theirs (, our S0s versus their S0+early-spirals) in 79% of the cases for the 33 SDGs in common.
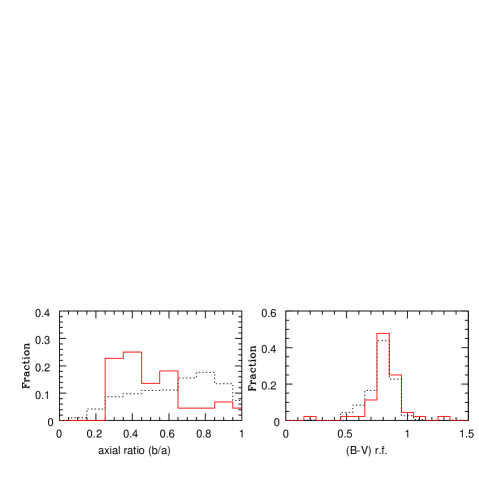
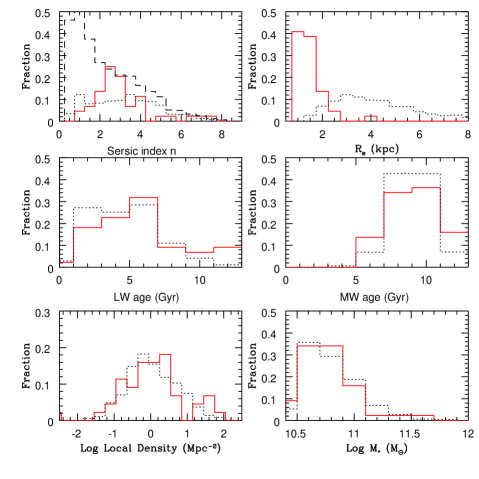
In Fig. 6 we present the distributions of the most relevant quantities describing our SDG sample: axial ratio, (B-V) rest frame color, Sersic index, radius, LW age, MW age, local galaxy density, and stellar mass.444Here the galaxy local density has been computed from the circular area that, in projection on the sky, encloses the 5 nearest projected neighbours brighter than within , minimizing survey edge effects using the SDSS and 2dFGRS in the PM2GC surrounding regions (see Vulcani et al. 2012 for details). For comparison, overplotted are also the distributions for non-SDG galaxies. Table 2 summarizes the mean values for SDGs.
Most of the SDGs lie on the color-magnitude red sequence. Their color distribution is similar to that of the whole mass-limited sample, showing that being red is a characteristic of galaxies in this mass range regardless whether they are compact or not.
Our SDGs show the tendency to be flattened on average, with a , as might be expected given the high number of S0s.555The average b/a of high-z galaxies, found using Daddi et al. (2005), van Dokkum et al. (2008) and Damjanov et al. (2009), is 0.630.23. Similarly, most of our SDGs have Sersic indices lower than 4, with and a distribution intermediate between disky and spheroidal galaxies, as also high-z compact quiescent galaxies do (Wuyts et al. 2010, van der Wel et al. 2011).
Most SDG radii are between 1 and 2 kpc, with a mean . Stellar masses can be as high as , but most of them are below with a mean (). SDGs are intrinsically rather bright, with a mean absolute V magnitude of -20.9.
| PM2GC | WINGS B-band | |||
| Quantity | Value | RMS error | Value | RMS error |
| # SDGs | 44 | 7 | 51 | 7 |
| 1.45 | 0.26 | 1.57 | 0.34 | |
| 2.8 | 0.6 | 3.1 | 0.8 | |
| 0.48 | 0.13 | 0.65 | 0.16 | |
| -20.87 | 0.42 | -20.68 | 0.38 | |
| 5.45 | 1.87 | 9.64 | 2.10 | |
| 9.25 | 1.08 | 11.95 | 1.39 | |
| Ellipticals frac. | 22.7% | 7.2% | 29.1% | 7.8% |
| S0s frac. | 70.5% | 12.7% | 62.0% | 10.7% |
| Late-type frac. | 6.8% | 3.9% | 8.8% | 4.4% |
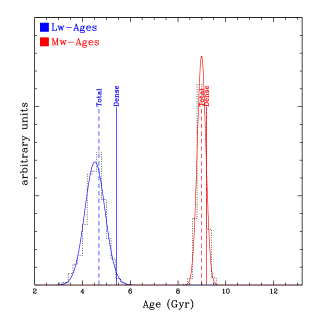
PM2GC SDGs have an intermediate median LW age (5.4Gyr) and a old median MW age (9.2 Gyr), showing that the bulk of the mass has an age typically 4 Gyr older than the luminosity-weighted age. The great majority (93%) of SDGs galaxies have LW age Gyr. We have also inspected their spectra to search for the presence of emission lines, and found that only about 10% of the SDGs have a significant emission ( Å) in any of the strongest lines ([OII] or , never stronger than 15Å in [OII].
The issue of the variation of galaxy sizes with their stellar population ages is particularly relevant when investigating the size evolution of galaxies. In addition to the well-known increase of mean stellar age with galaxy mass, some works, and in particular the cluster low-z work of V10, have found that, at fixed mass, smaller (more compact) galaxies are older. This is confirmed by several works both at high- and low-z (Saracco et al. 2009, Shankar & Bernardi 2009, Kriek et al. 2009, Williams et al. 2010, Cappellari et al. 2012b), although for example Trujillo et al. (2011) find no such a trend. Since most of the high-z studies select massive galaxies that are passive, whose stellar populations are already quite old at high-z, they would tend to select the smallest, i.e. more compact galaxies, with a strong selection bias (V10, Saracco et al. 2011).
To quantify to what extent, on average, PM2GC SDGs are older than non-compact galaxies of similar masses, we used the Monte carlo technique to extract 1000 random samples of “normal” galaxies with the same mass distribution of the SDGs. In Fig. 7, we plot the distributions of the median LW and MW ages of these 1000 samples. The Monte Carlo simulation shows that compact galaxies on average are and Gyr older in LW and MW age, respectively, than normal galaxies of the same mass (the median LW and MW ages for normal galaxies are 4.7 and 9.0 Gyr). Again, this is suggesting that in some way age is related to compactness, in addition than mass, although the effect is modest for the LW-age and barely appreciable for the MW age.
We will come back to this point and compare with LW and MW ages of cluster SDGs in §4, discussing the relevance of this effect for evolutionary studies.
3.2. Velocity dispersions and dynamical masses
As a further check of our SDGs mass and density estimates, we use the galaxy central velocity dispersions available for a subset of 570 galaxies in our mass-limited sample from the Sloan DR7 database. We compute the dynamical mass of all early-type (ellipticals + S0s) galaxies in our mass-limited sample following the formulation by Bertin et al. (2002):
| (5) |
where
| (6) |
using the GASPHOT Sersic index and circularized radius and the DR7 velocity dispersion corrected to as suggested in Cappellari et al. (2006). Using a fixed K(n)=5 as recommended by Cappellari et al. (2006,2012) does not change the results.
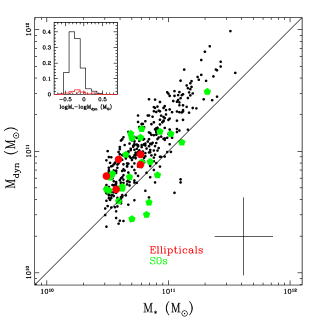
The comparison of virial and stellar mass estimates is shown in Fig. 8. For the great majority of galaxies, as well as the great majority of SDGs, the dynamical mass is higher than the stellar mass by a factor that is very similar to values found in the literature (Taylor et al. 2010b). The median difference is -0.24dex. There are very few cases with stellar mass estimates higher than dynamical estimates, compatible within the errors. The comparison between dynamical and stellar masses confirms the validity of the mass estimates we have used so far and confirms there is no problematic issue regarding our mass estimates.
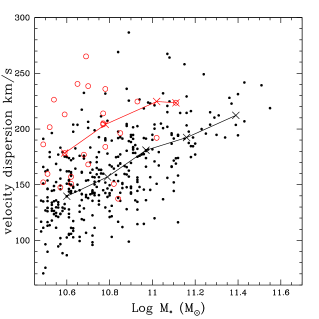
As a further, final test we check whether the velocity dispersions of SDGs are higher than non-SDG galaxies of similar mass, as expected if they are indeed more compact than the normal population. Figure 9 shows that our SDGs (red symbols) have significantly higher velocity dispersions than the average non-compact galaxies of similar stellar mass. The median relations for SDGs and non-SDG galaxies are also shown. For SDG galaxies, the median offset of from the mass-radius relation is -0.4dex, while the median is 0.1dex. These values are very similar to the corresponding ones found by Taylor et al. (2010) for their SDSS sample (-0.38 and 0.12dex, respectively). The dynamical mass estimates and the velocity dispersions of our SDGs are therefore consistent with the fact that these are massive and compact objects.
4. Environment
As explained in §2, within the PM2GC survey, Calvi et al. (2011) have identified different environments: single galaxies, binary systems, and groups with a wide range of velocity dispersions. These environments span a range of dark matter halo masses, of the order of to . We can therefore quantify the occurrence of SDGs in different environments.
We find that the SDG fraction is always around 4%1%, hence indistinguishable, in groups, binaries and single galaxies. However, the fraction rises to 14% in PM2GC systems with a velocity dispersion . Splitting groups further into and we do not detect a difference in SDG fraction, but uncertainties are large and there might be a more gradual transition in SDG fraction with environment which we do not detect due to small number statistics.
In constrast with high-z results finding a trend of sizes with local galaxy overdensity (Cooper et al. 2012), there is instead no preference for SDGs to be in high density regions within the PM2GC, as shown in Fig. 6.
4.1. Field versus cluster superdense galaxies
SDG galaxies in nearby clusters were studied by the WINGS survey (V10). WINGS is a photometric and spectroscopic multiwavelength survey of 77 X-ray selected galaxy clusters at with a cluster velocity dispersion typically in the range 500-1200 and (Fasano et al. 2006, Cava et al. 2009).
Effective radii and galaxy morphologies were obtained from V-band images with the same tools used here, GASPHOT and MORPHOT, respectively (Pignatelli & Fasano 2006, Fasano et al. 2012). Stellar galaxy masses were estimated both using the method adopted in this paper and with the spectrophotometric model used to derive stellar population ages, finding excellent agreement between the two methods (Fritz et al. 2011, Vulcani et al. 2011). LW and MW ages were derived from optical spectra with the same method and spectrophometric model we used for the PM2GC (Fritz et al. 2007, 2011).
The WINGS and PM2GC surveys, together, explore the whole range of environmental conditions, from massive clusters to groups, binary and isolated galaxies. All the tools and methods of analysis are the same for WINGS and the PM2GC, allowing a homogeneous comparison between massive clusters and general field in the nearby Universe.
For the purposes of this paper, the only relevant difference between the two surveys is that the size measurements in V10 were performed on V-band WINGS images, instead of B-band as in the PM2GC.666The consistency between V and B-band WINGS morphological classifications is discussed in Calvi et al. 2012. To obviate this problem, we have employed GASPHOT to obtain effective radii from WINGS B-band imaging (Bindoni et al. in prep.), which was taken with the same instrument (WFCAM/INT) and similar depth of the MGC images we used in this paper.
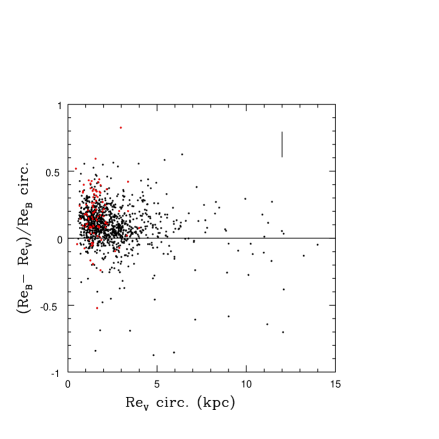
It turned out that the difference between the two filters is small, as shown in Fig. 10, but should not be neglected. The median difference between the WINGS B-band and the V-band is kpc for all galaxies, equivalent to a median , and kpc for SDGs with median . GASPHOT was also run on WINGS K-band images (Valentinuzzi et al. 2009, Bindoni et al. in prep.) and we find a small but clear trend of galaxy sizes with wavelength as radii increase going from K to V to B. In the following, we only use B-band WINGS results.
This small, but systematic offset has an effect on the SDG fraction. Adopting the usual criteria to define SDGs (equations 3 and 4), B-band SDGs in WINGS are 11.81.7% of all galaxies more massive than our adopted mass limit. This fraction is about half of that found in the V band for the same limit (22%, V10). The B-band SDGs are essentially a subsample contained in the V-band SDG sample.
The WINGS SDG proportion is consistent with the rough estimate obtained for systems from the PM2GC (%, §3.1). SDGs are therefore proportionally much more numerous in clusters than in other environments, representing a significant fraction of the cluster massive galaxy population but a factor of 3 smaller fraction in the field.
Let us now compare the number density of SDGs in the field and in clusters, summarized in Table 3. As said in §3.0, the number density of SDGs in the PM2GC is . Considering only the oldest SDGs, those that have been quiescent at least since z=1.0 (=have stopped forming stars at least 1 Gyr before z=1, corresponding to a LW age Gyr), the number density in the PM2GC is almost an order of magnitude smaller, .777A direct comparison with published values of the number density of high-z compact galaxies is unfortunately unfeasible, because compactness criteria do not match and/or the largest high-z samples are affected by the overdensity in the GOODS-S field (Cassata et al. 2011, Barro et al. 2012). A careful comparison of the low-z and high-z number densities will be very valuable to assess what fraction of compact galaxies have survived till today (Renzini 2012).
The WINGS B-band SDGs account for a number density of at least at . This number has been computed by multiplying the average SDG number per cluster among the 21 clusters considered in this study, corrected for spectroscopic incompleteness, by the total number of clusters in the WINGS survey, and dividing by the whole volume of the Universe between and . Considering the whole volume and not just the cluster volume it is like assuming there are no SDGs outside of clusters, obtaining a hard lower limit on the SDG number density at these redshifts. We have not taken into account the fact that WINGS images are sampling the cluster populations as far as for all clusters, while they reach the virial radius for a small subset of clusters. Hence, the numbers above include only galaxies in a fraction of the cluster volume, and the WINGS number density estimates are hard lower limits to the total SDG density accounted for by clusters.
WINGS SDGs are generally very old, with a median LW age of 9.5Gyr, and the number density of LW age Gyr WINGS SDGs is at least (for the reasons given above) .
Although we cannot obtain a precise estimate of the fraction of low-z SDGs that reside in clusters, due to the reasons outlined above, we can conclude that, among old SDGs in the local Universe, a significant fraction (% = ) must be found in clusters today.
| Criteria | Number density |
|---|---|
| General field SDGs (PM2GC) | |
| PM2GC SDGs quiescent today (LWage Gyr) | |
| PM2GC SDGs quiescent z=1.0 (LWage Gyr) | |
| WINGS “cluster” B-band SDGs | |
| WINGS B-SDGs quiescent z=1.0 (LWageGyr) |
4.2. Cluster SDG properties
Table 2 presents the average properties of WINGS B-band SDGs.888We note that these properties are similar to those of V-band SDGs given in Table 3 of V10. The distributions of SDG quantities are also similar to Fig. 6 in V10, and the latter can be compared with Fig. 6 in this paper. While the SDG fraction depends on the band used for their selection, the SDG properties don’t. They have been computed weighting the values for spectroscopic incompleteness, as in V10.
Their mean effective radius, Sersic index, axial ratio and absolute V luminosity are rather similar to the mean values of PM2GC SDGs. As in the field, the majority of cluster SDGs are S0s (62%) or ellipticals (29%). There is a tendency for cluster SDGs to be on average more massive than field SDGs (9 versus 6 ), but the most striking difference is in the stellar population ages.
Cluster SDGs are on average 4 Gyr older than field SDGs in LW age, and about 3 Gyr older in MW age. The age distributions for B-band WINGS SDGs are not dissimilar from those given in Fig. 6 of V10 for V-band selected SDGs and can be compared with Fig. 6 in this paper. Only 3 out of 51 cluster SDGs have a LW age younger than 6 Gyr, while about half of the field SDGs are this young.
The relation between galaxy mass, size and stellar age as a function of environment will be presented in detail in the next section, where we draw our conclusions regarding the evolution of high-z massive compact galaxies and their descendants in the local Universe.
| Late Types | ||
| Early Types | ||
| All galaxies | ||
5. The mass-size relation: Descendants and progenitors
In the previous section we have seen that the incidence of SDGs and the ages of their stellar populations are different in clusters and in the general field. In this section we wish to address a more general question: how does the relation between galaxy mass, size and stellar age depend on environment, and what can this tell us about the local Universe descendants of the high-z massive and compact galaxies.
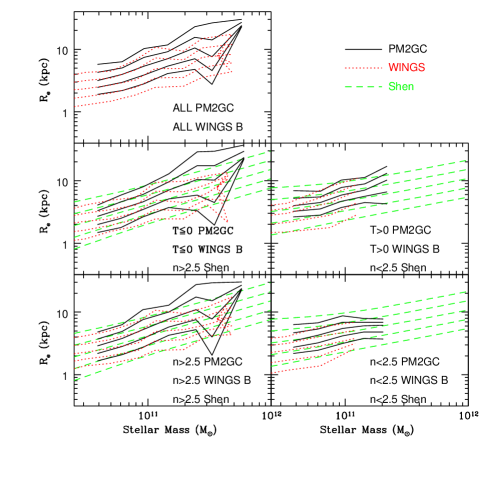
Let us first consider the mass-size relation. Figure 11 compares the median mass-size relations obtained in the PM2GC and in WINGS (B-band) for all galaxies and for galaxies of different types. We consider separately early-type (T-type) versus late-type galaxies (T-type), and galaxies with Sersic versus . The binned values are listed in Tables 1 and 4. Figure 11 includes also a comparison with the relations given by Shen et al. (2003) ( and ) that are based on Sloan -band imaging. The following conclusions can be drawn from this figure:
a) There is an offset between the mass-size relation in the general field and in clusters. Galaxies of a given mass in the field are bigger than in clusters typically by about 1. This effect is visible for all galaxies, and also for each type of galaxies when dividing them by morphological type or Sersic index, being negligible only for late-type massive galaxies. A KS-test can rule out the hypothesis of similar size distribution for cluster and field galaxies of a given mass with probabilities at , at , at . Considering only early-type galaxies, the probabilities are , and in the three mass bins, respectively. We note that Huertas-Company et al. (2012b), instead, do not find a change in the median mass-size relation of early-type galaxies in the SDSS when comparing the general field and clusters.
This is all based on B-band imaging, therefore it cannot arise from color gradient effects. We note that the WINGS B-band relation is already shifted to larger radii compared to the V-band relation for the same galaxies due to the wavelength dependence of effective radius shown in Fig. 10.
b) The Shen et al. relation is shown here only to allow a comparison with the several works that have used it. When dividing by Sersic index, the PM2GC relation for is shifted to larger radii compared to Shen’s by about 1, while the median relation is rather consistent for . We remind that an offset to larger radii is expected when using bluer bands. Moreover, the Shen et al. work is known to be affected by systematic errors due to background oversubtraction (Guo et al. 2009), a bug in the NYUVAC size estimates used at the time that has been fixed in later NYUVAC releases (Blanton et al. 2005) and by the SDSS incompleteness at low redshifts (Taylor et al. 2010).
c) Dividing galaxies by morphological types and by Sersic index is of course not fully equivalent. Differences can be observed in the mass-size relations derived for late-type galaxies (Tables 1 and 4). This is to be expected, given that dividing galaxies by Sersic index corresponds to include in the group some early-type galaxies, that are generally smaller than late-types and have the effect to decrease the average size value at a given mass.
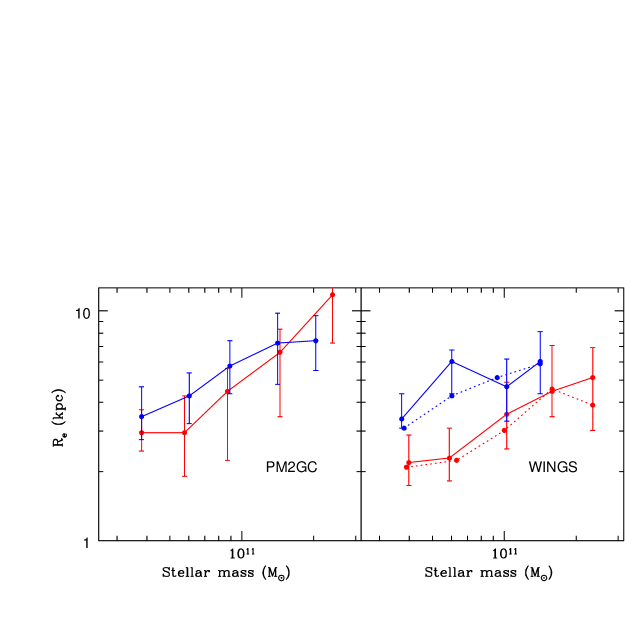
Let us now consider the effects of the stellar population age on the mass-size relation. In §3.2 we have seen that the median LW age of SDGs is 0.7 Gyr older than the LW age of a sample of non-compact galaxies with the same mass distribution of SDGs. In constrast, V10 found cluster SDGs to be on average 1.5 Gyr older than non-compact of the same mass.
Figure 12 presents the median mass-size relation in the PM2GC (left) and B-band WINGS (right) for galaxies of different LW ages. For the PM2GC we show galaxies younger than 4 Gyr (blue) and older than 8 Gyr (red), that represent the youngest and oldest wings of the age distribution. For WINGS, where the age distribution is skewed to much older ages, we can plot galaxies younger than 4 or 6 Gyr (blue), and older than 8 or 10 Gyr (red).
We conclude that both in the field and in clusters, as one considers galaxies with older LW ages, the median mass-size relation shifts to smaller sizes, but this effect is more pronounced in clusters than in the field. On average, in the mass range , the sizes of “old” (8+ Gyr in LW age) galaxies are a factor in the field and in clusters smaller than those of “young” (4Gyr) galaxies.
This effect needs to be taken into account when comparing the sizes of high-z and low-z galaxies to infer an evolution in the sizes of individual galaxies. Our results show that selecting already passive galaxies at high-z means selecting the most compact ones. Assuming they do not resume the star formation activity at later times, the high-z sizes should be compared with the sizes of the oldest (in terms of their luminosity-weighted age) low-z galaxies, to avoid a significant progenitor bias.
Moreover, we have shown that compact massive galaxies are much more common in clusters than in the field today, and that cluster SDGs are older than the field ones. It is therefore logical to expect that a large number of the high-z massive galaxies selected to be passive are found in clusters today. This is supported also by the expectations obtained from hierarchical simulations, which we now discuss.
5.1. Theoretical expectations
The median galaxy mass of the ensemble of high-z datasets used in this paper is . In simulations, the most massive galaxies at high redshifts are located in the extreme peaks of the density distributions, and it is reasonable to expect that many of them will end up in the most massive structures today.
We use the Millennium Simulation (Springel et al. 2005), populated using the semi-analytic model presented in De Lucia & Blaizot (2007). These simulations show that 40% (28%) of all galaxies more massive than () at z=2-2.5 end up in haloes more massive than (WINGS-like clusters) by redshift 0. This fraction decreases to 30% (23%) and 20% (16%) for galaxies with () at and , respectively.
Interestingly, if one considers galaxies with () and already passive (, all with a specific star formation rate ) at z=2.2, 1.6 and 0.6, the fraction that will be in clusters at z=0 rises to 59% (45%), 44% (36%) and 25% (22%), respectively.
Hence, a large fraction of high-z massive galaxies, and the majority of high-z passive and massive galaxies have evolved into today’s cluster galaxies. Clusters at low redshift are the most natural location to look for the descendants of the majority of high-redshift massive and passive (and compact) galaxies.
From simulations it is also possible to obtain a prediction for the fraction of high-z massive and passive galaxies that will end up being the central galaxy of today’s clusters, therefore the BCG of clusters like WINGS’s.
Cluster BCGs are the only type of galaxies for which a large evolution in size was required by our WINGS study (V10, see also Bernardi 2009). The comparison of WINGS clusters and EDisCS clusters showed that the mean size and mass of BCGs have respectively increased by factors of and between and (Valentinuzzi et al. 2010b).
Simulations predict that 40% (23%), 26% (14%) and 7% (3%) of galaxies more massive than () and passive () at z=2.2, 1.6 and 0.6 become BCGs of clusters at z=0. Hence, a significant fraction of massive and passive (and compact) galaxies at should be the progenitors of cluster BCGs. As they are sitting in the best location of the Universe for accreting other galaxies, their expected minor merging rate is extremely high, and the time between and could be sufficient for a colossal size growth to reach the kpc sizes they have today.
5.2. Progenitors and descendants: the amount of size evolution in massive galaxies
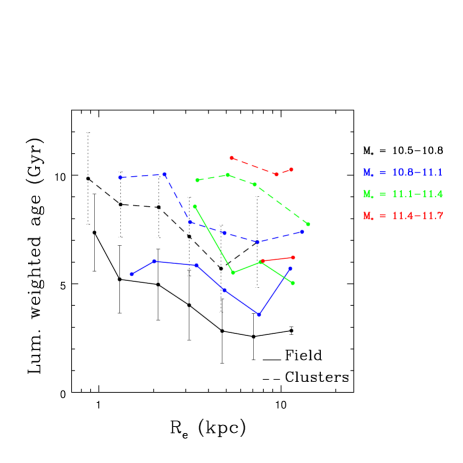
A summary of our results regarding the relations between mass, size, age and environment is presented in Fig. 13. The most important trends for the LW age are exemplified in the left panel:
a) at a given size, more massive galaxies have older LW ages, both in clusters and in the field. The mass of a galaxy has a strong influence on the epoch when it stops forming stars.
b) at a given mass, galaxies with smaller radii have older LW ages, both in clusters and in the field. The size (compactness) of a galaxy influences the epoch when it stops forming stars.
c) at given mass and size, galaxies in clusters have older LW ages than galaxies in the field. On top of the dependence on mass and size, environment has a significant effect on the epoch when galaxies stop forming stars.
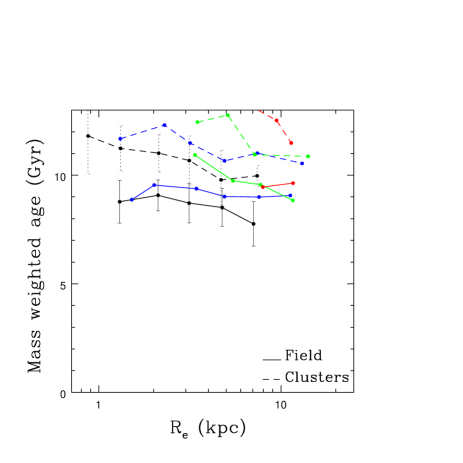
When trying to quantify the impact of stellar-age selection effects on the apparent evolution of the mass-size relation of passive galaxies, the “age” to be considered is the luminosity-weighted age, because the spectrophotometric properties that are used by the high-z studies to select “passive” galaxies (color, absence of emission lines, SED age etc) are related to the LW age, that reflects the epoch of the last star formation episode. It is however interesting to analyse also the relations between mass, size, age and environment considering the MW age, related to the epoch when the bulk of stars were formed. As shown in Fig. 13:
d) at a given size, more massive galaxies have older MW ages, both in clusters and in the field, though the differences of age with mass are smaller than for the LW age, at the level of 2 Gyr at most in our mass range. The mass of a galaxy has a significant influence on the epoch when galaxies form the bulk of their stars.
e) the trends of MW age with radius at fixed mass are generally weaker than for the LW age, especially for the two lowest mass bins. The size of a galaxy seems to have a rather weak influence on when the bulk of stars were formed. Our capability to detect such influence is of course hampered here by the fact that the age resolution of spectrophotometric models at such old ages is poor.
f) there is a noticeable dependence of MW age on environment, with cluster galaxies of a given mass and size being older than their field counterparts. On top of the dependence on galaxy mass and size, environment plays a significant role in determining when galaxies form the bulk of their stars.
The results we have presented highlight the necessity to take into account the dependence of the mass-size relation on galaxy luminosity-weighted ages and environment when studying the evolution of galaxy sizes. Failing to do so has the effect of overestimating the evolution of the sizes of individual galaxies.
To quantify by how much the size evolution could be overestimated, we compare the high-z median mass-size relation (solid black line in Fig. 14) with that of old (LW age Gyr) WINGS and PM2GC galaxies (red lines in figure). We find an average evolution of 0.2-0.25dex, i.e. a factor 1.6-1.8, for WINGS and PM2GC respectively.999We note that this amount of evolution is in agreement with the factor 1.5 at most estimated by V10 comparing the sizes of galaxies of different luminosity-weighted ages with galaxies at different redshifts. This factor represent by how much the median mass-size relation shifts between high-z and low-z when considering the most likely descendants of the high-z progenitors. We do not attempt to assess the amount of evolution as a function of galaxy mass (see e.g. Ryan et al. 2012 and Huertas-Company et al. 2012), because this would require a mass-representative high-z sample.
Comparing instead the high-z relation with the PM2GC relation for all galaxies with or all of today’s passive galaxies at face value, one would find an evolution of about 0.5dex, a factor 3-3.2. Therefore, environmental and selection effects can account for half of the apparent effect.
We conclude that a significant fraction of the massive compact galaxies found at high-z has evolved into today’s cluster compact galaxies. When accounting for the age-selection effects and the hierarchical assembly bias, the evolution of the high-z population in size is smaller than would be inferred at face value considering as descendants the whole passive low-z population regardless of age and environment. The size evolution of individual galaxies is modest, of the order of a factor on average.
6. Comparison with previous works
Most of the high-z works use as local comparison the median mass-size relation derived for galaxies by Shen et al. (2003) from Sloan -band imaging, finding several high-z points to lie at more than 2 from such relation. In §5 we have seen that our field relation for galaxies is shifted by about 1 to larger radii compared to the Shen et al. relation, and that such offset might result from a combination of effects (bluer band used in this work, systematic error in size estimates used by Shen, etc).
A few works have tried to identify massive compact galaxies, similar to the high-z galaxies, at low redshifts. Two works in particular have searched for superdense galaxies in the nearby Universe, both of them using Sloan-based size and mass measurements.
Trujillo et al. (2009) searched for galaxies with and kpc in the Sloan at using NYUVAC radii and mass measurements. After excluding stars, QSOs and cleaning the sample from those close to bright stars, in pairs and edge-on disks, they were left with 29 SDGs. Applying Trujillo et al. (2009) criteria to define SDGs, we find 4 galaxies in our sample, out of 295 (1.4%) more massive than Trujillo’s limit. As we find in this work and as V10 found in nearby clusters, Trujillo’s SDGs are mostly fast rotators S0s (Ferre-Mateu et al. 2012, Trujillo et al. 2012). The most intriguing result of their work is the fact that their SDG stellar population ages are young, suggesting that these galaxies have experienced recently enormous bursts of star formation (Trujillo et al. 2009, Ferre-Mateu et al. 2012). In contrast, the stellar populations of our SDGs selected according to Trujillo’s criteria are old: the MW age is always greater than 8 Gyr, the mean LW age is 6.3 Gyr and is Gyr for all except one galaxy with LW age=1.2Gyr.
Another work searching for SDGs in the local Universe selected SDSS red sequence galaxies with with sizes less than half the size predicted by the Shen et al. (2003) relation, excluding galaxies that were disk-like by visual inspection, showed marked asymmetries, were merging or affected by bright stars (Taylor et al. 2010). We note that excluding visually disk-like galaxies they probably would have excluded most of our sample. Using de Vaucoulers DR7 radii and MPIA SDSS stellar masses, they found 63 galaxies at . Using V10 criteria to define SDGs, Taylor et al. get an SDG fraction of 1.3% for red sequence galaxies. If we use Taylor et al. (2010) criteria to define SDGs (red sequence galaxies, , , but without excluding disks, we identify 13 galaxies out of 589 above this mass limit, therefore a fraction equal to 2.2%. Excluding S0s and spirals, only 3 galaxies remain, a fraction 0.5%. In contrast with Trujillo’s findings and in agreement with ours, Taylor’s SDGs have old stellar population, with LW ages typically in the range 6-10 Gyr.
Overall, our results agree with previous works in finding that superdense galaxies are a small fraction of the global general field population at low redshift, the exact value of such fraction depending of course on the adopted definition of what is superdense. It remains however to be understood why the properties of galaxies selected applying Trujillo’s criteria on the SDSS are so much different from those found with Taylor’s and our selection (see also discussion in Taylor et al. 2010 about the comparison with Trujillo et al. 2009).
In a separate work, Trujillo et al. (2011) investigated the issue of the age dependence on galaxy size using a sample of visually classified ellipticals from the SDSS, and an HST GOODS sample at higher-z. They found no trend of size with MW age, at fixed mass, both in the SDSS and in the sample. This agrees with the consistency between the MW age of SDGs and all galaxies that we also find in Fig. 7. However, these authors also mention that their result does not change if they used LW ages. Interestingly, they do find a variation of size with MW age at fixed dynamical mass, in the direction of older galaxies being more compact, as we find.
It should be noted that they selected visually morphologically classified ellipticals (no S0s included), while the bulk of the age selection effects should show up when including passive galaxies with a disk component, especially S0s that are a very important component of the passive/early-type population, representing % and 60% of the total early-type massive galaxy population in the general field and in clusters at low-z, respectively (Calvi et al. 2012). Disky galaxies are common among high-z superdense massive galaxies (van Dokkum et al. 2008, Cimatti et al. 2008, van der Wel 2011, and other high-z references - see also Chevance et al. 2012 for the possibility that structurally high-z massive compact galaxies are unlike those of any local galaxy sample), and they dominate the SDG populations at low-z both in the field and in clusters, as shown in Table 2. It is also important to stress that the size-age trend at fixed mass is much more pronounced in clusters than in the general field, as we discussed in §5, therefore it is harder to detect in the field than in clusters.
Finally there are a few works in the literature investigating the environmental dependence of the relation between galaxy size and mass, none of them in the local Universe. The lowest redshift study is the one of Maltby et al. (2010) at , who investigated the stellar-mass-size relation for ellipticals, lenticulars and spirals, separately, in the A901/2 STAGES field. Using major axis effective radii and COMBO-17 masses, they analyzed a cluster, a cluster core and a field sample, the latter selected in the cluster area on the sky in redshift intervals that avoid the cluster. For ellipticals, lenticulars and high-mass spirals they found no evidence for an environmental dependence, while for intermediate/low mass spirals, field galaxies are larger at than in the cluster. An analysis of the mass-size relation for each morphological type is beyond the scope of this paper, but in future works it would be interesting to assess how the environmental dependence of the size-mass relation is related to the variation of morphological mix with environment.
Going to higher redshifts, apparently contrasting results have been found. Raichoor et al. (2012) found that visually classified early-type galaxies, mostly at , are more compact in the Lynx supercluster at than in the field at similar redshifts, with a 35-45% of the cluster population being SDGs according to our definition. The evolution observed for the cluster mass-size relation is consistent with the hypothesis that larger size, bulge-dominated spirals transform into earlier types and provoke the shift of the early-type mass-size relation with redshift (Mei et al. 2012). In contrast, Rettura et al. (2010) found comparable mass versus size relations in red sequence galaxies in a cluster and in the field at . Moreover, quiescent (by a combination of colors) galaxies in a proto-cluster at have been found to have larger average effective sizes compared to quiescent field galaxies at fixed mass, resulting in a deficit of compact galaxies and suggesting an accelerated evolution in clusters compared to the field (Papovich et al. 2012). Even more recently, Huertas-Company et al. (2013) do not detect an environmental dependence of the galaxy mass-size relation and the size growth in the field-to-group halo mass range () in COSMOS and SDSS. The environmental dependence of the mass-size relation at high-z is clearly still an open issue.
7. Summary
In this work we have analyzed the Padova Millennium Galaxy and Group Catalogue to search for SDGs in the local Universe, study their properties and investigate how their fraction and characteristics change with environment, using as comparison the WINGS sample of cluster galaxies. Our main results can be summarized as follows.
SDG galaxies, defined to have densities , represent 4.4% of all galaxies at masses . This corresponds to a number density of . If we used literature radii and mass estimates instead of our own, we would get similar numbers. The SDG radii and mass densities distributions resemble those of high-z massive and compact galaxies.
SDGs tend to be flattened, with an average intermediate Sersic index (), consistent with the fact that 70% are S0s. They are generally red and passive, with a median LW and MW ages of 5.4 and 9.2 Gyr, respectively. Their velocity dispersions and dynamical mass estimates are consistent with them being exceptionally dense compared to the general galaxy population at similar masses.
The incidence of SDGs and their luminosity-weighted ages depend strongly on environment. The SDG fraction is 3 times higher and the median age 4 Gyr older in clusters above than in the general field. Other SDG properties, such as morphological distribution and median Sersic index, are very similar for cluster and field SDGs. We find no evidence for a trend with local galaxy density, neither a change with global environment going from isolated galaxies to binary systems to groups.
We study how the mass-size relation changes with the stellar age of the galaxy and with environment. We find that the mass-size relation shifts to smaller radii for older luminosity-weighted galaxies. This effect is mild in the field, and much stronger in clusters.
Moreover, cluster SDGs with old luminosity-weighted ages represent a significant fraction of all old SDGs at low-z. Unfortunately we can only place a hard lower limit to the fraction of SDGs that are in clusters, which is 17%. These old SDGs have sufficiently old stellar populations to be the descendants of the high-z galaxy population assuming they have not resumed a star formation activity at later times.
Based on these results and supported by the expectations of hierarchical simulations that predict that 60% of galaxies that are already massive () and passive (SFR ) at end up in clusters at , we argue that, in order to assess the amount of size evolution of individual galaxies, it is more appropriate to compare the high-z data with old, cluster SDGs at low-z than with the general field population of all ages.
An important fraction of the high-z galaxies is expected to be the progenitors of today’s cluster BCGs, which in fact have undergone an evolution in size and mass that is much stronger than that of all other galaxies. For these galaxies, the evolution has been a factor 4 in size and 2 in mass between and (Valentinuzzi et al. 2010b). These are of course the most massive galaxies locally, usually above the mass limit we adopt here (, see Fig. 5 in Valentinuzzi et al. 2010). This is consistent with a mass-dependent size evolution found by other studies (Huertas-Company et al. 2012, Ryan et al. 2012), which we speculate might be due to BCGs.
When taking age and environmental effects into account, we find that the average evolution in size of individual, non-BCG galaxies of masses is very mild, a factor .
One of our most intriguing results is the dependence of the LW and MW ages on galaxy mass, size and environment. The LW age, that can be considered a sort of “quenching age” approximately equal to the time elapsed since galaxies stopped forming stars, is significantly influenced by mass, size and environment. Both in clusters and in the field, at a given size more massive galaxies have older LW ages and, at a given mass, smaller galaxies have older LW ages. At fixed mass and size, cluster galaxies have older LW ages than field galaxies. The existence of a link between mass, structure and stellar age was already discussed in D’Onofrio et al. (2011) based on different arguments.
The MW age, that represents the “true” average age of stars in galaxies and is more related to the epoch when galaxies formed the bulk of their stars, depends strongly on galaxy mass and environment, and less strongly on galaxy size. These findings may help guiding models of galaxy formation and evolution to identify the mechanisms determining the birth epoch of most stars and the quenching epoch of star formation in galaxies.
Appendix A Galaxy size, axial ratio and Sersic index catalog
We release the catalog of sizes, axial ratios and Sersic indices measured with GASPHOT for the PM2GC mass-limited galaxy sample used in this paper. Table A1 shows a subset of the catalog, available in full as online material at the journal and at the CDS. The catalog of positions, galaxy stellar masses, redshifts, environment and other galaxy properties can be found in Calvi et al. (2011). The morphological catalog is released with Calvi et al. (2012, submitted), and upon request to the author before publication.
GIM2D radii, axial ratios and Sersic indices used in this paper are given in Allen et al. (2006) and can be found at the Millennium Galaxy Catalogue web page http://www.eso.org/ jliske/mgc/, file gim2d_sersic0.92. Images are also released by the MGC, following the instructions at the same web page.
| ID | (pixel) | n | b/a |
|---|---|---|---|
| 61514 | 9.553 | 7.797 | 0.488 |
| 16076 | 13.133 | 0.854 | 0.678 |
| 55832 | 9.457 | 3.295 | 0.532 |
| 22663 | 9.844 | 4.566 | 0.947 |
| 43503 | 8.667 | 3.111 | 0.779 |
| 18454 | 5.676 | 3.751 | 0.332 |
| 37797 | 10.338 | 1.242 | 0.576 |
| 18855 | 5.477 | 3.544 | 0.426 |
| 12239 | 7.964 | 3.887 | 0.592 |
| 19977 | 6.088 | 3.251 | 0.618 |
| 24151 | 5.372 | 2.096 | 0.413 |
| ….. | ….. | ….. | ….. |
References
- (1) Abazajian, K.N., et al.., 2009, ApJS, 182, 543
- (2) Allen, P.D., Driver, S.P., Graham, A.W., Cameron, E., Liske, J., De Propris, R., 2006, MNRAS, 371, 2
- (3) Barro, G., et al., 2012, submitted to ApJ(arXiv:1206.5000)
- (4) Bell, E.F., de Jong, R.S., 2001, ApJ, 550, 212
- (5) Bernardi, M., 2009, MNRAS, 395, 1491
- (6) Bertin, G., Ciotti, L., Del Principe, M., 2002, A&A, 386, 149
- (7) Blanton, M., et al., 2005, AJ, 129, 2562
- (8) Bruce, V.A., et al., 2012, submitted to MNRAS (arXiv:1206.4322)
- (9) Buitrago, F., Trujillo, I., Conselice, C.J., Bouwens, R.J., Dickinson, M., Yan, H., 20008, ApJ, 687, L61
- (10) Calvi, R., Poggianti, B.M., Vulcani, B., 2011, MNRAS, 416, 727
- (11) Calvi, R., Poggianti, B.M., Fasano, G., Vulcani, B., 2012, MNRAS, 419, L14
- (12) Cappellari, M., et al., 2006, MNRAS, 366, 1126
- (13) Cappellari, M. et al., 2011, MNRAS, 413, 813
- (14) Cappellari, M. et al., 2012, MNRAS submitted (arXiv:1208.3522)
- (15) Cappellari, M. et al., 2012b, MNRAS submitted (arXiv:1208.3523)
- (16) Cardelli, J.A., Clayton, G.C., Mathis, J.S., 1989, ApJ, 345, 245
- (17) Cassata et al., 2010, ApJ, 714, L79
- (18) Cassata et al., 2011, ApJ, 743, 96
- (19) Cava, A., et al., 2009, A&A, 495, 707
- (20) Chevance, M., et al., 2012, ApJL, 754, L24
- (21) Cimatti, A., et al., 2008, A&A, 482, 21
- (22) Cimatti, A., Nipoti, C., Cassata, P., 2012, MNRAS in press, (arXiv:1202.5403)
- (23) Chevance, M., Weijmans, A., Damjanov, I., Abraham, R.G., Simard, L., van den Bergh, S., Caris, E., Glazebrook, K., 2012, ApJin press (arXiv: 1206.3579)
- (24) Cid-Fernandes, R., Mateus, A., Sodre, L., Stasinska, G., Gomes, J.M., 2005, MNRAS, 358, 363
- (25) Cooper, M.C., et al., 2012, MNRAS, 419, 3018
- (26) Daddi, E., et al.., 2005, ApJ, 626, 680
- (27) Damjanov, I., et al., 2009, ApJ, 695, 101
- (28) Damjanov, I., et al.., 2011, ApJL, 739, L44
- (29) De Lucia, G., Blaizot, J.,. 2007, MNRAS, 375, 2
- (30) D’Onofrio, M., et al., 2011, ApJL, 727, L6
- (31) Driver, S.P., Liske, J., Cross, N.J.G., De Propris, R., Allen, P.D., 2005, MNRAS, 360, 81
- (32) Fasano, G., et al., 2006, A&A, 445, 805
- (33) Fasano, G., et al., 2012, MNRAS, 420, 926
- (34) Ferre-Mateu, A., Vazdekis, A., Trujillo, I., Sanchez-Blazquez, P., Ricciardelli, E., de la Rosa, G., 2012, MNRAS, 423, 632
- (35) Fritz, J., et al., 2007, A&A, 470, 137
- (36) Fritz, J., et al., 2011, A&A, 526, 45
- (37) Guo, Y., et al, 2009, MNRAS, 398, 1129
- (38) Hilz, M., Naab, T., Ostriker, J.P., Thomas, J., Burkert, A., Jesseit, R., 2012, MNRAS in press (arXiv:1206.1597)
- (39) Houghton, R.C.W., Davies, R.L., Dalla Bonta’, E., Masters, R., 2012, MNRAS, 423, 256
- (40) Huertas-Company, M., Aguerri, J.A.L., Bernardi, M., Mei, S., Sanchez Almeida, J., 2011, A&A, 525, 157
- (41) Huertas-Company, M., et al., 2012, MNRAS submitted (arXiv:1207.5793)
- (42) Huertas-Company, M., et al., 2012b, submitted (private communication)
- (43) Jacoby, G.H., Hunter, D.A., Christian, C.A., 1984, ApJS, 56, 257
- (44) Jorgensen, I., Bergmann, M., Davies, R., Barr, J., Takamiya, M., Crampton, D., 2005, AJ, 129, 1249
- (45) Kriek, M., van Dokkum, P.G., Franx, M., Illingworth, G.D., Magee, D.K., 2009, ApJL, 705, L71
- (46) Kroupa, P., 2001, MNRAS, 322, 231
- (47) Liske, J., Lemon, D.J., Driver, S.P., Cross, N.J.G., Couch, W.J., 2003, MNRAS, 344, 307
- (48) Maltby, D.T., et al., 2010, MNRAS, 402, 282
- (49) Mancini, C., et al., 2010, MNRAS, 401, 933
- (50) Maraston, C., 2005, MNRAS, 362, 799
- (51) Marleau, F.R., Simard, L., 1998, ApJ, 507, 585
- (52) Martinez-Manso, J., et al., 2011, ApJ, 738, L22
- (53) Mc Lure, R.J., et al., 2012 MNRAS in press (arXiv:1205.4058)
- (54) Mei, S., et al., 2012, ApJin press (arXiv:1205.1785)
- (55) Newman, A.B., Elllis, R.S., Bundy, K., Treu, T., 2012, ApJ, 746, 162
- (56) Nipoti, C., Treu, T., Auger, M.W., Bolton, A.S., 2009, ApJL, 706, L86
- (57) Nipoti, C., Treu, T., Leauthaud, A., Bundy, K., Newman, A.B., Auger, M.W., 2012, MNRAS, 422, 1714
- (58) Oogi, T., Habe, A., 2012, MNRAS submitted (arXiv:1208.5039)
- (59) Oser, L., Naab, T., Ostriker, J.P., Johansson, P.H., 2012, ApJ, 744, 62
- (60) Papovich, C., et al., 2012, ApJ, 750, 93
- (61) Peng, C.Y., Ho, L.C., Impey, C.D., Rix, H.W., 2002, AJ, 124, 266
- (62) Pignatelli, E., Fasano, G., 2006, A&A, 446, 373
- (63) Ragone-Figueroa, C., Granato, G.L., 2011, MNRAS, 414, 3690
- (64) Raychoor, A., et al., 2012, ApJ, 745, 130
- (65) Renzini, A., 2012, in The intriguing life of massive galaxies: introducing the final discussion, IAU Symp. 295, eds. D. Thomas, A. Pasquali, I. Ferreras (arXiv 1210.5633)
- (66) Rettura, A., et al., 2010, ApJ, 709, 512
- (67) Ryan, R.E., et al., 2012, ApJ, 749, 53
- (68) Sanchez-Blazquez, P., et al., 2006, MNRAS, 371, 703
- (69) Saracco, P., Longhetti, M., Andreon, S., 2009, MNRAS, 392, 718
- (70) Saracco, P., Longhetti, M., Gargiulo, A., 2010, MNRAS, 408, L21
- (71) Saracco, P., Longhetti, M., Gargiulo, A., 2011, MNRAS, 412, 2707
- (72) Saracco, P., Gargiulo, A., Longhetti, M., 2012, MNRAS in press (arXiv:1202.5903)
- (73) Shankar, F., Bernardi, M., 2009, MNRAS, 396, L76
- (74) Springel, V., et al., 2005, Nature, 435, 629
- (75) Shen, S., et al., 2003, MNRAS, 343, 978
- (76) Simard, L., Trevor Mendel, J., Patton, D.R., Ellison, S.L., McConnachie, A.W., 2011, ApJS, 196, 11
- (77) Strazzullo, V., et al., 2010, A&A, 524, 17
- (78) Szomoru, D., et al., 2010, ApJ, 714, L244
- (79) Szomoru, D., Franx, M., van Dokkum, P.G., 2012, ApJ, 749, 121
- (80) Taylor, E.N., Franx, M., Glazebrook, K., Brinchmann, J., van der Wel, A., van Dokkum, P.G., 2010, ApJ, 720, 723
- (81) Taylor, E.N., Franx, M., Brinchmann, J., van der Wel, A., van Dokkum, P.G., 2010b, ApJ, 722, 1
- (82) Thakar, A., R., Szalay, A., Fekete, G., Gray, J., 2008, Comput. Sci. Eng., 10, 30
- (83) Trujillo, I., et al., 2006, MNRAS, 373, L36
- (84) Trujillo, I., Conselice, C.J., Bundy, K., Cooper, M.C., Eisenhardt, P., Ellis, R.S., 2007, MNRAS, 382, 109
- (85) Trujillo, I., Cenarro, A.J., de Lorenzo-Caceres, A., Vazdekis, A., de la Rosa, I.G., Cava, A., 2009, ApJ, 692, L118
- (86) Trujillo, I., Ferreras, I., de la Rosa, I.G., 2011, MNRAS, 415, 3903
- (87) Trujillo, I., Carrasco, E.R., Ferre-Mateu, A., 2012, ApJ, 751, 45
- (88) Valentinuzzi, T., et al., 2009, A&A, 501, 851
- (89) Valentinuzzi, T., et al., 2010, ApJ, 712, 226 (V10)
- (90) Valentinuzzi, T., et al., 2010b, ApJ, 721, L19
- (91) van der Wel, A., et al., 2008, ApJ, 688, 48
- (92) van der Wel, A. et al., 2011, ApJ, 730, 38
- (93) van Dokkum, P.G., et al., 2008, ApJ, 677, L5
- (94) van Dokkum, P.G., et al., 2010, ApJ, 709, 1018
- (95) Vulcani, B., et al., 2011, MNRAS, 412, 246
- (96) Vulcani, B., Poggianti, B.M., Fasano, G., Desai, V., Dressler, A., Oemler, A., Calvi, R., D’Onofrio, M., Moretti, A., 2012, MNRAS, 420, 1481
- (97) Williams, R.J., Quadri, R.F., Franx, M., van Dokkum, P., Toft, S., Kriek, M., Labbe’, I., 2010, ApJ, 713, 738
- (98) Wuyts, S., Cox, T.J., Hayward, C.C., Franx, M., hernquist, L., Hopkins, P.F., Jonsson, P., van Dokkum, P.G., 2010, ApJ, 722, 1666