xx–xx
Further evidence for
large central mass-to-light ratios in
massive early-type galaxies
Abstract
We studied the stellar populations, distribution of dark matter, and dynamical structure of a sample of 25 early-type galaxies in the Coma and Abell 262 clusters. We derived dynamical mass-to-light ratios and dark matter densities from orbit-based dynamical models, complemented by the ages, metallicities, and -elements abundances of the galaxies from single stellar population models. Most of the galaxies have a significant detection of dark matter and their halos are about 10 times denser than in spirals of the same stellar mass. Calibrating dark matter densities to cosmological simulations we find assembly redshifts . The dynamical mass that follows the light is larger than expected for a Kroupa stellar initial mass function, especially in galaxies with high velocity dispersion inside the effective radius . We now have 5 of 25 galaxies where mass follows light to , the dynamical mass-to-light ratio of all the mass that follows the light is large ( in the Kron-Cousins band), the dark matter fraction is negligible to . This could indicate a ‘massive’ initial mass function in massive early-type galaxies. Alternatively, some of the dark matter in massive galaxies could follow the light very closely suggesting a significant degeneracy between luminous and dark matter.
keywords:
galaxies: abundances, galaxies: elliptical and lenticular, cD, galaxies: formation, galaxies: kinematics and dynamics, galaxies: stellar content.1 Introduction
In the past years we studied the stellar populations, mass distribution, and orbital structure of a sample of early-type galaxies in the Coma cluster with the aim of constraining the epoch and mechanism of their assembly.
The surface-brightness distribution was obtained from ground-based and HST data. The stellar rotation, velocity dispersion, and the and coefficients of the line-of-sight velocity distribution were measured along the major axis, minor axis, and an intermediate axis. In addition, the line index profiles of Mg, Fe and H were derived ([Mehlert et al. (2000), Wegner et al. (2002), Corsini et al. (2008), Mehlert et al. 2000; Wegner et al. 2002; Corsini et al. 2008]). Axisymmetric orbit-based dynamical models were used to derive the mass-to-light ratio of all the mass that follows the light and the dark matter (DM) halo parameters in 17 galaxies ([Thomas et al. (2005), Thomas et al. (2007a), Thomas et al. (2007b), Thomas et al. (2009a), Thomas et al. (2009b), Thomas et al. 2005, 2007a,b, 2009a,b]). The comparison with masses derived through strong gravitational lensing for early-type galaxies with similar velocity dispersion and the analysis of the ionized-gas kinematics gave valuable consistency checks for the total mass distribution predicted by dynamical modeling ([Thomas et al. (2009b), Thomas et al. 2011]). The line-strength indices were analyzed by single stellar-population models to derive the age, metallicity, -elements abundance, and mass-to-light ratio (or depending on the adopted initial mass function, IMF) of the galaxies ([Mehlert et al. (2003), Mehlert et al. 2003]).
More recently, we have performed the same dynamical analysis for 8 early-type galaxies of the nearby cluster Abell 262 ([Wegner et al. (2012), Wegner et al. 2012]). The latter is far less densely populated than Coma cluster and it is comparable to the Virgo cluster. Moreover, while the Coma galaxies were selected to be mostly flattened, the Abell 262 galaxies we measured appear predominantly round on the sky.
2 Results
2.1 Evidence for halo mass not associated to the light
In the Coma galaxy sample the statistical significance for DM halos is over for 8 (out of 17) galaxies ([Thomas et al. (2007b), Thomas et al. 2007b]), whereas the Abell 262 sample reveals 4 (out of 8) galaxies of this kind ([Wegner et al. (2012), Wegner et al. 2012]). In Coma, we found only one galaxy (GMP 1990) with , i.e., with a negligible halo-mass fraction of the total mass inside . This is also the case of 4 galaxies in Abell 262 (NGC 703, NGC 708, NGC 712, and UGC 1308). The evidence for a DM component in addition mass that follows light is not directly connected to the spatial extent of the kinematic data, degree of rotation, or flattening of the system. There is no relationship with the age, metallicity, and -elements abundance of the stellar populations.
We can not discriminate between cuspy and logarithmic halos based on the quality of the kinematic fits, except for NGC 703 where the logarithmic halo fits better. Still the majority of cluster early-type galaxies have times denser halos than local spirals ([Persic et al. (1996), e.g., Persic et al. 1996]), implying a times higher assuming , where is the formation redshift of the DM halos. Thus, if spirals typically formed at , then cluster early-type galaxies assembled at .
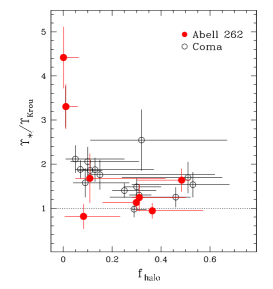
Averaging over all galaxies, we find that a fraction of of the total mass inside is in a DM halo distinct from the light. Similar fractions come from other dynamical studies employing spherical models ([Gerhard et al. (2001), e.g., Gerhard et al. 2001]). The Coma and Abell 262 galaxies show an anti-correlation between , i.e. the ratio between the dynamical and stellar population mass-to-light ratios, and (Fig. 1, left panel). Galaxies where the dynamical mass following the light exceeds the Kroupa value by far () seem to lack matter following the halo distribution inside (). Not so in galaxies near the Kroupa limit (), where the dark-halo mass fraction is at its maximum ().
2.2 Mass that follows the light
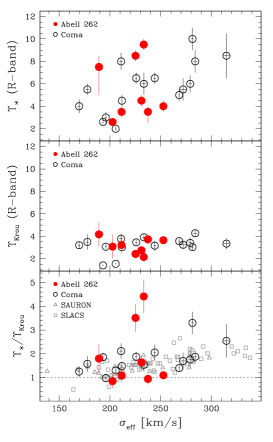
As far as the mass-to-light ratios are concerned, the galaxies of Coma and Abell 262 follow a similar trend. While the dynamically determined increases strongly with , i.e., the velocity dispersion averaged within (Fig. 1, right top panel), the stellar population models indicate almost constant (Fig. 1, right middle panel). This implies that the ratio increases with (Fig. 1, right bottom panel). Around km s-1 the distribution of has a sharp cutoff with almost no galaxy below . For km s-1 the lower bound of increases to at km s-1. Similar trends are also observed in the SAURON sample with dynamical models lacking a separate DM halo ([Cappellari et al. (2006), Cappellari et al. 2006]), in SLACS galaxies with combined dynamical and lensing analysis ([Treu et al. (2010), Treu et al. 2010]) and, recently, in the ATLAS3d survey with dynamical models including a DM halo ([Cappellari et al. (2012), Cappellari et al. 2012]).
3 Discussion
Fig. 1 provides strong evidence for large central in massive early-type galaxies. However, in all gravity-based methods there is a fundamental degeneracy concerning the interpretation of mass-to-light ratios. Such methods can not uniquely discriminate between luminous and dark matter once they follow similar radial distributions. The distinction is always based on the assumption that the mass density profile of the DM differs from that of the luminous matter.
One extreme point of view is the assumption that the stellar masses in early-type galaxies are maximal and correspond to . The immediate consequence is that the stellar IMF in early-type galaxies is not universal, varying from Kroupa-like at low velocity dispersions to Salpeter (or steeper) in the most massive galaxies ([Auger2010, Thomas et al. (2009b), Cappellari et al. (2012), see Auger et al. 2010, Thomas et al. 2011, and Cappellari et al. 2012, for a detailed discussion]). Recent attempts to measure the stellar IMF directly from near-infrared observations point in the same direction ([Conroy & van Dokkum (2012), see Conroy & van Dokkum 2012, and references therein]). However, we also find the galaxies with the largest have the lowest halo-mass fractions inside and vice versa. A possible explanation for this finding is a DM distribution that follows the light very closely in massive galaxies and contaminates the measured , while it is more distinct from the light in lower-mass systems. This has been suggested elsewhere as a signature of violent relaxation.
One option to further constrain the mass-decomposition of gravity-based models is to incorporate predictions from cosmological simulations that confine the maximum amount of DM that can be plausibly attached to a galaxy of a given stellar mass. Since adiabatic contraction increases the amount of DM in the galaxy center, it could be in principle a viable mechanism to lower the required stellar masses towards a Kroupa IMF ([Napolitano et al. (2010), Cappellari et al. (2012), Napolitano et al. 2010, but see also Cappellari et al. 2012]). An immediate consequence is that some of the mass that follows the light is actually DM, increasing the DM fraction to about of the total mass inside .
Since the (decontracted) average halo density scales with the mean density of the universe at the assembly epoch, we derived the dark-halo assembly redshift for Coma ([Thomas et al. (2009b), Thomas et al. 2011]) and Abell 262 galaxies ([Wegner et al. (2012), Wegner et al. 2012]). We compared the values of to the star-formation redshifts calculated from the stellar-population ages. For the majority of galaxies and their assembly seems to have stopped before . The stars of some galaxies appear to be younger than the halo, which indicates a secondary star-formation episode after the main halo assembly. The photometric and kinematic properties of the remaining galaxies suggest they are the remnants of gas-poor binary mergers and their progenitors formed close to the relation. Without trying to overinterpret the result given the assumptions, it seems that Kroupa IMF allows us to explain the formation redshifts of our galaxies. In addition, galaxies in Coma and Abell 262 where the dynamical mass that follows the light is in excess of a Kroupa stellar population do not differ in terms of their stellar population ages, metallicities and -elements abundances from galaxies where this is not the case.
Taken at face value, our dynamical mass models are therefore as consistent with a universal IMF, as they are with a variable IMF. If the IMF indeed varies from galaxy to galaxy according to the average star-formation rate ([Conroy & van Dokkum (2012), Conroy & van Dokkum 2012]) then the assumption of a constant stellar mass-to-light ratio inside a galaxy should be relaxed in future dynamical and lensing models.
References
- [Auger et al. (2009)] Auger, M. W., Treu, T., Bolton, A. S. et al. 2009, ApJ, 705, 1099
- [Cappellari et al. (2006)] Cappellari, M., Bacon, R., Bureau, M. et al. 2006, MNRAS, 366, 1126
- [Cappellari et al. (2012)] Cappellari, M., McDermid, R. M., Alatalo, K. et al. 2012, Nature, 484, 485
- [Conroy & van Dokkum (2012)] Conroy, C., & van Dokkum, P. 2012, ApJ, submitted, arXiv:1205.6473
- [Corsini et al. (2008)] Corsini, E. M., Wegner, G. A., Saglia, R. P. et al. 2008, ApJS, 175, 462
- [Gerhard et al. (2001)] Gerhard , O., Kronawitter, A., Saglia, R. P., & Bender, R. 2001, AJ, 121, 1936
- [Mehlert et al. (2000)] Mehlert, D., Saglia, R. P., Bender, R., & Wegner, G. A. 2000, A&AS, 141, 449
- [Mehlert et al. (2003)] Mehlert, D., Thomas, D., Saglia, R. P., Bender, R., & Wegner, G. A. 2000, A&A, 407, 423
- [Napolitano et al. (2010)] Napolitano, N. R., Romanowsky, A. J., & Tortora, C. 2010, MNRAS, 405, 2351
- [Persic et al. (1996)] Persic, M., Salucci, P., & Stel, F. 1996, MNRAS, 283, 1102
- [Thomas et al. (2007a)] Thomas, J., Jesseit, R., Naab, T. et al. 2007a, MNRAS, 381, 1672
- [Thomas et al. (2009a)] Thomas, J., Jesseit, R., Saglia, R. P. et al. 2009a, MNRAS, 393, 641
- [Thomas et al. (2005)] Thomas, J., Saglia, R. P., Bender, R. et al. 2005, MNRAS, 360, 1355
- [Thomas et al. (2007b)] Thomas, J., Saglia, R. P., Bender, R. et al. 2007b, MNRAS, 382, 657
- [Thomas et al. (2009b)] Thomas, J., Saglia, R. P., Bender, R. et al. 2009b, ApJ, 691, 770
- [Thomas et al. (2009b)] Thomas, J., Saglia, R. P., Bender, R. et al. 2011, MNRAS, 415, 545
- [Treu et al. (2010)] Treu, T., Auger, M. W., Koopmans, L. V. E. et al. 2010, ApJ, 709, 1195
- [Wegner et al. (2002)] Wegner, G. A., Corsini, E. M., Saglia, R. P. et al. 2002, A&A, 395, 753
- [Wegner et al. (2012)] Wegner, G. A., Corsini, E. M., Thomas, J. et al. 2012, AJ, 144, 78