B/C ratio and the PAMELA positron excess
Abstract
We calculate the diffuse intensity of cosmic ray (CR) nuclei and their secondaries in the Boron-Carbon group produced by supernova remnants (SNR). The trajectories of charged particles in the SNR are modeled as a random walk in the test particle approximation. Secondary production by CRs colliding with gas in the SNR is included as a Monte Carlo process, while we use Galprop to account for the propagation and interactions of CRs in the Galaxy. In the vicinity of a source, we find an approximately constant B/C ratio as a function of energy. As a result, the B/C ratio at Earth does not rise with energy, but flattens instead in the high energy limit. This prediction can be soon tested by the AMS-2 collaboration.
pacs:
98.70.Sa, 95.30.CqI Introduction
Measurements of the nuclear composition and of the antimatter fraction of cosmic rays (CR) are one of the main tools to understand their origin galprop . Because the propagation of charged CRs in the turbulent component of the Galactic magnetic field is diffusive up to energies eV, properties as the average injection spectrum of CRs or the diffusion tensor and its energy dependence have to be determined indirectly. The quality of these measurements has been improved in the last years considerably, for instance by the determinations of the intensity of CR protons and He performed by the PAMELA collaboration pamela . In particular, the PAMELA collaboration found a slope change of the CR spectrum, which is difficult to explain in the simplest models VJMP . Similar deviations from a pure power-law even below the knee region were found using gamma-ray observations of selected molecular clouds in the Gould belt NST ; KO .
Previously, the PAMELA collaboration measured the positron fraction in CRs and found a rapid rise from 10 to 100 GeV PAMELA . Fermi LAT measurements confirmed this behavior in the energy range 20–200 GeV FermiLAT:2011ab . In contrast, the antiproton ratio measured by PAMELA declines above 10 GeV Adriani:2008zq , consistent with expectations. Such a rise of the positron fraction is most naturally explained by the injection of high-energy positrons by local sources as nearby pulsars pulsar : Since electrons loose fast energy, the high-energy part of the spectrum is dominated by local sources. Moreover, electromagnetic pair cascades in pulsars result naturally in a large positron fraction together with a “standard” antiproton flux.
In this work we study an alternative explanation for the rising secondary fraction which was put forward originally for positrons in Ref. B09 : Secondaries created by hadronic interactions in the shock vicinity participate in the acceleration process and therefore it was suggested that they have a flatter energy spectrum than primary CRs. In Ref. B09 , it was estimated that the resulting positron fraction can explain the PAMELA excess and increases up to 50%, while subsequently this mechanism was applied to antiprotons in Ref. pp and to the B/C and Ti/Fe ratios in Refs. sarkar .
The present work examines the acceleration and production of nuclei in SNRs. Following closely in spirit our previous studies 1 ; 2 , we use a Monte Carlo (MC) approach calculating the trajectory of each particle individually in a random walk picture. This makes it easy to include interactions and the production of secondaries. As our main result, we predict a flat B/C ratio in the source vicinity, without a rise at high energies. At Earth, the additional contribution from SNRs to the secondary fluxes only flattens the B/C ratio but does not lead to a rise in the high energy limit. Consequently, an increase in the antiproton-proton ratio cannot be explained by astrophysical models and could be used as a signature of DM. This prediction can be tested soon by the AMS-2 collaboration AMS2 , which aims at a 1% accurate measurement of the flux of different nuclei up to energies of TeV/nucleon pohl .
II Simulation procedure
As we are following closely the approach presented already in Refs. 1 ; 2 , we recall only briefly our methodology. We model trajectories by a random walk in three dimensions with step size determined by an energy-dependent, isotropic diffusion coefficient . We assume as usual in the test particle approach that the diffusion of a nucleus with charge and momentum proceeds in the Bohm regime,
| (1) |
where denotes the turbulent magnetic field. Then the mean free path is given by the Larmor radius which in turn is determined by . Thus the step-size and the time step is controlled by . As a draw-back of our Monte Carlo approach, the step-size in the random walk decreases therefore as , requiring larger computing time for nuclei with higher charges . Therefore we restrict our analysis to relatively light nuclei, concentrating on the B/C ratio.
We do not consider any feedback of CRs on the shock or the magnetic field. As the strength of the magnetic field is assumed to change from a phase of amplification to damping, we use two models for the time evolution of the magnetic field : In the first case, we use a constant turbulent magnetic field with G during all the evolution of the SNR. As the second choice, we assume strong field amplification in the early phase, with G before the transition to the Sedov-Taylor phase at yr, and subsequent damping to G at .
For the position and the velocity of the SNR shock we use the case of the analytical solutions derived in Ref. TM99 . These solutions connect smoothly the ejecta-dominated phase with free expansion and the Sedov-Taylor stage . The acceleration of CRs is assumed to cease after the transition to the radiative phase at the time . We use an age-limited scenario for the CR escape where most CRs are accumulated downstream and are released at . The SNR is modeled by the following parameters: We choose the injected mass as , the mechanical explosion energy as erg, and the density of the ISM as cm-3. The end of the Sedov-Taylor phase follows then as yr. We model the injection rate proportional to the CR pressure in2 ,
| (2) |
with . We choose the isotopes according to the source abundances of Ref. galprop and inject isotopes up to . Lifetimes for radioactive isotopes are taken from the database bnl . We use for the simulation of nuclear reactions the cross sections and decay tables extracted from GALPROP which in turn are based on Refs. sigmas ; webber .
We describe the propagation of cosmic rays in the Galaxy with the help of the Galprop code galprop ; galprop2 . More specifically, we consider plain diffusion, neglecting re-acceleration process and fixing all relevant parameters, like the normalization and the energy-slope of the diffusion coefficient, from a fit to HEAO data heao to both primary and secondary nuclei in the GeV range.

III Numerical results
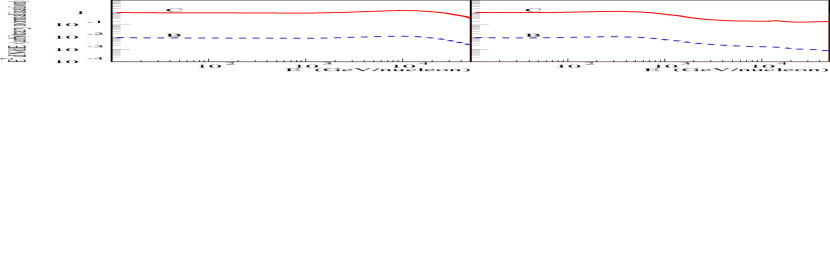
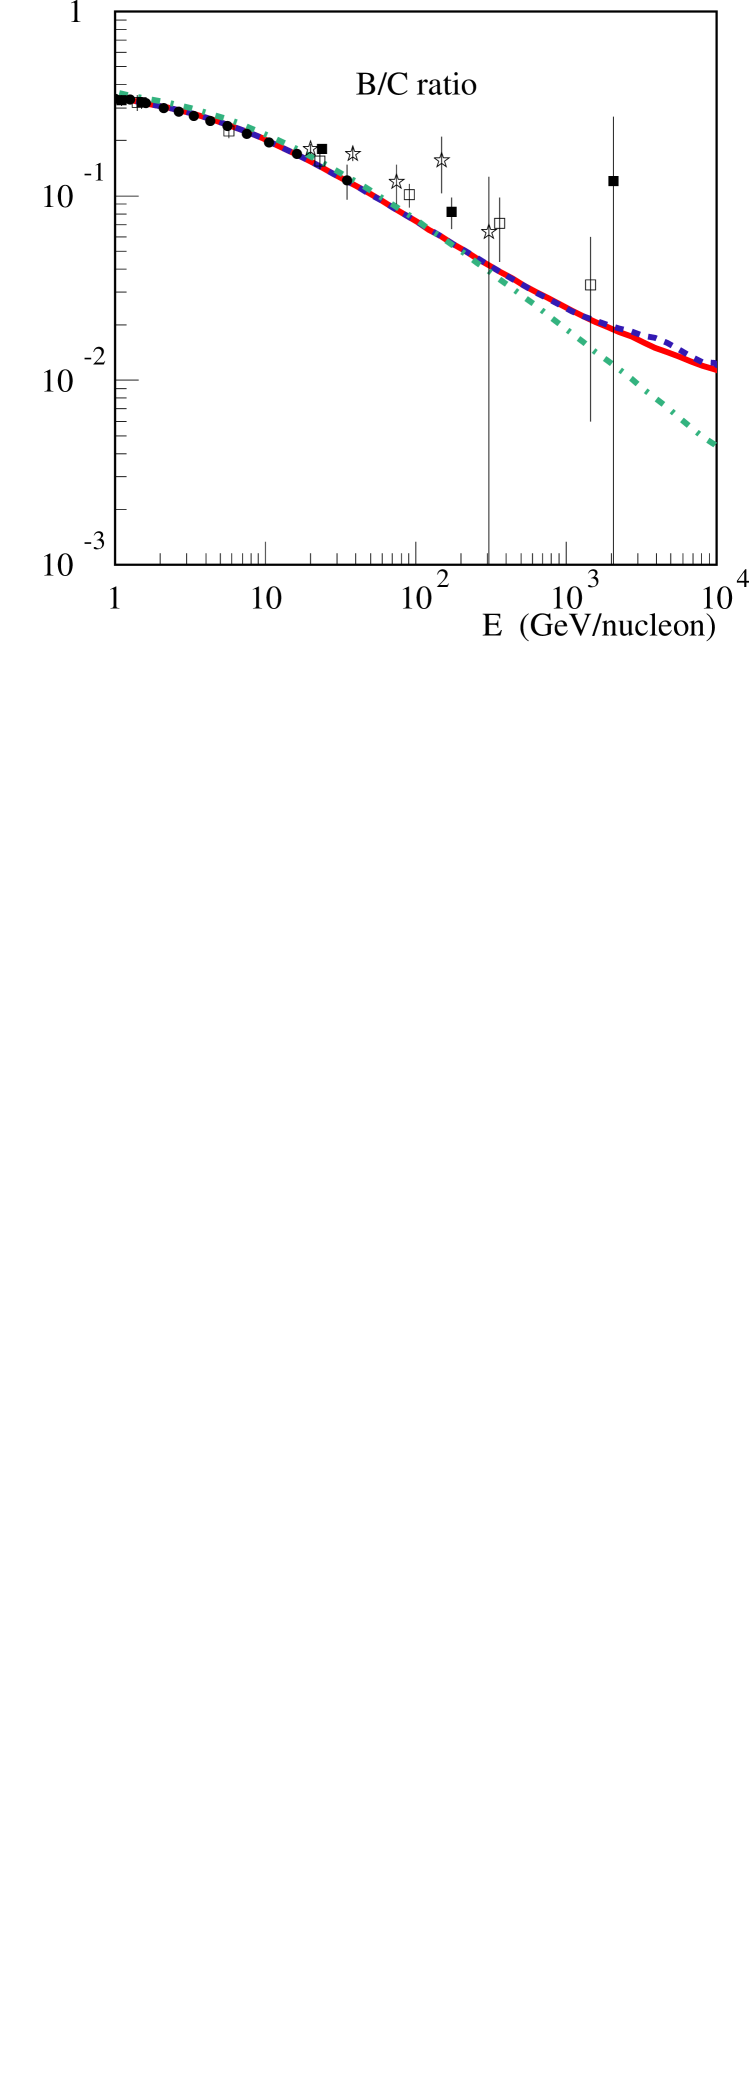
In Fig. 1, we show the energy dependence of the B () and C () spectra at for the two cases of magnetic field evolution. For a constant magnetic field, the spectra of both primary and secondary CRs are well approximated by an shape111The small “bump” near the acceleration cutoff eV is formed by the small overdensity of the most energetic CRs in the acceleration zone, as discussed in more detail in 2 .. The corresponding B/C ratio shown in Fig. 2 by the solid line remains constant up to the acceleration cutoff: Because the energy per nucleon in a spallation reaction is approximately conserved and the simple relation holds, the rigidity of the reaction products stays approximately unchanged. Hence, the acceleration process is not influenced by the conversion of, say, a into a nuclei: The secondary nucleus follows the same trajectory in a given magnetic field configuration as its parent would do, if no conversion took place. As a consequence, the boron and carbon spectra as function of energy per nucleon have practically identical shapes, with their relative normalization determined approximately by the interaction depth in the SNR: The latter is given by assuming mbarn as typical value for the fragmentation cross section of a carbon nuclei into boron.
In the second model for the magnetic field evolution, the spectral shape is more complicated: Nuclei that were injected early are accelerated up to feweV, while the bulk of CRs injected when the turbulent magnetic field is damped has a cutoff around eV. However, due to the conservation of the rigidity by the spallation process, the energy spectra of B and C are remarkably similar: The B/C ratio is again energy-independent and coincides with the one obtained for the case of a constant magnetic field—as it should, since the interaction depth is the same in the two cases. Thus, our conclusion on the energy-independence of the primary to secondary CR ratios is of general character, being independent of a particular scenario for the source magnetic field.
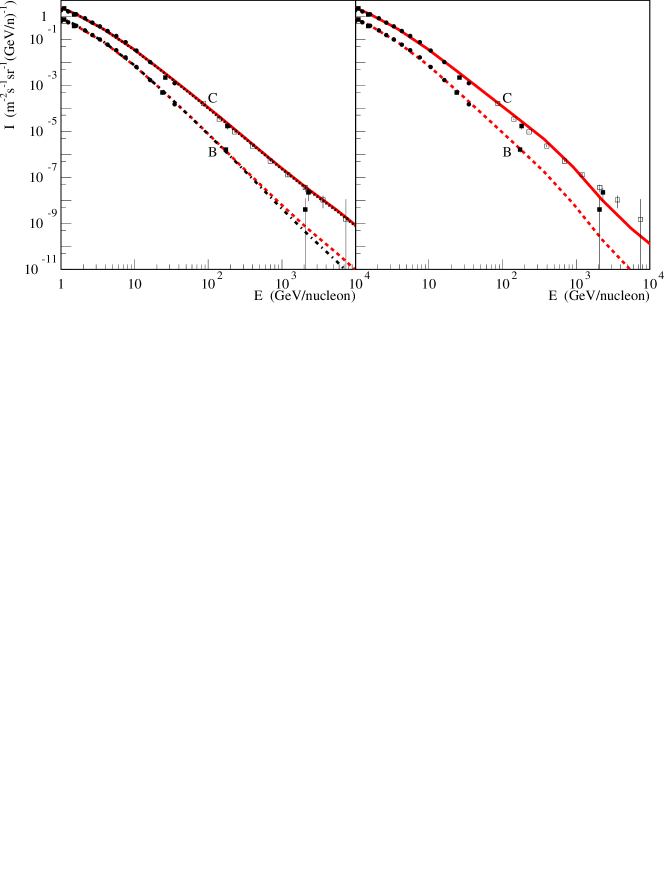
As the next step, we calculate the CR propagation in the Galaxy using the Galprop code, and compare in Fig. 3 the resulting B and C intensity at Earth with experimental data. For the spatial diffusion coefficient in the Galaxy, we used , with . In the left panel of Fig. 3, we show additionally the B and C intensity including only secondary production in the interstellar medium (ISM), i.e. neglecting the SNR contribution to the B intensity. The SNR contribution to the Boron intensity remains small in the whole energy range considered, independent of the models used for the magnetic field evolution in the SNR. At Earth, the obtained B/C ratio shown in Fig. 4 coincide with the pure propagation results up to GeV/nucleon; at higher energies the ratios slowly flatten to the per cent level, i.e. to the respective source value.
IV Conclusions
We calculated the energy spectra of nuclei in the B-C group and their secondaries produced in a supernova remnant (SNR) using a simple random walk picture. In contrast to a previous prediction sarkar that the B/C ratio rises sharply above energies TeV/nucleon, we found that the ratio remains approximately constant in the vicinity of a source. Our results suggest that the contribution of SNRs to the intensity of secondary CRs is subdominant up to very high energies.
In our simulations we used an age-limited escape of CRs. Implementing a free-escape boundary may change our results, except if the boundary is placed at the distance . In particular, assuming the same position of the free-escape boundary for all energies will lead to a softening of the secondary spectra Kawanaka:2012xg , lowering further the B/C ratio.
This prediction can be soon tested by the AMS-2 collaboration AMS2 . The absence of a rise in the B/C ratio would support the arguments of Refs. 1 ; 2 that reacceleration close to shock fronts in SNRs does not lead to a change in the secondary to primary ratios.
Acknowledgements.
We are grateful to Ricard Tomàs for collaboration in the early stage of this project, and to Igor Moskalenko for advice on Galprop and comments on the text. S.O. acknowledges the support of Norsk Forskningsradet within the program Romforskning.References
- (1) A. W. Strong and I. V. Moskalenko, Adv. Space Res. 27, 717 (2001); see also http://galprop.stanford.edu/web_galprop/galprop_home.html.
- (2) O. Adriani et al., Science 332, 69 (2011).
- (3) A. E. Vladimirov, G. Jóhannesson, I. V. Moskalenko and T. A. Porter, Astrophys. J. 752, 68 (2012) [arXiv:1108.1023].
- (4) A. Neronov, D. V. Semikoz, and A. M. Taylor, Phys. Rev. Lett. 108, 051105 (2012).
- (5) M. Kachelrieß and S. Ostapchenko, Phys. Rev. D 86, 043004 (2012) [arXiv:1206.4705 [astro-ph.HE]].
- (6) O. Adriani et al. [PAMELA Collaboration], Nature 458, 607 (2009).
- (7) M. Ackermann et al. [Fermi LAT Collaboration], Phys. Rev. Lett. 108, 011103 (2012) [arXiv:1109.0521 [astro-ph.HE]].
- (8) O. Adriani et al., Phys. Rev. Lett. 102, 051101 (2009).
- (9) A. K. Harding and R. Ramaty, Proc. 20th ICRC, Moscow, 2, 92 (1987); A. Boulares, Astrophys. J. 342, 807 (1989); F. A. Aharonian, A. M. Atoyan and H. J. Völk, Astron. Astrophys. 294, L41 (1995).
- (10) P. Blasi, Phys. Rev. Lett. 103, 051104 (2009).
- (11) P. Blasi and P. D. Serpico, Phys. Rev. Lett. 103, 081103 (2009).
- (12) P. Mertsch and S. Sarkar, Phys. Rev. Lett. 103, 081104 (2009) [arXiv:0905.3152 [astro-ph.HE]]; M. Ahlers, P. Mertsch and S. Sarkar, Phys. Rev. D 80, 123017 (2009); see also N. Tomassetti and F. Donato, Astron. Astrophys. 544, A16 (2012) [arXiv:1203.6094 [astro-ph.HE]].
- (13) M. Kachelrieß, S. Ostapchenko and R. Tomàs, J. Phys. Conf. Ser. 259, 012092 (2010) [arXiv:1004.1118 [astro-ph.HE]].
- (14) M. Kachelrieß, S. Ostapchenko and R. Tomàs, Astrophys. J. 733, 119 (2011) [arXiv:1103.5765 [astro-ph.HE]].
- (15) V. Bindi for the AMS-02 collaboration, “Status of the AMS-02 detector after one year of operation on the International Space Station” at ICHEP2012 - 36th International Conference for High Energy Physics, Melbourne 2012.
- (16) M. Pohl at the workshop “Searching for the sources of Galactic cosmic rays,” Paris 2012 http://www.apc.univ-paris7.fr/~semikoz/CosmicRays/CosmicRays/Dec12/pohl.pdf
- (17) J. K. Truelove and Ch. F. McKee, Astrophys. J. Suppl. 120, 299 (1994).
- (18) V. S. Ptuskin and V. N. Zirakashvili, Astron. Astrophys. 429, 755 (2005).
- (19) http://www.nndc.bnl.gov/nudat2
- (20) S. G. Mashnik, K. K. Gudima, I. V. Moskalenko, R. E. Prael and A. J. Sierk, Adv. Space Res. 34, 1288 (2004).
- (21) W. R. Webber, A. Soutoul, J. C. Kish and J. M. Rockstroh, Astrophys. J. Suppl. 144, 153 (2003).
- (22) I. V. Moskalenko and A. W. Strong, Astrophys. J. 493, 694 (1998); A. W. Strong and I. V. Moskalenko, ibid. 509 (1998) 212; A. E. Vladimirov et al., Comput. Phys. Commun. 182, 1156 (2011).
- (23) J. J. Engelmann, P. Ferrando, A. Soutoul, P. Goret and E. Juliusson, Astron. Astrophys. 233, 96 (1990).
- (24) H. S. Ahn et al., Astrophys. J. 707, 593 (2009).
- (25) A. Obermeier et al., Astrophys. J. 742, 14 (2011).
- (26) A. D. Panov et al., Proc. “30th International Cosmic Ray Conference, 2, 3 (2008) arXiv:0707.4415 [astro-ph].
- (27) H. S. Ahn et al., Astropart. Phys. 30, 133 (2008) [arXiv:0808.1718 [astro-ph]].
- (28) N. Kawanaka, arXiv:1207.0010 [astro-ph.HE].