Molecular gas in the inner 500pc of the Milky Way: violating star formation relations and on the verge of forming extreme stellar clusters
Abstract
With the HOPS, MALT90 and HiGAL Galactic plane surveys we are mapping a significant fraction of the dense, star-forming, molecular gas in the Galaxy. I present results from two projects based on this combined dataset, namely, (i) looking for variations in the star formation (SF) rate across the Galaxy as a function of environment, and (ii) searching for molecular cloud progenitors of the most extreme (massive and dense) stellar clusters. We find the SF rate per unit mass of dense gas in the inner 500pc of the Galaxy is at least an order of magnitude lower than that in the disk, directly challenging the predictions of proposed universal column/volume density relations. In particular, the region , contains 107 M⊙ of dense molecular gas — enough to form 1000 Orion-like clusters — but the present-day star formation rate within this gas is only equivalent to that in Orion. I present follow up studies of one molecular cloud we have studied as part of project (ii) which also lies in the inner 500 pc of the Galaxy and is clearly extreme compared to the rest of the Galactic population. With a mass of 105 Msun, a radius of only 3pc and almost no signs of star formation it appears to be the progenitor of an Arches-like stellar cluster. Despite detailed observational follow-up searches, this object still appears to be unique in the Galaxy, making it extremely important for testing massive cluster formation models.
1 Introduction
The conversion of gas into stars is one of the fundamental processes in the Universe, and a cornerstone of astrophysics and cosmology. Whether or not this process varies as a function of environment across cosmological timescales underpins our understanding of the formation of everything from planets to galaxy clusters. The key physics linking all these fields is encapsulated in an end-to-end understanding of the star and cluster formation process incorporating the effect of different natal environmental conditions.
Developing an end-to-end model of star formation (SF) must be led by observations that can both resolve sites of individual SF and determine the global properties of their natal molecular clouds. For the foreseeable future, SF regions in the Milky Way (MW) are the only targets in the Universe for which this will be possible. The physical environment across the MW varies widely, from the extreme conditions close to the central supermassive black hole, to the benign conditions in the outer Galaxy. By trying to understand what drives changes in the stellar output of molecular clouds as a function of their physical properties in our own Galaxy, we aim to provide a template for understanding SF under similar conditions in external galaxies and across cosmological timescales.
In many ways this is a Golden Age for SF studies in the MW. In the next few years, the availability of multi-wavelength Galactic plane survey data, new telescopes for follow-up studies, and advances in numerical simulations will enable a revolution in Galactic SF studies. Surveys are building GMC samples comprising a large fraction of the dense molecular gas in the Galaxy. Combined with similar surveys at IR and cm wavelengths, this will, for the first time, provide statistically meaningful GMC samples separated by their global/environmental properties and relative ages.
Within this context, I present some initial results from the HOPS1, MALT902 and HiGAL3 Galactic plane surveys. We conducted the simplest possible analysis of such an enormous dataset, namely looking for i) large systematic variations between dense gas tracers and SF indicators across the Galaxy, and ii) the most extreme molecular clouds in the Galaxy.
2 Testing star formation relations
Recent surface- and volume-density star formation relations have been proposed which potentially unify our understanding of how gas is converted into stars, from the nearest star forming regions to ultra-luminous infrared galaxies (ULIRGs)4,5. The inner 500 pc of our Galaxy contains the largest concentration of dense, high-surface density molecular gas in the Milky Way6,7, providing an environment where the validity of these star-formation prescriptions can be tested.
We have used recently-available data from HOPS and HiGAL at wavelengths where the Galaxy is transparent, to find the dense, star-forming molecular gas across the Milky Way8. We use water and methanol maser emission9 to trace star formation activity within the last years and 30 GHz radio continuum emission from the Wilkinson Microwave Anisotropy Satellite (WMAP)10 to estimate the high-mass star formation rate averaged over the last years.
We find the dense gas distribution is dominated by the very bright and spatially-extended emission within a few degrees of the Galactic centre11. This region accounts for 80% of the NH3(1,1) integrated intensity but only contains 4% of the survey area. However, in stark contrast, the distribution of star formation activity tracers is relatively uniform across the Galaxy.
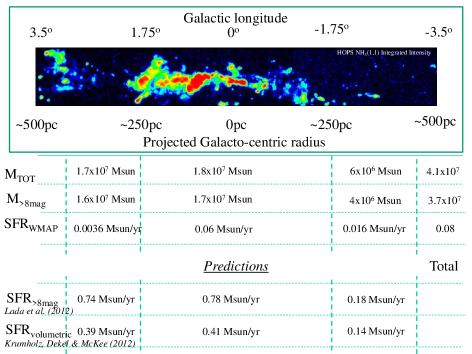
To probe the dense gas vs SFR relationship towards the Galactic centre region more quantitatively, we compared the HiGAL column density maps12 to the WMAP-derived SFR across the same region. The results are shown in Figure 1. The total mass and SFR derived using these methods agree well with previous values in the literature7,13,14. The main conclusion from this analysis is that both the column-density threshold and volumetric SF relations4,5 over-predict the SFR by an order of magnitude given the reservoir of dense gas available to form stars. The region , is particular striking in this regard. It contains 107 M⊙ of dense molecular gas — enough to form 1000 Orion-like clusters — but the present-day star formation rate within this gas is only equivalent to that in Orion. This implication of this result is that any universal column/volume density relations must be a necessary but not sufficient condition for SF to occur.
3 Searching for molecular cloud progenitors of extreme stellar clusters
Young massive clusters (YMCs) are thought to be the ‘missing link’ between open clusters and extreme extragalactic super star clusters and globular clusters. We previously used the HOPS survey to search for molecular clouds which may represent the initial conditions of YMCs15. With a mass of 105 M⊙, a radius of only 3pc and almost no signs of star formation, we put forward one cloud, G0.2530.016, as a likely progenitor of an Arches-like YMC. Our Galactic plane survey data suggested this to be the most massive and dense cloud in the Galaxy, making it extremely important for testing massive cluster formation models16.
In subsequent work we have attempted to quantify what the initial conditions must be for molecular clouds to form bound YMCs, and propose the progenitor clouds must have escape speeds greater than the sound speed in photo-ionized gas17. In these clumps, radiative feedback in the form of gas ionization is bottled up, enabling star formation to proceed to sufficiently high efficiency so that the resulting star cluster remains bound even after gas removal. We estimate the observable properties of clouds destined to form YMCs for existing Galactic plane surveys. Follow-up work searching through BGPS data finds several clouds which pass the proposed criteria18. However, none of these are as massive as G0.2530.016 and in all of them prodigious star formation is already underway.
Despite these, and other, detailed searches for similar objects, G0.2530.016 still appears to be the most massive and dense molecular cloud in the Galaxy with almost no signs of star formation.
References
- (1) Walsh, A. J. et al., 2011, MNRAS, 416, 1764-1821
- (2) Foster, J. et al., 2011, ApJS, 197, 25
- (3) Molinari, S. et al. 2010, A&A, 518, 100-105
- (4) Lada, C. J. et al., 2012, ApJ, 745, 190-196
- (5) Krumholz, M. et al.. 2012, ApJ, 745, 69-85
- (6) Morris, M. & Serabyn, E., 1996, ARAA, 34, 645-701
- (7) Ferriere, K. et al., 2007, A&A, 467, 611-627
- (8) Longmore, S.N. et al, 2012, sub MNRAS, arXiv:1208.4256
- (9) Caswell, J. L. et al., 2010, MNRAS, 404, 1029-1060
- (10) Lee, E. et al., 2012, ApJ, 752, 146-160
- (11) Purcell et al, 2012, MNRAS, 426, 1972
- (12) Molinari, S. et al., 2011, ApJ, 735, 33-40
- (13) Immer, K. et al., 2012, A&A, 537, 121-140
- (14) Yusef-Zadeh, F. et al. 2009, ApJ, 702, 178-225
- (15) Longmore, S. N. et al., 2012, ApJ, 746, 117-127
- (16) Longmore, S. N. et al., 2011, ApJ, 726, 97
- (17) Bressert, E. et al., 2012, ApJL, 758, 28
- (18) Ginsburg, A. et al., 2012, ApJL, 758, 29