Structure formation in binary mixtures of lipids and detergents: Self-assembly and vesicle division
Abstract
Self-assembly dynamics in binary surfactant mixtures and structure changes of lipid vesicles induced by detergent solution are studied using coarse-grained molecular simulations. Disk-shaped micelles, the bicelles, are stabilized by detergents surrounding the rim of a bilayer disk of lipids. The self-assembled bicelles are considerably smaller than bicelles formed from vesicle rupture, and their size is determined by the concentrations of lipids and detergents and the interactions between the two species. The detergent-adsorption induces spontaneous curvature of the vesicle bilayer and results in vesicle division into two vesicles or vesicle rupture into worm-like micelles. The division occurs mainly via the inverse pathway of the modified stalk model. For large spontaneous curvature of the monolayers of the detergents, a pore is often opened, thereby leading to vesicle division or worm-like micelle formation.
I Introduction
Amphiphilic molecules such as lipids and detergents self-assemble into various structures in aqueous solutions Israelachvili (2011); Safran (1994); Jain and Bates (2003); Seddon et al. (2004); Caffrey (2009); Ujwal and Bowie (2011); Walter et al. (1991); Yamada et al. (2009); Jain and Bates (2004). A single type of simple surfactant can form spherical and cylindrical (worm-like) micelles, bilayer membranes, inverted hexagonal structures, and inverted micelles depending on the relative size of their hydrophilic parts Israelachvili (2011); Safran (1994). Aggregates of different types of surfactants can exhibit more complicated self-assembled structures such as undulated cylinders, octopus-like micelles, and vesicles connected with worm-like micelles Jain and Bates (2004); Christian et al. (2009). In mixtures of lipids and cone-shaped surfactants with a relatively large hydrophilic head, the edges of bilayer membranes are stabilized by surfactants, and a bilayer disk called bicelle is formed Seddon et al. (2004); Caffrey (2009); Ujwal and Bowie (2011); Walter et al. (1991); Yamada et al. (2009). The bicelle is an excellent medium to investigate protein functions, since membrane proteins can maintain their functionality in the bicelles Sanders and Prosser (1998); Ujwal and Bowie (2011). Bicelles can align in magnetic fields and are used for NMR studies Angelis and Opella (2007). The structures of several proteins have been determined by the bicelle method Ujwal and Bowie (2011); Faham and Bowie (2002).
The dynamics of micelle growth and subsequent vesicle formation have been studied experimentally by time-resolved scatting techniques (light, neutron, and X-ray) Leng et al. (2002); Weiss et al. (2005); Bryskhe et al. (2005); Madenci et al. (2011); Gummel et al. (2011). Mixtures of lipids (lecithin) and natural detergents (bile salts) Leng et al. (2002); Madenci et al. (2011) or cationic and anionic surfactants Weiss et al. (2005); Gummel et al. (2011) are often used in experiments, since the size and shape of the surfactant aggregates can be changed by the concentration variation. Bile salts are also typical detergents that are used to produce bicelles. The self-assembly of lipids into vesicles in single-component lipid systems has been studied using simulations of a meshless membrane model with and without hydrodynamics Noguchi and Gompper (2006a). However, in contrast, the self-assembly dynamics of lipids and detergents to form bicelles has not been completely understood. The first aim of this study is to investigate the self-assembly dynamics of binary mixtures of lipids and detergents.
When a detergent solution is added to a liposome suspension, the liposomes can dissolve. Experimental studies have revealed that liposomes take various types of solubilization pathways depending on the types of lipids and detergents Nomura et al. (2001); Staneva et al. (2005); Sudbrack et al. (2011); Tomita et al. (2011); Elsayed and Cevc (2011); Hamada et al. (2012); these including rhythmic shrinkage, bursting, budding, fission, peeling, and inside-out inversion. In particular, vesicle fission (or division) is considered an important dynamics since vesicle growth and division are two fundamental processes of the self-reproduction. Recently, the self-reproduction of vesicles has received growing attention in terms of both experiments Szostak et al. (2001); Hanczyc and Szostak (2004); Zepik and Walde (2008); Kurihara et al. (2011); Terasawa et al. (2012) and theory Svetina (2009); Božič and Svetina (2007), since it is one of the key functions of protocells. To our knowledge, surfactant-adsorption-induced vesicle division has been numerically investigated only in a few simulations carried out by Markvoort and coworkers Markvoort et al. (2010). The second aim of this study is to systematically investigate the dynamics and mechanism of detergent-adsorption-induced vesicle division.
Membrane fusion and fission are key events in various intra- and intercellular processes in living cells, and they have been intensively investigated Jahn and Grubmüller (2002); Chernomordik and Kozlov (2008); Nikolaus et al. (2011); Markvoort and Marrink (2011); Müller and Schick (2011). The fission dynamics of a bilayer membrane has been simulated for single-component Noguchi and Takasu (2002a, b); Noguchi (2003) and two-component membranes Yamamoto and Hyodo (2003); Smith and Uspal (2007); Markvoort et al. (2010). Membrane fission occurs via pathways opposite to those of membrane fusion via a stalk intermediate. In one of the fission pathways, the formation of a trans-monolayer contact Siegel (1993) induces the stalk formationNoguchi and Takasu (2002b); Markvoort et al. (2010), and in the other, stalk formation is induced by opening of a small pore Noguchi and Takasu (2002a); Yamamoto and Hyodo (2003). The control parameters that determine these fission and fusion pathways have not been well understood so far.
In order to simulate bilayer membranes on longer and larger scales, various types of coarse-grained molecular models have been proposed (see review articles Müller et al. (2006); Venturoli et al. (2006); Noguchi (2009); Marrink et al. (2009); Shinoda et al. (2012)). In the present study, we employ one of the solvent-free molecular models Noguchi (2011). In this model, membrane properties such as the bending rigidity and spontaneous curvature of the monolayer can be varied over wide ranges. In our previous study Noguchi (2012a), we found that the rupture of two-component vesicles can lead to the formation of variously shaped micelles and vesicles including bicelles and octopus-like micelles. We apply the same model to the molecular self-assembly into bicelles and detergent adsorption to vesicles in this paper.
In Sec. II, the surfactant model and simulation method are briefly described. In Sec. III, self-assembly from isolated molecules into bicelles and vesicles are investigated. In Sec. IV, detergent-adsorption-induced topological changes, vesicle division and rupture into worm-like micelles are described. The summary is provided in Sec. V.
II Model and Method
We employ a solvent-free molecular model Noguchi (2011, 2012a) to simulate two-component surfactant mixtures. One type (type A) of molecules is considered as the detergent molecule, being conically shaped with a relatively large head (the spontaneous curvature of the monolayer ). The other type (type B) is considered as a lipid with a cylindrical shape (). The surfactant model and simulation method are only briefly described here, since the details of the model can be found in Refs. Noguchi, 2011, 2012a.
Each (-th) molecule of the types A and B has a spherical particle with an orientation vector , which represents the direction from the hydrophobic to the hydrophilic part. There are two points of interaction in the molecule: the center of a sphere and a hydrophilic point . Type A molecules are considered for and type B for . The molecules interact with each other via the potential given by
| (1) | |||||
where , , , and denotes the thermal energy.
An excluded volume of the molecules with a diameter and an attractive interaction between the molecules are given by the first and second terms in Eq. (1), respectively. The two types of molecules can have different attractive strengths: for and for . The potential is given by
| (2) |
with . The local particle density is approximately the number of particles in the sphere with radius ,
| (3) |
where is a cutoff function Noguchi and Gompper (2006b),
| (4) |
with , , , and the cutoff radius .
The third and fourth terms in Eq. (1) are discretized versions of the tilt and bending potentials of the tilt model Hamm and Kozlov (1998, 2000), respectively. A smoothly truncated Gaussian function Noguchi and Gompper (2006b) is employed as the weight function
| (5) |
with , , and . The spontaneous curvatures of the monolayer membranes are varied by parameters and : , for , and for .
The last term in Eq. (1) represents the repulsion between the different types of molecules as a monotonic decreasing function: with , , , and .
The ensemble (constant number of molecules , volume , and temperature ) is used with periodic boundary conditions in a cubic box with side length . Underdamped Langevin equations [Brownian dynamics (BD)] are used for time evolution of the molecules. The motion of the center of the mass and the orientation are given by
| (6) | |||||
| (7) | |||||
| (8) |
where and denote the mass and the moment of inertia of the molecule, respectively. The forces are given by and with the perpendicular component , and a Lagrange multiplier is used to ensure that . The friction coefficients and and the Gaussian white noises and obey the fluctuation-dissipation theorem.
In this paper, we use , , , and . The type B (lipid) molecules form a fluid bilayer membrane with , and they have very low values of CMC. No molecules are detached from a single-component membrane of type B in typical simulation time scales. For the type A (detergent) molecules, the attraction range is set to so that these molecules have a finite CMC range to . The spontaneous curvature can be varied by the parameter as . Shiba and Noguchi (2011); Noguchi (2012b) At , . For type A molecules, the curvature parameter range is set to to ( to ). A single-component vesicle is ruptured into worm-like micelles when at . Noguchi (2011)
In order to investigate molecular self-assembly (Sec. III), we set randomly distributed gas states at and as initial states with and (the total concentration ). Subsequently, the simulations are begun with and ().
The repulsion between type A and type B molecules is varied from to . In tensionless membranes, the type A and B molecules are phase-separated at , and the line tension between the type A and type B domains increases with increasing : and at and , respectively. At , flat membranes become unstable; the membrane is ruptured from the domain boundary, and subsequently, type A molecules form worm-like micelles.
In order to investigate surfactant absorption into vesicles (Sec. IV), the type A molecules are distributed outside of a vesicle composed of type B molecules for , , and . The concentrations of the type A and B molecules are given by and , respectively. Before the execution of the product runs, the molecules are equilibriated at so that no type A molecules are absorbed into the vesicle. At the beginning of the product runs (), is changed to a negative value. The negative values of are used to generate attraction between type A and type B molecules. Positively-charged surfactants and negatively-charged surfactants can have similar attraction, and this attraction enhances absorption of the type A molecules into the vesicle.
The results are displayed with a length unit of , an energy unit of , and a time unit of . The error bars of the data are estimated from the standard errors of ten independent runs. The time unit is estimated as s from nm and the lateral diffusion coefficient cm2/s for phospholipids Wu et al. (1977).
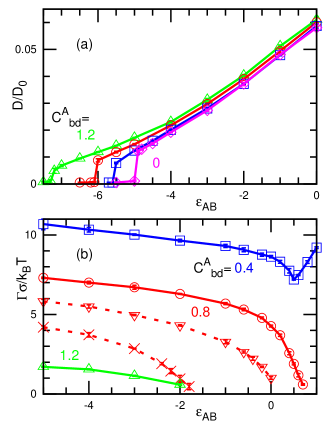
Figure 1 shows the dependence of the lateral diffusion coefficient and the effective line tension of the membrane edges. The quantities and are estimated from the mean square displacement and pressure tensor for , respectively Noguchi (2012a). As decreases, decreases and subsequently exhibits a jump into zero at . At , the membrane is in gel phase. Here, we mainly use the parameter region of fluid membranes. The line tension of the edges of two-component membranes depends on , since the positive spontaneous curvature of type A molecules can reduce the free energy of the edges. As increases, decreases and reaches a minimum value at the phase separation point. For completely phase-separated membranes, increases as the sum of the two line tensions: Noguchi (2012a) [see the blue line with squares in Fig. 1(b)]. With decreasing at , the line tension decreases, and subsequently, the bilayer edges become unstable, thereby leading to the formation of worm-like micelles.
III Self-assembly into bicelles
Figures 2–6 show the self-assembly dynamics of binary mixtures of detergents (type A molecules) and lipids (type B). First, isolated molecules aggregate into small spherical micelles. These micelles fuse and grow into disk-like micelles. In a single-component system (), large disk-like micelles of size close into vesicles via a bowl shape. In two-component systems, the type A molecules surround the rim of the bilayer disks of the type B molecules, and they can stabilize the disk-shaped micelles, bicelles (see Fig. 2). As the number fraction of the type B molecules or increases, larger bicelles are formed.
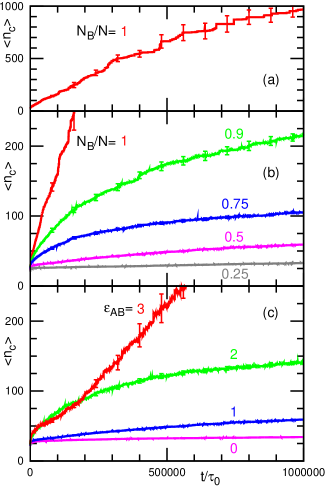
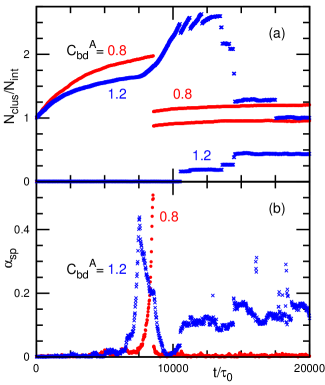
Figure 5 shows the time development of the mean cluster size defined as
| (9) |
where is the number of clusters of size , and the notation denotes the average for ten independent simulation runs. We consider that molecules belong to a cluster when their distance is less than . For binary mixtures, the growth of the clusters saturates as the disk rims are covered by the type A molecules [see Fig. 5(b)]. In the single-component system, increases linearly with time until vesicle formation starts at [see Fig. 5(a)]. This behavior agrees with our previous results obtained by simulations of the meshless membrane model and by Smoluchowski rate equations Noguchi and Gompper (2006a). In our previous study, it was found that hydrodynamic interactions increase the rate of aggregation but do not change the qualitative dynamics of the self-assembly. Since hydrodynamic interactions do not change the essence of the dynamics, in this study, we neglect them and use only BD.
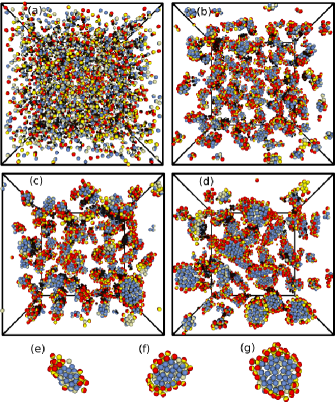
As increases, the cluster size increases [see Fig. 5(c)]. This increase is caused by the formation of larger bicelles for [compare Figs. 2 and 4(a)], but by separation of the type A domain for . At , the circumferences of the type B disks are not completely surrounded by type A molecules [see Fig. 4(b)], so that it is in a partial wetting condition of the type A domains at open edges of the type B domains de Gennes et al. (2003); Noguchi (2012a). At , the small micelles initially consist of both surfactants; however, the two surfactants eventually form completely separated aggregates. The type A molecules form spherical micelles and the type B molecules form bilayer disks or vesicles (see Fig. 3).
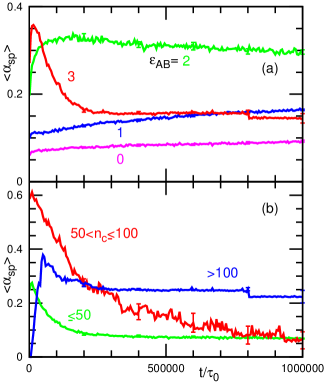
The shapes of micelles are investigated by calculating a shape parameter, asphericity , which is expressed as Rudnick and Gaspari (1986)
| (10) |
where are the eigenvalues of the gyration tensor of each micelle. The asphericity is the degree of deviation from a spherical shape: for spheres, for thin rods, and for thin disks. The time development of the mean asphericity is shown in Fig. 6. For , the increase in simply reflects an increase in the cluster size, since the value of each size is almost time-independent: (quasi-spherical shapes) and (disks) for and , respectively. For , the cluster shape of each size changes in time [see Fig. 6(b)]. Small micelles in the early stage, , exhibit elongated shapes (), where one or two spherical type A domains are connected to a spherical type B domain [see Figs. 3(e) and (f)]. Subsequently, the cluster growth results in the detachment of the type A domains, as the type A domains become sufficiently large to form stable separated micelles. This detachment yields a dip in the time evolution curve of the mean cluster size at . After the detachment, the type B bilayer disks continue to grow, subsequently resulting in the vesicle formation [see Figs. 3(c) and (d)].
Next, we estimate the bicelle size in a monodisperse distribution. We assume that a bicelle consists of a bilayer disk of the type B domain with radius and a surrounding ring of the type A domain with radius . The number of type A and type B molecules in the bicelle are expressed as and , respectively, where and are the circumference length and area per molecule. The factor is multiplied to the number of molecules because the membrane has two lipid layers. In the monodisperse distribution, the number of molecules are given by
| (11) | |||||
and for and . For , , , and with and , the total number of molecules in the bicelle are , , , and , respectively. These estimations agree with the simulation results.
The bicelle size varies depending on the initial conditions of the simulations. When a vesicle is used as the initial state instead of a random gas distribution, the ruptured vesicle opens up into a few large bicelles Noguchi (2012a). The excess type A molecules form worm-like micelles or dissolve as isolated molecules. This scenario is different from the self-assembled bicelles in the present simulations, where most of the type A molecules belong to bicelles for . Although the number of detergent molecules in bicelles can be changed via isolated molecules, the number of lipid molecules can be changed only by fusion and fission of micelles. Therefore, the growth of the bicelles becomes extremely slow after stable bicelles, whose rims are completely covered by the detergents, are formed. The bicelle size is determined more by kinetics and depends on the initial states. Thus, the sample preparation method is important to control the bicelle size.
IV Surfactant absorption into vesicles
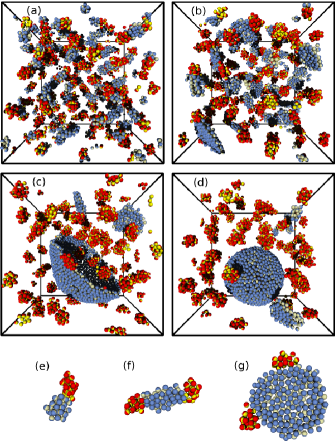
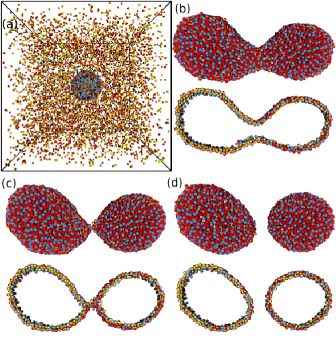
In this section, we investigate the morphological changes of vesicles that are induced by detergent adsorption. A lipid vesicle of type B molecules is placed in a solution of type A molecules [see Fig. 7(a)]. The detergent adsorption induces vesicle division into two vesicles or rupture into worm-like micelles depending on the spontaneous curvature () of the type A molecules and the attractive interaction between different molecules.
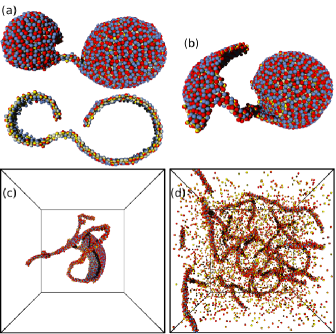
Figures 7-9 show typical examples of the vesicle division and rupture. The detergent adsorption first generates an increase in the vesicle size [see Fig. 9(a)]. Subsequently the vesicle transforms into a pear-shape, which leads to topological changes [see Fig. 9(b)]. The type A molecules are adsorbed onto the outer monolayer (leaflet) of the vesicle, and subsequently, they slowly move to the inner monolayer. The resultant asymmetric distribution of the molecules induces an effective spontaneous curvature of the bilayer. The curvature is caused by two mechanisms. One is the mismatch between the area difference of the two monolayers and the number difference of the molecules in two monolayers as defined in the area difference elasticity (ADE) model Seifert (1997); Svetina (2009); Sakashita et al. (2012). The other is the spontaneous curvature of the bilayer, which is induced by the asymmetric distribution of type A molecules when . The outer monolayer contains more type A molecules than the inner monolayer. At , the curvature is induced only by the area difference, and the contribution due to the molecular curvature increases with increasing .
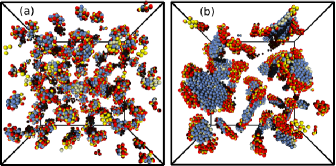
For the vesicle division (see Fig. 7 and corresponding Movie foo ), parts of the inner monolayer come into contact with each other on the inside of the pear neck and subsequently, the inner monolayer is separated by the outer (trans) monolayer (this saddle-point structure is called the trans-monolayer contact). The subsequent formation of a short cylindrical structure called stalk [see Fig. 7(c)] leads to the division of the vesicle. The two resultant vesicles can have sizes equal to that of the original vesicle [see the red lines in Fig. 9(a)]. This division pathway is the inverse version of membrane fusion in the modified stalk model Siegel (1993). While this pathway is dominant among the topological changes, other dynamics are also at play. At , the large effective spontaneous curvature of the bilayer causes the opening of a pore at the neck of the pear-shaped vesicle. This in turn leads to the formation of worm-like micelles or to vesicle division. The neck transforms into a cylindrical micelle structure and grows to form worm-like micelles. Other worm-like micelles grow from the edges of the flat bilayer (see Fig. 8 and corresponding Movie foo ). After the pore is opened, the surface area for absorption increases (the area of the inner monolayer and the worm-like arms), so that the absorption rate increases (see Fig. 9). At , no worm-like micelles are formed while some vesicles transform into worm-like micelles at [see Fig. 10(a)]. In some simulations at , the opened pores do not expand but lead to pinch-off of the neck [the cylindrical connection in the middle of Fig. 8(a)], and subsequently the two pores are closed resulting the formation of two vesicles (occasionally a vesicle and worm-like micelles). This pore opening is similar to the inverse version of the side-pore (or stalk-bending) fusion pathway Noguchi (2009); Noguchi and Takasu (2001, 2002a); Müller et al. (2003), although the present simulation does not exhibit the stalk intermediate stage during the division. At , the neck of the stalk structure often transforms to a bilayer disk and is detached as a disk-like micelle.
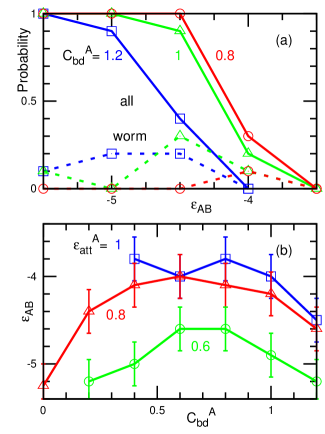
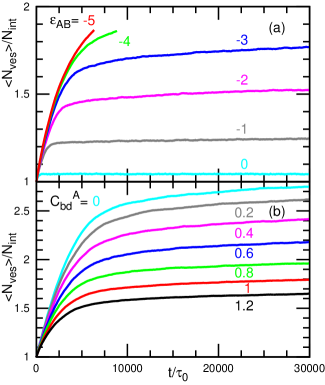
The number of absorbed detergents increases with increasing attraction between the two types of molecules and with decreasing (see Fig. 11). As decreases from to for , larger vesicles are formed. At , three of ten vesicles show topological changes and the other seven maintain a form of closed vesicles [see Fig. 10(a)]. The shape transition point is considered as the value at which half of the vesicles show either division or rupture. The transition occurs at weaker levels of attraction for the middle range of as shown in Fig. 10(b). This is caused by the competition of two effects. With increasing , a lesser number of type A molecules are absorbed into the vesicle but the bilayer membrane becomes less stable for the same amount of absorption. We conclude that the detergents with middle spontaneous curvature () most efficiently induce vesicle division.
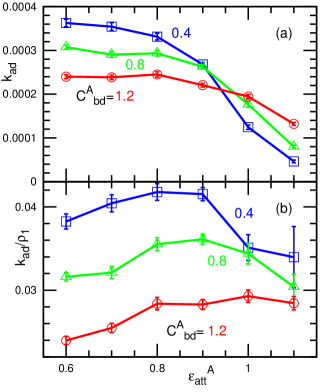
The initial rate of vesicle growth is independent of when [see Fig. 11(a)], since all the detergent molecules making contact with the vesicle are absorbed into the vesicle when the attraction is sufficiently larger than the thermal energy. The growth rate decreases with as shown in Fig. 12(a). This is caused by lower CMC values at larger values of . A smaller amount of detergents remains as isolated molecules at larger values of . When the growth rate is normalized by the concentration of isolated molecules, it becomes almost constant, as shown in Fig. 12(b). If the concentration is higher than the CMC, the initial adsorption rate would not depend on while the later evolution dynamics might be modified by . Here, we consider a fixed concentration of detergents . At higher values of , the divided vesicle may exhibit second and third divisions.
Since a solvent-free model is employed, the vesicle can freely change its volume. This condition corresponds to high water permeability in comparison to the detergent adsorption rate. The theoretical study by Svetina and Božič Svetina (2009); Božič and Svetina (2007) suggests that higher permeability more easily induces vesicle division. Our simulation results suggest that the addition of detergent molecules with slightly large head size efficiently induces vesicle division.
V Summary
We have studied structure formation dynamics in mixtures of lipids and detergents. Bicelles are formed by self-assembly from a binary mixture of isolated molecules. The size of self-assembled bicelles increases with the increasing number fraction of lipids and repulsion between different molecules. When a vesicle is used as the an initial simulation state, a large bicelle can be formed, and the excess amount of the detergent molecules form worm-like micelles. In contrast, in self-assembly, most of detergent molecules are contributed to surround the rims of bicelles. Thus, the size of the bicelles are determined by the initial states and assembly kinetics.
When a vesicle is placed in detergent solution, the detergent adsorption induces vesicle division or vesicle rupture into worm-like micelles. The vesicle transforms into a pear shape and the contact of the inner monolayers (leaflets) on the inside of the pear neck induces vesicle division via the stalk intermediate in the modified stalk model. At large values of spontaneous curvature of the detergent monolayers, a pore is often opened in the pear neck, and this leads to vesicle division or worm-like micelle formation. A similar vesicle division has been experimentally observed in multi-component surfactant systems. Tomita et al. (2011); Szostak et al. (2001); Hanczyc and Szostak (2004); Zepik and Walde (2008); Markvoort et al. (2010); Kurihara et al. (2011); Terasawa et al. (2012)
While our studies successfully reproduced two types of detergent-induced topological changes, other dynamics are observed in experiments such as the inside-out inversion of vesicles. Nomura et al. (2001) A pore-opening on the vesicle leads to the formation of a vesicle, whose outer monolayer is formed by the inner monolayer of the original vesicle. The adsorbed detergents form micelles with lipids in the outer monolayer and cause removal of the lipids from the outer monolayer, so that a negative spontaneous curvature of the bilayer is induced. This process has not been well understood and no simulations on this process have been reported. Since the size of spherical particles used for both molecules is the same in our simulations, they do not easily form micelles only from the outer monolayer. Thus, smaller detergent model molecules are likely necessary to simulate the vesicle inversion. The mechanisms to determine the assembly and lysis dynamics are not understood completely, and open problems remain for further studies.
Acknowledgements.
The computation in this work was partially done using the facilities of the supercomputer Center, Institute for Solid State Physics, University of Tokyo. This study is partially supported by a Grant-in-Aid for Scientific Research on Priority Area “Molecular Science of Fluctuations toward Biological Functions” from the Ministry of Education, Culture, Sports, Science, and Technology of Japan.References
- Israelachvili (2011) J. N. Israelachvili, Intermolecular and surface forces (Academic Press, Burlington, MA, 2011), 3rd ed.
- Safran (1994) S. A. Safran, Statistical Thermodynamics of Surfaces, Interfaces, and Membranes (Addison-Wesley, Reading, MA, 1994).
- Jain and Bates (2003) S. Jain and F. S. Bates, Science 300, 460 (2003).
- Seddon et al. (2004) A. M. Seddon, P. Curnow, and P. J. Booth, Biochim. Biophys. Acta 1666, 105 (2004).
- Caffrey (2009) M. Caffrey, Annu. Rev. Biophys. 38, 29 (2009).
- Ujwal and Bowie (2011) R. Ujwal and J. U. Bowie, Methods 55, 337 (2011).
- Walter et al. (1991) A. Walter, P. K. Vinson, A. Kaplun, and Y. Talmon, Biophys. J. 60, 1315 (1991).
- Yamada et al. (2009) N. L. Yamada, M. Hishida, and N. Torikai, Phys. Rev. E 79, 032902 (2009).
- Jain and Bates (2004) S. Jain and F. S. Bates, Macromol. 37, 1511 (2004).
- Christian et al. (2009) D. A. Christian, A. Tian, W. G. Ellenbroek, I. Levental, K. Rajagopal, P. A. Janmey, A. J. Liu, T. Baumgart, and D. E. Discher, Nat. Mater. 8, 843 (2009).
- Sanders and Prosser (1998) C. R. Sanders and R. S. Prosser, Struct. 6, 1227 (1998).
- Angelis and Opella (2007) A. A. D. Angelis and S. J. Opella, Nat. Protoc. 2, 2332 (2007).
- Faham and Bowie (2002) S. Faham and J. U. Bowie, J. Mol. Biol. 316, 1 (2002).
- Leng et al. (2002) J. Leng, S. U. Egelhaaf, and M. E. Cates, Europhys. Lett. 59, 311 (2002).
- Weiss et al. (2005) T. M. Weiss, T. Narayanan, C. Wolf, M. Gradzielski, P. Panine, S. Finet, and W. I. Helsby, Phys. Rev. Lett. 94, 038303 (2005).
- Bryskhe et al. (2005) K. Bryskhe, S. Bulut, and U. Olsson, J. Phys. Chem. B 109, 9265 (2005).
- Madenci et al. (2011) D. Madenci, A. Salonen, P. Schurtenberger, J. S. Pedersen, and S. U. Egelhaaf, Phys. Chem. Chem. Phys. 13, 3171 (2011).
- Gummel et al. (2011) J. Gummel, M. Sztucki, T. Narayanan, and M. Gradzielski, Soft Matter 7, 5731 (2011).
- Noguchi and Gompper (2006a) H. Noguchi and G. Gompper, J. Chem. Phys. 125, 164908 (2006a).
- Nomura et al. (2001) F. Nomura, M. Nagata, T. Inaba, H. Hiramatsu, H. Hotani, and K. Takiguchi, Proc. Natl. Acad. Sci. USA 98, 2340 (2001).
- Staneva et al. (2005) G. Staneva, M. Seigneuret, K. Koumanov, G. Trugnan, and M. I. Angelova, Chem. Phys. Lipids 136, 55 (2005).
- Sudbrack et al. (2011) T. P. Sudbrack, N. L. Archilha, R. Itri, and K. A. Riske, J. Phys. Chem. B 115, 269 (2011).
- Tomita et al. (2011) T. Tomita, T. Sugawara, and Y. Wakamoto, Langmuir 27, 10106 (2011).
- Elsayed and Cevc (2011) M. M. A. Elsayed and G. Cevc, Biochim. Biophys. Acta 1808, 140 (2011).
- Hamada et al. (2012) T. Hamada, H. Hagihara, M. Morita, M. C. Vestergaard, Y. Tsujino, and M. Takagi, J. Phys. Chem. Lett. 3, 430 (2012).
- Szostak et al. (2001) J. W. Szostak, D. P. Bartel, and P. L. Luisi, Nature 409, 387 (2001).
- Hanczyc and Szostak (2004) M. M. Hanczyc and J. W. Szostak, Curr. Opin. Chem. Biol. 8, 660 (2004).
- Zepik and Walde (2008) H. H. Zepik and P. Walde, ChemBioChem 9, 2771 (2008).
- Kurihara et al. (2011) K. Kurihara, M. Tamura, K. Shohda, T. Toyota, K. Suzuki, and T. Sugawara, Nat. Chem. 3, 775 (2011).
- Terasawa et al. (2012) H. Terasawa, K. Nishimura, H. Suzuki, T. Matsuura, and T. Yomo, Proc. Natl. Acad. Sci. USA 109, 5942 (2012).
- Svetina (2009) S. Svetina, ChemPhysChem 10, 2769 (2009).
- Božič and Svetina (2007) B. Božič and S. Svetina, Eur. Phys. J. E 24, 79 (2007).
- Markvoort et al. (2010) A. J. Markvoort, N. Pfleger, R. Staffhorst, P. A. J. Hilbers, R. A. van Santen, J. A. Killian, and B. de Kruijff, Biophys. J. 99, 1520 (2010).
- Jahn and Grubmüller (2002) R. Jahn and H. Grubmüller, Curr. Opin. Cell Biol. 14, 488 (2002).
- Chernomordik and Kozlov (2008) L. V. Chernomordik and M. M. Kozlov, Nat. Struct. Mol. Biol. 15, 675 (2008).
- Nikolaus et al. (2011) J. Nikolaus, J. M. Warner, B. O’Shaughnessy, and A. Herrmann, Curr. Top. Membr. 68, 1 (2011).
- Markvoort and Marrink (2011) A. J. Markvoort and S. J. Marrink, Curr. Top. Membr. 68, 259 (2011).
- Müller and Schick (2011) M. Müller and M. Schick, Curr. Top. Membr. 68, 295 (2011).
- Noguchi and Takasu (2002a) H. Noguchi and M. Takasu, Biophys. J. 83, 299 (2002a).
- Noguchi and Takasu (2002b) H. Noguchi and M. Takasu, Phys. Rev. E 65, 051907 (2002b).
- Noguchi (2003) H. Noguchi, Phys. Rev. E 67, 041901 (2003).
- Yamamoto and Hyodo (2003) S. Yamamoto and S. A. Hyodo, J. Chem. Phys. 118, 7937 (2003).
- Smith and Uspal (2007) K. A. Smith and W. E. Uspal, J. Chem. Phys. 126, 075102 (2007).
- Siegel (1993) D. P. Siegel, Biophys. J. 65, 2124 (1993).
- Müller et al. (2006) M. Müller, K. Katsov, and M. Schick, Phys. Rep. 434, 113 (2006).
- Venturoli et al. (2006) M. Venturoli, M. M. Sperotto, M. Kranenburg, and B. Smit, Phys. Rep. 437, 1 (2006).
- Noguchi (2009) H. Noguchi, J. Phys. Soc. Jpn. 78, 041007 (2009).
- Marrink et al. (2009) S. J. Marrink, A. H. de Vries, and D. P. Tieleman, Biochim. Biophys. Acta 1788, 149 (2009).
- Shinoda et al. (2012) W. Shinoda, R. DeVane, and M. L. Klein, Curr. Opin. Struct. Biol. 22, 175 (2012).
- Noguchi (2011) H. Noguchi, J. Chem. Phys. 134, 055101 (2011).
- Noguchi (2012a) H. Noguchi, Soft Matter 8, 8926 (2012a).
- Noguchi and Gompper (2006b) H. Noguchi and G. Gompper, Phys. Rev. E 73, 021903 (2006b).
- Hamm and Kozlov (1998) M. Hamm and M. M. Kozlov, Eur. Phys. J. B 6, 519 (1998).
- Hamm and Kozlov (2000) M. Hamm and M. M. Kozlov, Eur. Phys. J. E 3, 323 (2000).
- Shiba and Noguchi (2011) H. Shiba and H. Noguchi, Phys. Rev. E 84, 031926 (2011).
- Noguchi (2012b) H. Noguchi, Soft Matter 8, 3146 (2012b).
- Wu et al. (1977) E. S. Wu, K. Jacobson, and D. Papahadjopoulos, Biochemistry 16, 3936 (1977).
- de Gennes et al. (2003) P. G. de Gennes, F. Brochard-Wyart, and D. Quere, Capillarity and wetting phenomena: Drops, bubbles, perls, waves (Springer, New York, 2003).
- Rudnick and Gaspari (1986) J. Rudnick and G. Gaspari, J. Phys. A: Math. Gen. 19, L191 (1986).
- Seifert (1997) U. Seifert, Adv. Phys. 46, 13 (1997).
- Sakashita et al. (2012) A. Sakashita, N. Urakami, P. Ziherl, and M. Imai, Soft Matter 8, 8569 (2012).
- (62) See supplementary material at [XXX] for movies of vesicle division and worm-like micelle formation.
- Noguchi and Takasu (2001) H. Noguchi and M. Takasu, J. Chem. Phys. 115, 9547 (2001).
- Müller et al. (2003) M. Müller, K. Katsov, and M. Schick, Biophys. J. 85, 1611 (2003).