The luminosity function of diverse satellite galaxy systems
Abstract
The high-resolution, SPH galaxies of the McMaster Unbiased Galaxy Survey (MUGS) are used to examine the satellite systems of sixteen model host galaxies. Each galaxy has a different mass, angular momentum and merger history that yield a rich set of satellite luminosity functions. With new observations of distant satellite systems, we can compare these luminosity functions to satellite systems beyond the Local Group. We find that the luminosity functions of our simulations compare well to observations when the luminosity functions are scaled according to host mass. We use the recently-found relationship between dwarf satellites and host mass in distant satellite systems (Trentham & Tully, 2009) to normalize a theoretical, complete luminosity function for the Milky Way (Koposov et al., 2008). The luminosity function of satellites, expressed as a function of the host mass, is given by , where mass is given in . The mass of a host galaxy can be used to predict the number of dwarf satellites and even when considering spiral and elliptical hosts separately this relation holds.
keywords:
galaxies: dwarf — cosmology: theory — galaxies: evolution — methods: N-Body simulations — methods: numerical1 Introduction
Dwarf galaxies are the most common objects in the Universe today (Marzke & da Costa, 1997). Their numbers provide insight into many aspects of the evolution of the Universe from the composition of dark matter to how star formation affects galaxy formation. Dwarf galaxies are however difficult to observe because of their low surface brightness and a detailed census of dwarf galaxies on large scales remains a daunting challenge. Only for the most nearby systems is a complete counting of dwarf galaxies possible. Such accounting leads to the well-known discrepancy between the lower observed number of satellites in the Local Group and the higher number predicted in numerical simulations (Moore et al., 1999; Klypin et al., 1999), also known as the missing satellites problem.
Up until now, however, the observed data set has been limited. Two recent developments, observation of fainter dwarfs and the discovery of satellites outside the Local Group, for the first time yield data sets that allow for a study of the large-scale statistics of satellites galaxies.
Large surveys, including the Sloan Digital Sky Survey (SDSS) (Abazajian et al., 2009) and PAndAS (McConnachie et al., 2008; Martin et al., 2009; Richardson et al., 2011), bring observations to even lower surface brightness levels and have revealed a new category of dwarf galaxies: the ultra faint dwarfs (Willman et al., 2005; Belokurov et al., 2007; Koposov et al., 2008). Currently these large surveys do not cover the entire sky and there may well be ultra faint dwarfs too faint for current instrumentation. Koposov et al. (2008) have calculated a theoretical and complete luminosity function of the Milky Way, based on observations of ultra faint dwarfs and it compensates for the incomplete sky coverage.
Beyond ultra faint dwarfs within our own Local Group, dwarf satellites in other systems are being revealed as well. It is preferable to study satellites in varied environments, as opposed to the Local Group exclusively, even though the Milky Way appears to be typical in terms of the abundance of classical satellites (Strigari & Wechsler, 2011). Observations of galaxy clusters have previously yielded the luminosity functions of cluster galaxies (e.g. Abell, 1977; Jones & Jones, 1980; Binggeli et al., 1985) and more recently follow the mass limit down to resolve the satellites of the galaxies themselves. These include M101 (Holmberg, 1950), the nearby Virgo Cluster (Sandage et al., 1985), the Fornax Cluster (Ferguson & Sandage, 1988), the Ursa Major Cluster (Trentham et al., 2001), NGC 5846 (Mahdavi et al., 2005), NGC 1407 (Trentham et al., 2006), NGC 5371 (Tully & Trentham, 2008), M81 (Chiboucas et al., 2009), NGC1023 (Trentham & Tully, 2009), the Coma cluster (Chiboucas et al., 2011), the Antlia cluster (Smith Castelli et al., 2011), and other systems using the Sloan Digital Sky Survey (Tollerud et al., 2011; Lares et al., 2011).
These two developments from the observational end have alleviated the traditional missing satellites problem by increasing the number of satellite galaxies. From the theoretical end, simulations that take baryonic physics into account have also helped to close the the discrepancy between the number of observed satellites and predicted dark matter subhalos (e.g. Governato et al., 2007; Macciò et al., 2009; Okamoto et al., 2009; Wadepuhl & Springel, 2010; Nickerson et al., 2011). In these simulations, a large fraction of subhalos contain only trace quantities of baryons and accordingly may only be observed through gravitational lensing and other gravity-based methods. However, other details still remain to be solved; for example, comparison of the faintest satellites is compromised by the limited resolution of the simulations, and there are discrepancies between the internal kinematics of observed satellites and the structure of the dark matter subhalos they are predicted to inhabit (Boylan-Kolchin et al., 2011).
When studying this new wealth of dwarf galaxies, both observed and simulated, it is also important to consider how the environment, chiefly the properties of the host galaxy, affect the satellites. Previous studies have focussed on brighter and more massive galaxies (e.g. Christlein, 2000; Nichol et al., 2003; Balogh et al., 2004), while we are concerned with how environment affects the newly-observed satellite galaxies in distant systems.
Trentham & Tully (2009) studied the spiral-rich group of galaxies around NGC 1023, whose luminosity function has a characteristic magnitude and faint-end slope (Press & Schechter, 1974; Schechter, 1976). They combined their new findings with the host galaxies NGC 1407, NGC 5846, NGC 5353/4, M81, and the Local Group. The galaxies’ masses range from a little over M☉to almost M☉, and each contain 15 to 250 satellites within the stated credibility limit of . They divided the satellites into giants and dwarfs at and compared the total number of satellites in each category to host mass. For the dwarf satellites they found a tight correlation with host mass:
| (1) |
while giants had a looser correlation:
| (2) |
This suggests that the number of dwarf satellites is more accurately predicted by host mass, while giant satellites are not plentiful enough to provide as reliable statistics.
We combine Trentham & Tully’s (2009) data set of dwarf mass to host mass with Koposov et al.’s (2008) theoretically complete luminosity function for the Milky Way to establish a final luminosity function that scales with the mass of a host galaxy. We will verify that our simulations are well-described by this, and also find that the relation remains the same for spiral and elliptical hosts.
In section §2 we briefly review the MUGS simulations and halo finding method; in §3 we introduce the sixteen host systems studied and detail the luminosity function of each; in §4 we compare our satellite luminosity functions to the Press-Schecheter function and the Trentham-Tully relation to justify its use; and our conclusions are §5.
2 Method
We analyse the subhalos of sixteen galaxies from the McMaster Unbiased Galaxy Survey (MUGS) (Stinson et al., 2010), a sample of M∗ galaxies simulated at high resolution. MUGS was run using the SPH code gasoline (Wadsley et al., 2004). gasoline includes low-temperature metal cooling (Shen et al., 2010), UV background radiation, star formation that models the Kennicutt-Schmidt Law (Kennicutt, 1998), and physically-motivated stellar feedback from the “blastwave model” (Stinson et al., 2006). The metal cooling grid is constructed using CLOUDY (version 07.02 Ferland et al. (1998)), assuming ionisation equilibrium. A uniform ultraviolet ionising background, adopted from Haardt & Madau (in preparation; see Haardt & Madau (1996)), is used in order to calculate the metal cooling rates self-consistently. The UV starts to have an effect at . With these prescriptive elements, Nickerson et al. (2011) found that the resulting model galaxies do not exhibit the missing satellite problem. This results from a combination of early UV heating, ram pressure stripping, tidal stripping and stellar feedback that substantially modify the mass-to-light ratios of the model galaxies’ satellites. This is a prediction of the simulations and does not involve any specific tuning in the galaxy model.
We evolve several 50 Mpc volumes of a WMAP3 CDM universe (=73 km s-1 Mpc-1, =0.24, =0.76, =0.04, and =0.79) (Spergel et al., 2007). From these galaxies we choose a random selection with halo masses between M☉ and M☉ that did not evolve within 2.7 Mpc of a structure more massive than M☉. The sample is unbiased with regards to angular momentum, merger history, and less massive neighbours and it is desired that the sample will reproduce the observed spread in galaxy properties. The selected galaxies are then re-simulated with the commonly-used zoom technique, which adds high resolution dark matter and baryons in the region of interest, while maintaining the periferal galaxies at low resolution to provide the appropriate tidal torques. The initial dark matter, gas and star particle masses are M☉, M☉and M☉respectively. Each type of particle uses a constant gravitational softening length, 310 pc. A full description of MUGS can be found in Stinson et al. (2010).
In order to identify a host galaxy and its subhalos, we use the Amiga Halo Finder (AHF) (Knollmann & Knebe, 2009). AHF is based on the spherical overdensity method to identify density peaks using an adaptive mesh algorithm. AHF cuts out halos (and subhalos) of identified density peaks using isodensity contours. A simple unbinding procedure is used to determine whether the particles are gravitationally bound to a halo or its subhalos.
3 Sixteen Systems of Satellites
| Galaxy | Mass | Class | Rvir | Ngas | Nstar | Ndark | Masssat | Nsat | Nlume |
|---|---|---|---|---|---|---|---|---|---|
| (M☉) | (kpc) | ( M) | |||||||
| g7124 | 5.0 | E | 165 | 1.4 | 1.2 | 3.7 | 7.8 | 37 | 9 |
| g5664 | 5.7 | S | 173 | 2.0 | 1.1 | 4.3 | 3.3 | 43 | 8 |
| g8893 | 6.7 | E | 182 | 2.2 | 1.4 | 5.0 | 2.5 | 57 | 10 |
| g1536 | 7.5 | S | 190 | 2.7 | 1.4 | 5.7 | 1.5 | 56 | 7 |
| g21647 | 8.8 | S | 200 | 3.0 | 1.8 | 6.7 | 14 | 63 | 10 |
| g22795 | 9.2 | E | 203 | 3.1 | 1.5 | 7.1 | 3.5 | 76 | 11 |
| g22437 | 9.5 | E | 206 | 3.8 | 1.7 | 7.2 | 7.3 | 72 | 9 |
| g422 | 11 | S | 218 | 4.0 | 2.3 | 8.5 | 32 | 108 | 16 |
| g3021 | 11 | E | 218 | 3.9 | 2.5 | 8.5 | 7.8 | 110 | 17 |
| g24334 | 12 | S | 221 | 3.7 | 2.5 | 8.9 | 18 | 113 | 26 |
| g28547 | 13 | S | 226 | 4.0 | 2.9 | 9.4 | 26 | 107 | 18 |
| g4720 | 13 | S | 229 | 5.2 | 2.1 | 10 | 17 | 151 | 27 |
| g25271 | 14 | E | 233 | 4.6 | 2.4 | 11 | 3.3 | 96 | 12 |
| g15784 | 15 | S | 240 | 5.3 | 2.6 | 12 | 11 | 96 | 21 |
| g4145 | 15 | S | 239 | 5.7 | 2.8 | 1.1 | 19 | 130 | 29 |
| g15807 | 23 | E | 276 | 8.7 | 4.0 | 17 | 11 | 161 | 33 |
MUGS consists of sixteen galaxies simulated at high resolution each with identical baryonic physics. Their masses, morphologies, virial radii and the number of gas, star, and dark particles at redshift zero are given in Table 1, illustrating the diversity of MUGS. The total mass of satellites in the system found by AHF with fifty or more particles, the number of satellites and the number that are luminous at redshift zero are also included. g8893, g422, g3021, g28547, g4720, g4145, and g15807 are presented here for the first time111Images of these galaxies can be found at http://mugs.mcmaster.ca/, while the rest were presented in Stinson et al. (2010).
For reference, current estimates of the mass of the Milky Way are around M☉(Klypin et al., 2002; Bovy et al., 2012) and and for M31 are around M☉(Foreman-Mackey, 2010). Finding these masses is still a very active and ongoing field of research.
Details of how we calculated the luminosity for each subhalo can be found in Nickerson et al. (2011), using the initial mass functions of Kroupa et al. (1993) and the luminosity grid from CMD 2.1 (Leitherer et al., 1999; Marigo et al., 2008).
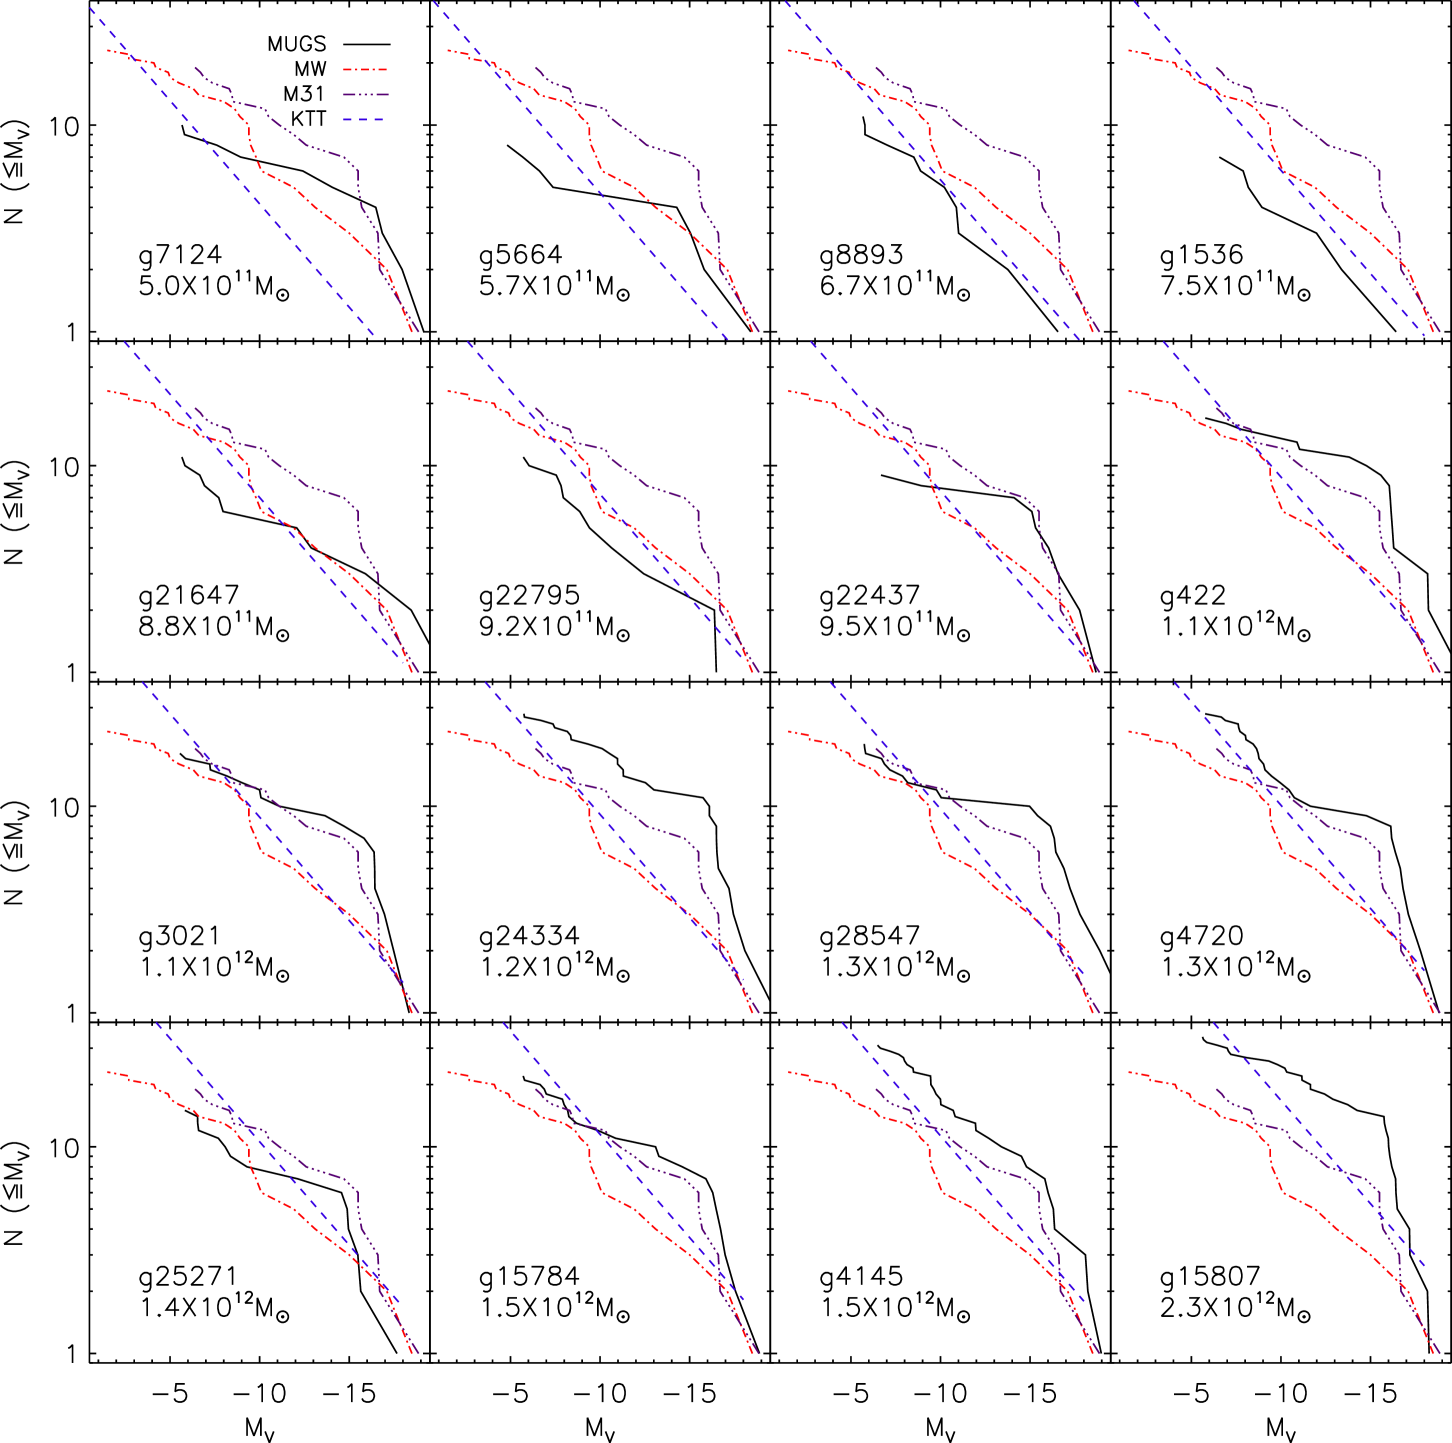
Figure 1 shows the cumulative V-band luminosity function of the subhalo populations of the sixteen host galaxies, ordered by mass, at . Also shown is the Tollerud et al. (2008) data for the Milky Way that includes both the classical satellites and the new ultra-faint dwarf galaxies (which are fainter than the resolution of our simulations) and the luminosity function of M31. The classical M31 satellites are taken from Mateo (1998) with the addition of newly-discovered ultra faint dwarfs (Brasseur et al., 2011; Slater et al., 2011; Bell et al., 2011).
It is believed that the set of ultra faint dwarfs observed in the Local Group is incomplete because of their low surface brightness and incomplete sky coverage of the Sloan Digital Sky Survey. Koposov et al. (2008) provides a theoretical function that would represent a complete set of subhalos with V-band magnitudes from -2 to -11 for the Milky Way given by
| (3) |
where is the number of satellites that have a magnitude of or brighter. However, in order to look at the luminosities for systems of satellites in non-Milky Way-like hosts we need to readjust the normalization, i.e. the total number of satellites expected in different sized galaxies. For this we use the Trentham-Tully relation (Trentham & Tully, 2009):
| (4) |
where is the total number of dwarf galaxies with R-band magnitudes between -11 and -17 for host of mass in . We only use the dwarf satellites for this and not the giants, for reasons that are detailed in §4. Some speculation is involved here because Koposov et al. (2008) and Tollerud et al. (2008) have differing magnitude limits, Tollerud et al. (2008) being limited by low surface brightness, which is why we will need to test this in §4 and ensure that it works. Because the range in the Trentham-Tully relation is given in the R-band, while the V-band is used for the Koposov function, we need to convert the range. From our sample of 280 luminous satellites in MUGS, we find that . The final expression for the luminosity function as a function of the host mass and V-band magnitude is:
| (5) |
and this is also shown in Figure 1 alongside the luminosity functions of the MUGS simulations.
The Milky Way and M31 luminosity functions have different shapes. The Milky Way remains as a steady power law for high luminosity satellites. M31 has a knee, showing a higher number of high luminosity satellites. Correspondingly, a few of our galaxies also match the M31 shape better than the Milky Way’s, notably g422, g3021 and g15784. On the other hand, g8893, g22795, and g4145 match the shape of the Milky Way luminosity function, as given by Tollerud et al. (2008) closely. However, most other galaxies display an excess knee in high luminosity satellites compared to the Milky Way. We will now examine the total number itself.
Of the galaxies that are less massive than the Milky Way and go up to its mass, ranging from to of its mass, g7124 and g8893 have a similar cumulative number of satellites compared to the normalized power law Equation 5. g5664, g1536, g21647, g22795, and g22437 are relatively satellite-poor, though are still within an order of magnitude of what is predicted.
The Milky Way-like-in-size galaxies and slightly more massive (g422, g3021, g24334, g28547, g41720, g25271) have very similar cumulative luminosity functions to the Tollerud et al. (2008) function for their brightness limit, or are near to the Milky Way’s function. The MUGS curves do not appear to dramatically change shape as they approach the resolution limit, which suggests that the total number of low luminosity satellites is relatively robust.
Of the heavier galaxies that exceed the Milky Way’s mass, g15784 is the only one of these that meets M31’s satellite count and g4145 and g15807 match Equation 5. Our high luminosity satellites are probably more luminous than is realistic, but they are within the resolved range and should still contribute to the total cumulative number.
The importance of having a sample of galaxies in different environments is demonstrated by the variance in luminosity functions across galaxies of similar mass. Overall, in terms of cumulative number, and within the resolution limit, our galaxies do not suffer from the order of magnitude missing satellites problem as is evident from Equation 5. In spite of the differing environments, a trend still holds to predict the number of satellites based purely on the host’s mass. Only the satellites below the Milky Way’s mass have slightly fewer satellites than expected, while every Milky Way-mass and more massive host meet this trend. This might be an effect of small scale statistics for the lower mass hosts and with higher resolution we expect they too should follow the trend closely.
4 The Robustness of Dwarf Satellites over Giant Satellites
Figure 2 shows the cumulative luminosity function for all the satellites of the sixteen MUGS galaxies. It includes a fit to the Press-Schechter function (Press & Schechter, 1974), adjusted to an intercept such that the brightest satellite has a cumulative number of 1. In cumulative form (Schechter, 1976) the function is,
| (6) |
where their is the number of galaxies expected to have a higher luminosity than , is the faint-end slope, is the characteristic luminosity at which the faint end begins, is the richness parameter, and is the incomplete upper gamma function.
Most of our galaxies display an excess of high-luminosity satellites, making the fit to the Press-Schechter function somewhat problematic. We were nevertheless able to obtain a fit that brackets the high-luminosity bend: and . It is already clear from Figure 2 that our dwarf satellites fit the Press-Schecter functional form much better than the giant satellites.
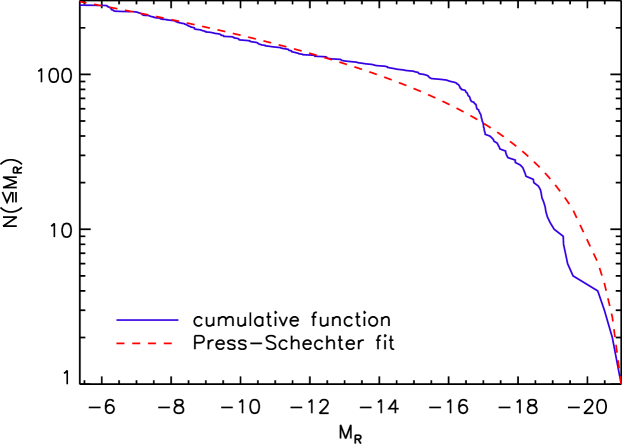
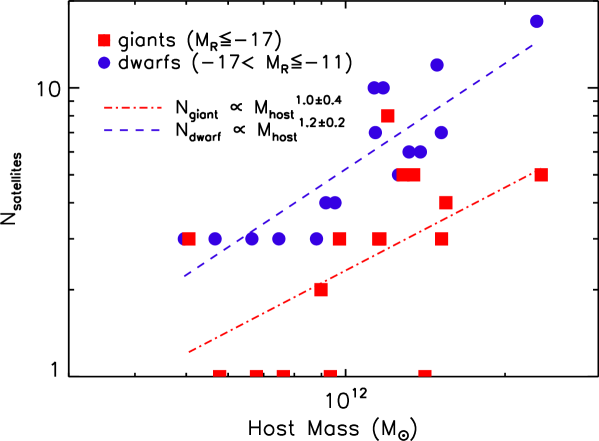
Figure 3 shows the number of luminous satellites versus the mass of the host galaxy. As with Trentham & Tully (2009) we do not consider satellite galaxies fainter than , and we split the dwarfs from the giant satellites at . The power law fits for this relation are shown in Figure 3. We obtain for dwarfs,
| (7) |
and for giants,
| (8) |
Within the errors, our trends for the dwarfs and giants fall within the Trentham-Tully relations given in Equations 1 and 2. We find, just as they do, that the giant satellites have more scatter when fit to a power law than the dwarf satellites.
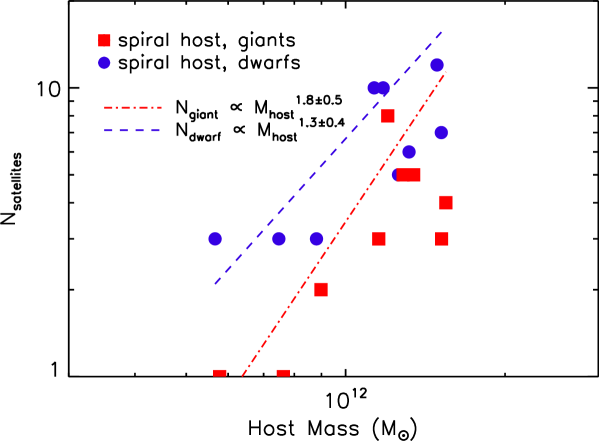
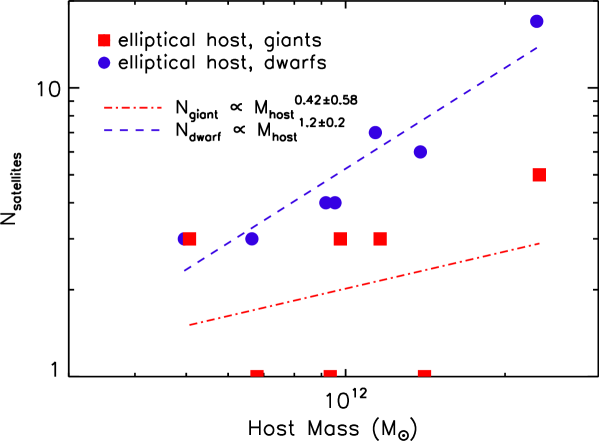
We investigated splitting the hosts by morphology and exploring the difference in the power law between spiral and elliptical hosts in Figures 4 and 5. While the power law for the number of dwarf satellites ( for spirals and for ellipticals) remains nearly the same, the power for the giant satellites changes drastically between the two morphologies ( for spirals and ellipticals). This suggests further that the small-number statistics of giants are more affected by environment, while the number of dwarf satellites is robust against morphology type.
Dwarf satellites are more useful for finding a universal scaling relation for the luminosity function of satellites according to host mass as in Equation 5. These observations verify the trend shown in our simulations, in that the mass of the host predicts the number of dwarf satellites, and hence within resolution our simulation does not suffer from the missing satellites problem. This is an important loadstone for studying luminosity functions and satellite systems outside of the Local Group.
5 Conclusions
We compare the satellite populations in simulations of sixteen high resolution galaxies with observations to see how satellite populations vary as a function of host mass. Our sample of hosts contains a wide range of masses and morphologies and are therefore interesting to compare to the new studies and statistics of satellite galaxies in diverse systems beyond the Local Group. Just as there are observations of diverse galaxies, there needs to be diverse simulations run with the same physics that contain more than Milky Way-like galaxies.
The luminosity functions of our galaxies scale well with observations. It shows that with baryon physics, our simulations no longer suffer from the order of magnitude missing satellites problem. For host galaxies as massive as the Milky Way and more massive, the scaling fits almost exactly. Though our hosts with masses lower than the Milky Way do not quite have as many satellites as predicted, they were still only short by three or four satellites, and probably with higher resolution would suffer less from small number statistics.
Trentham & Tully’s (2009) study concluded that dwarf galaxy populations () correlate to their host halo’s mass, while giants () do not. They explored the space of host masses from to M☉ and found the relation , where mass is given in . We find that that the Trentham-Tully relation describes our simulated satellite systems even when we split our hosts between spirals and ellipticals. The number of dwarf satellites a host has is largely dependent on the host mass and does not change with morphology type, whereas the number of giant satellites might be affected by many factors. There were not enough giants on which to found solid statistics.
When all satellite galaxies from all sixteen MUGS simulations are stacked together, their luminosity function follows a Press-Schechter function with faint-end slope and characteristic luminosity .
Koposov et al. (2008) provided a luminosity function for the Milky Way that takes into account the incomplete sky coverage of large surveys and dwarfs too faint for detection. We use the knowledge of dwarf satellites’ robustness to adjust the Milky Way’s function in order to incorporate dependence on host mass, as in the Trentham-Tully relation for dwarfs: , where mass is given in . The MUGS hosts compare much more favourably to this new, scaled luminosity function than they do to the Milky Way’s or M31’s luminosity functions alone.
Acknowledgements
We thank SHARCNET for providing supercomputer time without which the MUGS galaxies would not have been possible, and NSERC for funding. HMPC thanks the Canadian Institute for Advanced Research for support.
References
- Abazajian et al. (2009) Abazajian K. N. et al., 2009, ApJS, 182, 543
- Abell (1977) Abell G. O., 1977, ApJ, 213, 327
- Balogh et al. (2004) Balogh M. L., Baldry I. K., Nichol R., Miller C., Bower R., Glazebrook K., 2004, ApJ, 615, L101
- Bell et al. (2011) Bell E. F., Slater C. T., Martin N. F., 2011, ApJ, 742, L15
- Belokurov et al. (2007) Belokurov V. et al., 2007, ApJ, 654, 897
- Binggeli et al. (1985) Binggeli B., Sandage A., Tammann G. A., 1985, AJ, 90, 1681
- Bovy et al. (2012) Bovy J. et al., 2012, ArXiv e-prints
- Boylan-Kolchin et al. (2011) Boylan-Kolchin M., Bullock J. S., Kaplinghat M., 2011, ArXiv e-prints
- Brasseur et al. (2011) Brasseur C. M., Martin N. F., Macciò A. V., Rix H. W., Kang X., 2011, ArXiv e-prints
- Chiboucas et al. (2009) Chiboucas K., Karachentsev I. D., Tully R. B., 2009, AJ, 137, 3009
- Chiboucas et al. (2011) Chiboucas K. et al., 2011, ApJ, 737, 86
- Christlein (2000) Christlein D., 2000, ApJ, 545, 145
- Ferguson & Sandage (1988) Ferguson H. C., Sandage A., 1988, AJ, 96, 1520
- Ferland et al. (1998) Ferland G. J., Korista K. T., Verner D. A., Ferguson J. W., Kingdon J. B., Verner E. M., 1998, PASP, 110, 761
- Foreman-Mackey (2010) Foreman-Mackey D. T., 2010, Ph.D. thesis, Queen’s University (Canada
- Governato et al. (2007) Governato F., Willman B., Mayer L., Brooks A., Stinson G., Valenzuela O., Wadsley J., Quinn T., 2007, MNRAS, 374, 1479
- Haardt & Madau (1996) Haardt F., Madau P., 1996, ApJ, 461, 20
- Holmberg (1950) Holmberg E., 1950, Meddelanden fran Lunds Astronomiska Observatorium Serie II, 128, 1
- Jones & Jones (1980) Jones J. E., Jones B. J. T., 1980, MNRAS, 191, 685
- Kennicutt (1998) Kennicutt Jr. R. C., 1998, ApJ, 498, 541
- Klypin et al. (1999) Klypin A., Kravtsov A. V., Valenzuela O., Prada F., 1999, ApJ, 522, 82
- Klypin et al. (2002) Klypin A., Zhao H., Somerville R. S., 2002, ApJ, 573, 597
- Knollmann & Knebe (2009) Knollmann S. R., Knebe A., 2009, ApJS, 182, 608
- Koposov et al. (2008) Koposov S. et al., 2008, ApJ, 686, 279
- Koposov et al. (2009) Koposov S. E., Yoo J., Rix H., Weinberg D. H., Macciò A. V., Escudé J. M., 2009, ApJ, 696, 2179
- Kroupa et al. (1993) Kroupa P., Tout C. A., Gilmore G., 1993, MNRAS, 262, 545
- Lares et al. (2011) Lares M., Lambas D. G., Domínguez M. J., 2011, AJ, 142, 13
- Leitherer et al. (1999) Leitherer C. et al., 1999, ApJS, 123, 3
- Macciò et al. (2009) Macciò A. V., Kang X., Moore B., 2009, ApJ, 692, L109
- Mahdavi et al. (2005) Mahdavi A., Trentham N., Tully R. B., 2005, AJ, 130, 1502
- Marigo et al. (2008) Marigo P., Girardi L., Bressan A., Groenewegen M. A. T., Silva L., Granato G. L., 2008, A&A, 482, 883
- Martin et al. (2009) Martin N. F. et al., 2009, ApJ, 705, 758
- Marzke & da Costa (1997) Marzke R. O., da Costa L. N., 1997, AJ, 113, 185
- Mateo (1998) Mateo M. L., 1998, ARAA, 36, 435
- McConnachie et al. (2008) McConnachie A. W. et al., 2008, ApJ, 688, 1009
- Moore et al. (1999) Moore B., Ghigna S., Governato F., Lake G., Quinn T., Stadel J., Tozzi P., 1999, ApJ, 524, L19
- Nichol et al. (2003) Nichol R. C., Miller C. J., Goto T., 2003, Ap&SS, 285, 157
- Nickerson et al. (2011) Nickerson S., Stinson G., Couchman H. M. P., Bailin J., Wadsley J., 2011, MNRAS, 415, 257
- Okamoto et al. (2009) Okamoto T., Frenk C. S., Jenkins A., Theuns T., 2009, ArXiv e-prints
- Press & Schechter (1974) Press W. H., Schechter P., 1974, ApJ, 187, 425
- Richardson et al. (2011) Richardson J. C. et al., 2011, ApJ, 732, 76
- Sandage et al. (1985) Sandage A., Binggeli B., Tammann G. A., 1985, AJ, 90, 1759
- Schechter (1976) Schechter P., 1976, ApJ, 203, 297
- Shen et al. (2010) Shen S., Wadsley J., Stinson G., 2010, MNRAS, 1043
- Slater et al. (2011) Slater C. T., Bell E. F., Martin N. F., 2011, ApJ, 742, L14
- Smith Castelli et al. (2011) Smith Castelli A. V., Cellone S. A., Faifer F. R., Bassino L. P., Richtler T., Romero G. A., Calderon J. P., Caso J. P., 2011, ArXiv e-prints
- Spergel et al. (2007) Spergel D. N. et al., 2007, ApJS, 170, 377
- Stinson et al. (2006) Stinson G., Seth A., Katz N., Wadsley J., Governato F., Quinn T., 2006, MNRAS, 373, 1074
- Stinson et al. (2010) Stinson G., Bailin J., Couchman H., Wadsley J., Shen S., Brook C., Quinn T., 2010, ArXiv e-prints
- Strigari & Wechsler (2011) Strigari L. E., Wechsler R. H., 2011, ArXiv e-prints
- Tollerud et al. (2008) Tollerud E. J., Bullock J. S., Strigari L. E., Willman B., 2008, ApJ, 688, 277
- Tollerud et al. (2011) Tollerud E. J., Boylan-Kolchin M., Barton E. J., Bullock J. S., Trinh C. Q., 2011, ApJ, 738, 102
- Trentham & Tully (2009) Trentham N., Tully R. B., 2009, MNRAS, 398, 722
- Trentham et al. (2001) Trentham N., Tully R. B., Verheijen M. A. W., 2001, MNRAS, 325, 385
- Trentham et al. (2006) Trentham N., Tully R. B., Mahdavi A., 2006, MNRAS, 369, 1375
- Tully & Trentham (2008) Tully R. B., Trentham N., 2008, AJ, 135, 1488
- Wadepuhl & Springel (2010) Wadepuhl M., Springel V., 2010, ArXiv e-prints
- Wadsley et al. (2004) Wadsley J. W., Stadel J., Quinn T., 2004, New Astronomy, 9, 137
- Willman et al. (2005) Willman B. et al., 2005, ApJ, 626, L85