Excitations of amorphous solid helium
Abstract
We present neutron scattering measurements of the dynamic structure factor, , of amorphous solid helium confined in 47 Å pore diameter MCM-41 at pressure 48.6 bar. At low temperature, = 0.05 K, we observe of the confined quantum amorphous solid plus the bulk polycrystalline solid between the MCM-41 powder grains. No liquid-like phonon-roton modes, other sharply defined modes at low energy ( 1.0 meV) or modes unique to a quantum amorphous solid that might suggest superflow are observed. Rather the of confined amorphous and bulk polycrystalline solid appear to be very similar. At higher temperature ( 1 K), the amorphous solid in the MCM-41 pores melts to a liquid which has a broad peaked near 0 characteristic of normal liquid 4He under pressure. Expressions for the of amorphous and polycrystalline solid helium are presented and compared. In previous measurements of liquid 4He confined in MCM-41 at lower pressure the intensity in the liquid roton mode decreases with increasing pressure until the roton vanishes at the solidification pressure (38 bars), consistent with no roton in the solid observed here.
pacs:
61.05.F-, 67.80.bd, 67.80.dc, 67.25.drI Introduction
The superfluid fraction of liquid 4He, both bulk and 4He in porous media, is traditionally and most accurately measured in a torsional oscillator (TO). Below a critical temperture , the TO frequency increases indicating that a fraction of the helium mass has decoupled and ceased to rotate with the TO. The effect is denoted a nonclassical rotational inertia (NCRI) and the decoupled fraction is identified as the superfluid fraction.
In 2004, Kim and ChanKim and Chan (2004a, b) reported a similarly NCRI in solid 4He, in both bulk solidKim and Chan (2004a) and in solid 4He confined in Vycor.Kim and Chan (2004b) Remarkably, below a 200 mK, a small fraction of the solid apparently decouples in a TO. The NCRI has now been widely reproduced in other laboratories in a variety of sample cells.Rittner and Reppy (2006); Kim and Chan (2006); Rittner and Reppy (2007); Kondo et al. (2007); Aoki et al. (2007); Gumann et al. (2011); Fefferman et al. (2012) However, the magnitude of the NCRI observed varies between zero and 1.5 %, depending on how the sample is prepared, quenched or annealed, on the 3He concentration and on other factors. This suggests that the NCRI is associated with defects in the solid, dislocations, grain boundaries, amorphous regions or other defects.Prokof’ev (2007); Balibar and Caupin (2008); West et al. (2009); S. Balibar (2010) The magnitude and character of the NCRI depends on the oscillator frequencyAoki et al. (2007); Gumann et al. (2011); Xiao Mi and John D. Reppy (2012) and shows effectsHunt et al. (2009); Pratt et al. (2011) not usually associated with superflow. For example, the NCRI is associated with substantial elastic energy dissipation in the solid described by the Q of the oscillator. Indeed in some cases, the observed frequency shift, f, and the disipation, Q, can be quite well described by the real and imaginary parts of a common dynamic susceptibility as found in purely glassy systemsHunt et al. (2009); Pratt et al. (2011).
Day and BeamishJ. Day and J. Beamish (2007); Day et al. (2009) and othersRojas et al. (2010) have shown that the shear modulus, , of solid helium increases at low temperature with both a temperature dependence and a dependence on 3He concentration that tracks that of the observed NCRI. The increase in is attributed to the stiffening of the solid as dislocations become pinned by 3He at low temperature. A key question is whether the f can be entirely attributed to elastic behavior or whether there is some remaining part that must arise from other effects such as superflow.
Pursuing this question, MarisMaris (2012)and Beamish and coworkersBeamish et al. (2012) have shown that in some TOs there is sufficient solid helium in the torsional rod to explain the observed f completely in terms of elastic stiffening of the solid in the rod. However, in many others it cannotBeamish et al. (2012) and at least part of the observed f must have some other origin. Similarly, Choi and coworkersChoi et al. (2010, 2012) using a TO which includes DC rotation have shown that the critical velocity depends on the DC velocity as expected for genuine superflow. Thus, while the stiffening of the shear modulus below and elastic effects can account for the f and Q in some cases, it cannot account for f in all casesKim and Chan (2004a, b); Rittner and Reppy (2008); Choi et al. (2010); Fefferman et al. (2012) nor all effects.Kim et al. (2011); Choi et al. (2010, 2012)
Path Integral Monte Carlo calculations predict that the superfluid fraction and Bose- Einstein condensate fraction in perfect crystalline solid helium are negligibly small.Ceperley and Bernu (2004); Boninsegni et al. (2006); Clark and Ceperley (2006) However, a finite and observable superfluid fraction and condensate fraction is predictedBoninsegni et al. (2006) in amorphous solid helium. The first one to two layers of helium on rough porous media walls are amorphous. Typically, the solid in porous media grows from the amorphous layers inward toward the center of the pores.Rossi et al. (2005) In Vycor and aerogel the tightly bound amorphous layers give way to crystalline solid after a few layers so that the solid in the interior of the pore is crystalline. However, if the pore size is small enough, the solid is amorphous throughout the pore, as predicted for classical solids.Coasne et al. (2006) Specifically, in 47 Å pore diameter MCM-41 and 34 Å pore diameter gelsil, we have shownBossy et al. (2010) that the entire solid is amorphous (no Bragg peaks). Since superflow in amorphous solid 4He is predicted, it is interesting to determine whether the amorphous solid has any low lying modes similar to the phonon-roton mode of liquid 4He, that might suggest Bose-Einstein condensation (BEC) and superflow, or whether it has vibrational modes similar to those of a typical polycrystalline solid as observed in classical amorphous solids.Suzuki (1987); Jens-Boie Suck, Hermann Rudin, Hans Bretscher, Peter Gr tter, and Hans-Joachim G ntherodt (1988); Mentese et al. (2002) This is particularly interesting since a low energy mode in solid helium in aerogel has recently been reported and identified as the origin of local superfluidity.Lauter et al. (2011) In this context we present measurements of the dynamical structure factor (DSF) of amorphous solid helium.
II Experiment
The experiment was performed at the Institut Laue-Langevin on the time of flight spectrometer IN5. We used an incident neutron wavelength of 5 Å, which provided a spectrometer energy resolution of 85 eV.
The sample cell was a cylindrical aluminum container with an inner diameter of 15 mm and a height of 55 mm. The MCM-41 powder sample occupied a volume of 7 cm3 corresponding to a height of 40 mm in the cell. The upper part of the cell containing bulk He was masked with cadmium. The cell was mounted in a dilution refrigerator built at the ILL that has a base temperature of 40 mK. The cell has been filled at T=3.8 K and 80 bar, and the solid sample between the grains of the MCM-41 was formed by the blocked capillary method.
In the present 47 Å pore diameter MCM-41 powder sample, the ratio of the volume in the pores, , to that between the grains, , is Bossy et al. (2010) . Thus approximately 30 % of the helium in the beam is in the pores, 70 % between the grains. In a 47 Å pore approximately 30% of the volume in the pore is occupied by the tightly bound amorphous solid layers on the media walls. Thus, in the present MCM-41 sample at 1.6 K when there is liquid in the pores, approximately 80% of the helium in the cell is solid (between the grains and on the pore walls) and only 20% is liquid (in the pores). For this reason, the difference in the scattering intensity arising from the solidification of the liquid to an amorphous solid between 1.6 K and 0.05 K is expected to be small, as observed in Figs. 2 and 3 below.
III Results
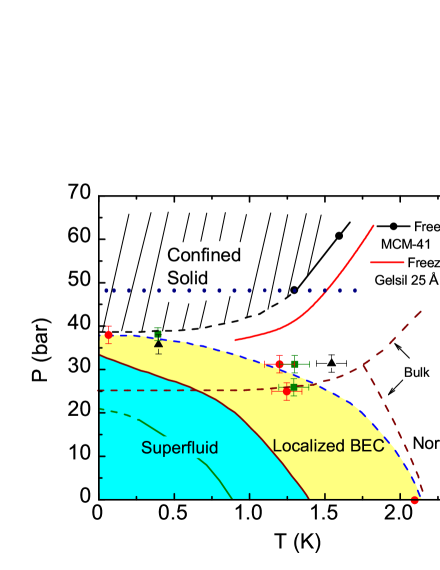
To set the stage, we show the phase diagram of 4He confined in 47 Å pore diameter MCM-41 Bossy et al. (2008a, 2010) and in 25 Å mean pore diameter gelsil Yamamoto et al. (2004, 2008); Shirahama et al. (2008) in Fig. 1. At low temperature and pressure, liquid 4He in 25 Å gelsil (and in 28 Å FSM ) is a superfluid, as shown by Yamamoto et al. Yamamoto et al. (2004) and Taniguchi et al. Taniguchi et al. (2010), respectively. In the superfluid phase, the associated Bose-Einstein condensation (BEC) is expected to be connected and continuous across the sample providing a continuous phase that enables macroscopic superflow. At higher temperature above the superfluid phase in porous media the liquid forms a localized BEC (LBEC) region in which the BEC is localized to islands. In the LBEC region the BEC is isolated in patches, is not extended, and there is no macroscopic superflow across the sample Glyde et al. (2000); Plantevin et al. (2002). The LBEC region lies between the superfluid and normal liquid phases as shown in Fig 1. In 47 Å MCM-41 and 25 Å gelsil helium solidifies at pressures, bars. The liquid-solid boundary in MCM-41 has been determined by cooling the liquid and observing a small reproducible increase in the peak height of the static structure factor S(Q) on solidification. Bossy et al. (2010) In 25 Å gelsil it has been determined from pressure drop on solidification.Shirahama et al. (2008) No Bragg peaks were observed in the confined solidBossy et al. (2010) showing that the solid is amorphous with no crystalline regions. In larger pore diameter media, for example in 70 Å gelsil,Wallacher et al. (2005) and aerogel,Mulders et al. (2008) polycrystalline solid 4He regions are observed.
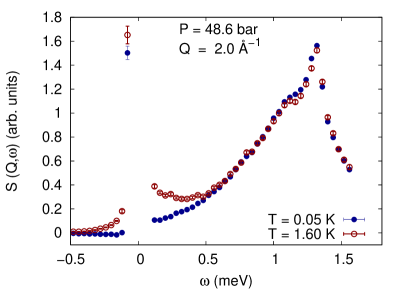
Fig. 2 shows the net DSF of helium in the present sample cell containing MCM-41 at pressure = 48.6 bar. at = 2.0 Å-1 and temperatures = 0.05 K and = 1.6 K is shown. At = 0.05 K we expect amorphous solid helium in the MCM-41 pores and polycrystalline solid between the grains of the MCM-41 powder. The inelastic scattering ( 0) at = 0.05 K is a sum of from the amorphous solid (30 % of the helium sample in the beam) and polycrystalline solid (70 % of the helium in the beam). At low the intensity in grows smoothly with as expected for scattering from a polycrystal or an amorphous solid in which the density of states g() is approximately proportional to at low . There is no indication of any low energy roton modes or any layer modes as seen in liquid helium in porous media. The roton and layer modes of the liquid in MCM-41 are observedPearce et al. (2004); Bossy et al. (2008a, b, 2012) at energies 0.5 - 0.6 meV and 0.4 - 0.5 meV at 34 bar, respectively. The DSF in Fig. 2 peaks at meV. This is consistent with the peak in the density of states (DOS) of phonons in bulk polycrystalline helium between the grains observed previously.Bossy et al. (2008a, b, 2012) The large peak at is elastic scattering, , from the amorphous solid in the pores. The elastic scattering from the polycrystalline solid is confined to Bragg peaks and the Q in Fig. 2 has been selected to avoid these Bragg peaks.
In Fig. 2 at = 1.6 K there is new response at low in not seen at = 0.05 K. Also at = 1.6 K the intensity in at higher ( 1 meV) is marginally smaller. At = 2.0 Å-1, energy transfers 1.5 meV are not observable on IN5 at the present incident neutron energy used. From the phase diagram Fig. 1, we see that the helium in the interior of the MCM-41 pores is liquid at p = 48.6 bar and = 1.6 K. The helium in the one-two helium layers tightly bound to the MCM-41 walls remains amorphous solid at = 1.6 K and higher temperatures. Approximately 30 % of the helium in the 47 Å MCM-41 pores is in the tightly bound layers adjacent to the pore walls which remains solid at = 1.6 K. Thus approximately 20% of the total helium sample in the beam melts to liquid between = 0.05 K and 1.6 K.
The intensity in at low at = 1.6 K is attributed to the normal liquid 4He in the interior of the pores. This is similar to that of bulk normal liquid 4He at 20 barsTalbot et al. (1988); Gibbs et al. (1999) and of confined normal 4He in MCM-41 at 34 barsBossy et al. (2012) as we discuss further below. That is, is concentrated near = 0 with a tail extending out to higher , as in normal liquids.Sköld et al. (1972); Buyers et al. (1975) Particularly, there are no sharp modes in at either 0.05 K or 1.6 K characteristic of a Bose-condensed liquid.Bossy et al. (2012)
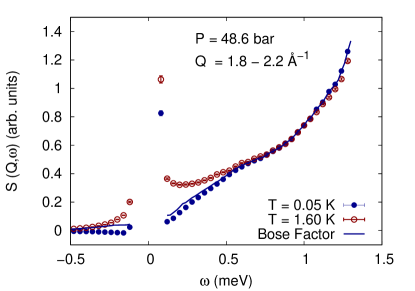
Fig. 3 shows obtained by integrating over a range of Q values,
| (1) |
between = 1.8 Å-1 and = 2.2 Å-1. The purpose of the integration is chiefly to improve the statistical precision of the data especially at low . As in Fig. 2, the additional intensity at low at = 1.6 K is attributed to normal liquid 4He in the interior of the pores. The blue line in Fig. 3 shows of solid helium observed at T=0.05 K (bulk polycrystalline helium between the grains and amorphous solid helium in the pores) multiplied by the Bose factor [ + 1] where is the Bose function for = 1.6 K (0.15 meV). The blue line represents the change in of the solid expected when is increased from 0.05 K to 1.6 K if the energies and lifetimes of the modes of the solid remain unchanged. Clearly, thermal effects make only a minor contribution to the observed change in between = 0.05 K and = 1.6 K, even at low for 0. Thus it is reasonable to attribute the observed large change in at low to melting of the amorphous solid in the interior of the pores to a liquid. As in Fig. 2, no sharp or well defined modes are observed in the integrated .
In Fig. 3, the intensity in the energy range meV is very similar at T = 0.05 K and at T = 1.6 K. It is marginally smaller at 1.6 K than at 0.05 K but has a similar energy dependence. Thus the in this energy range arising from the amorphous solid ( = 0.05 K) and the liquid ( = 1.6 K) in the interior of the pores appear similar but with marginally larger intensity from the amorphous solid.
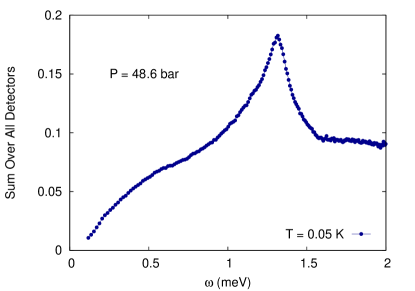
Fig. 4 shows the data arising from the amophous solid in the pores and the polyscrystalline solid between the grains at T = 0.05 K summed over all detectors. The goal is to show that there are no sharply defined modes at 1 meV at accessible values. Rather increases uniformly with as expected for scattering from phonons in a polycrystalline solid. The peak in the data summed over all detectors at 1.3 meV is broader than the peak in at =2.0 Å-1shown in Fig. 1. The peak at 1.3 meV is expected to arise chiefly from the polycrystalline solid helium between the grains. Solid helium is a highly anharmonic solid so that there will be substantial anharmonic broadening in the observed and . In the Discussion we compare and of anharmonic polycrystalline and amorphous solids and provide explicit expressions for the observed from each.
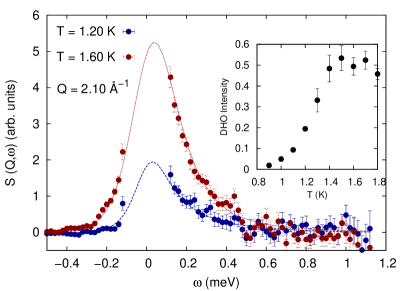
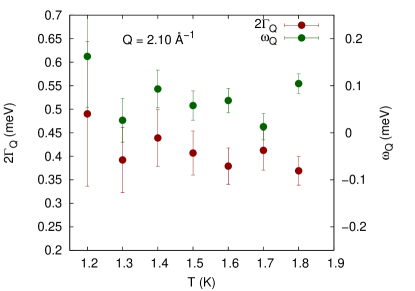
Fig. 5 shows the difference between with normal liquid 4He in the pores (at = 1.2 K and 1.6 K) and amorphous solid in the pores at = 0.05 K, the latter multiplied by the thermal Bose factor for each temperature as discussed in Fig. 5. This difference is interpreted as the net scattering from the normal liquid at low . At higher , ( 0.8 meV) the of the liquid and amorphous solid could be quite similar and the net is not well determined. The net liquid is a smooth function of as expected for normal 4He. The also peaks near = 0 as observed in classical liquidsBuyers et al. (1975); Sköld et al. (1972). In contrast, the of normal liquid 4He at SVP ( 0) peaks at 0.5 meV. Thus normal 4He at higher presssure responds much like a classical liquid. The lines in Fig. 5 are fits of a damped harmonic oscillator (DHO) function,
| (2) |
to the data with energy, , width, , and intensity, , treated as free fitting parameters. The origin of the DHO is discussed in the appendices of Refs.Talbot et al., 1988 and Glyde, 1994 and the DHO is a standard fitting function in the literature.Gibbs et al. (1999) We found good fits to the data for energies and widths in the DHO function that were independent of temperature within precision (see Fig. 6). Only the weight or intensity in the DHO increased with increasing temperature between 0.8 K and 1.4 K. The weight (strictly the product which fluctuates less than alone since is nearly zero) is shown in the inset of Fig. 5. The increase in intensity with temperature was attributed to the increase in volume of liquid with temperature as the solid melts. The intensity in the liquid reaches a maximum at = 1.4 K which is interpreted as the temperature when melting of the amorphous solid in the pores is complete. At lower pressureBossy et al. (2012) we also found the energy and width of the normal liquid was independent of temperature over the temperature range investigated (1.2 K). No physical meaning is attributed to the energy or width in terms of modes. The DHO is only a convenient representation of .

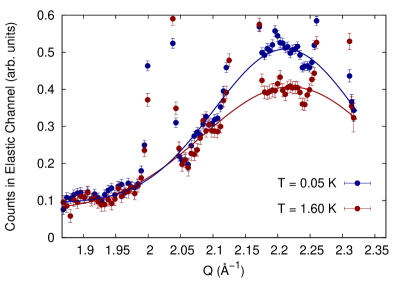
Fig. 7 shows the net elastic scattering from the helium in the sample cell at = 0.05 K and 1.6 K. The top frame of Fig. 7 shows at = 2.2 Å-1with the elastic peak at = 0. The elastic peak in the top frame arises chiefly from the amorphous solid helium in the pores or on the grain surfaces. The elastic scattering from the polycrystalline solid between the grains is confined chiefly to Bragg peaks which are not seen at = 2.2 Å-1. At = 0.05 K the pores are full of amorphous solid. At 1.6 K there is amorphous helium in the first 1-2 layers on the pore walls only, approximately 30 % of the 4He in the pores. The elastic peak is clearly larger at 0.05 K indicating more amorphous solid than at 1.6 K. However, the peak is only approximately 20 % larger rather than a factor of 2-3 as might be expected if only amorphous solid contributes to the peak.
The bottom frame of Fig. 7 shows the elastic scattering at = 0 as a function of . In this case Bragg peaks arising from the polycrystalline solid lying between the grains are observed at = 2.02 Å-1and = 2.28 Å-1. The blue and red lines in Fig. 7 are guides to the eye through elastic scattering arising from the amorphous solid at = 0.05 K and 1.6 K, respectively. Again, the intensity from the amorphous solid is greater at 0.05 K when the pores are filled with amorphous solid than at 1.6 K when there is amorphous solid in 1-2 layers on the pore walls only. The difference in intensity is comparable to that shown in the top frame of Fig. 7.
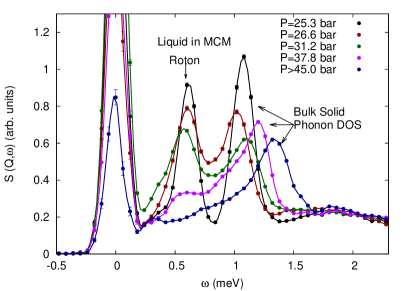
Finally, in Fig. 8 we reproduce from Ref. Bossy et al., 2012 measurements of at lower pressure where there is liquid 4He in the MCM-41 pores at low temperature, = 0.4 K. In Fig. 8 we observe elastic scattering from the amorphous solid layers in the pores at = 0, as in the top half of Fig. 7 at = 48.6 bar. The peak at = 0.6 meV is the roton mode of the Bose condensed liquid at = 2.1 Å-1. The intensity in the roton mode clearly decreases with increasing pressure until there is only a very weak mode observed at = 37.8 bar which is immediately below the solidification pressure. No roton mode is observed at 45 bar. The decrease in intensity of the phonon-roton modes in the liquid with increasing pressure and disappearance of the mode at the solidification pressure 38 bar is consistent with no low-energy, liquid-like mode observed here in the amorphous solid at 48.6 bar. The broad peak at higher energy = 1.0 - 1.3 meV in Fig. 8 is scattering from the phonons of the polycrystalline solid lying between the grains. The energy of the peak arising from the phonons increases with increasing pressure as expected for phonons. The broad peak at 1.2 meV at = 37.8 bar shown in Fig. 8 is similar in shape to the peak in at 1.3 meV observed here at 48.6 bar, as seen in Figs. 1 and 4. In each case this peak is interpreted as arising chiefly from the phonons in the hcp polycrystalline solid between the grains.
IV Discussion
IV.1 Melting in confinement
Taniguichi and SusukiTaniguchi and Suzuki (2011) have recently reported measurements of freezing and melting of helium in a 28 Å pore diameter FSM which is quite similar to the present MCM-41. They observe melting continuously over a wide temperature range, quite different from melting of bulk helium, but freezing over a narrower temperature range. In Fig. 5 above we presented the DSF, , of normal liquid 4He in the present MCM-41. Particularly, on warming, intensity in the liquid is first observed at T= 0.9 K, the intensity grows continuously until 1.5 K and saturates to a constant value at 1.5 K (see inset of Fig. 5). We interpret this as onset of melting at 0.9 K and melting complete at 1.5 K. This increase in intensity of the liquid over a wide temperature range is consistent with the continuous melting over a wide temperature range observed by Taniguchi and Susuki. They also observe a very small volume change on freezing, two orders of magnitude below the bulk value. This suggests that the molar volumes of the amorphous solid and liquid in FSM, and probably in the present MCM-41, are nearly identical.
IV.2 Modes in confined liquid 4He
In earlier measurementsPearce et al. (2004); Bossy et al. (2008a, b, 2012) we have observed the DSF, , of liquid 4He in the present MCM-41 and in 25 Å diameter gelsil as a function of pressure and temperature. Both phonon-roton and layer modes are observed at low temperature. The intensity in the roton decreases with increasing pressure, as noted above, and with increasing temperature. At = 34 bar, for example, the intensity in the roton disappears at = 1.5 K and a roton is no longer observed above this temperature. The solid circles, squares and triangles in Fig. 1 show the maximum temperatures and pressures at which P-R modes are observed. At temperatures and pressures above the dashed black line through the data points in Fig. 1, well-defined P-R modes are no longer observed. Since well defined P-R modes exist when there is Bose-Einstein condensation, the dashed black line is associated with the temperature at which BEC disappears in liquid 4He confined in these porous media. In 25 Å gelsil lies above for superflow as observed in a torsional oscillator.Yamamoto et al. (2004) For this reason, the temperature region is identified as a region of localized BEC with no superflow across the sample as discussed at the beginning of section III.
Equally interesting, the roton energy decreases with increasing pressure, decreasing from = 0.74 meV at SVP to approximately = 0.55 meV at 37.8 barPearce et al. (2004); Bossy et al. (2008b). The energy of a single P-R mode cannot exceed twice the roton energyPitaevskii (1959); Glyde et al. (1998), 2. If the single P-R mode energy exceeeds 2, it has sufficient energy to spontaneously decay to two rotons and the mode will be broadened and not observable as well-defined mode. Thus at higher pressure a well-defined liquid P-R mode exists at low energy only, at wave vectors in the phonon region and in the roton region only. For example, at 38 bar (at solid pressures) a well-defined P-R mode exists in the liquid at energies 1.1 meV only, i.e. at wave vectors in the phonon region 0.6 meV and in the roton region 1.7 2.4 Å-1only. Thus, even if there were trapped liquid in a solid at higher pressure, we would not observe a complete liquid P-R mode.
In summary, our previous finding that the intensity in the liquid roton mode decreases with increasing pressure and goes to zero at 38 bar is consistent with the absence of a mode at roton energies in the amorphous solid in the present measurements.
IV.3 Amorphous Solid Helium
In this section we compare expressions for the dynamic structure factor (DSF), , of an anharmonic polycrystalline and an anharmonic amorphous solid. The goal is to show that we expect the of solid helium in these two structures to be very similar when is integrated over a range of values as in Eq. (1) . The integrated may be somewhat more sharply peaked as a function of in a polycrystalline solid because of the coupling between the scattering wave vector and the wave vector, , of the phonons in the polycrystalline solid. This coupling limits the number of phonons that can contribute to in a polycrystal. However, because of (1) anharmonic effects which broadening the phonons substantially, (2) the large vibrational displacements of the atoms which make multimode contributions to large, and (3) because we are considering polycrystals rather than single crystals, we expect the difference to be small. To illustrate, we write out the single mode excitation term, , of for polycrystalline and amorphous solids below. Higher order terms are discussed in an Appendix.
The total is the sum of an elastic scattering term, , and a series of inelastic terms representing excitation of single modes, two modes, interference between those modes via anharmonic terms, and higher order mode processes,
| (3) |
In a crystal of N atoms where there is periodic translational symmetry, we express the vibrational displacements of the atoms from their lattice points as a superposition of waves (phonons) in the crystal of well defined wave vector and polarization index . With this expression, the product that appears in the DSF (see Eqs. (22) and (26) in the appendix) is, for one atom per unit cell,
| (4) |
In Eq. (4) where is the frequency and is the polarization vector of the wave and is the atomic mass. is the mode annihilation operator for the phonon to and to 3).
In randomly oriented polycrystals of solid helium, we assume that, averaged over the polycrystals,
| (5) |
We restrict ourselves here to positive and low temperature so that the number of the thermally excited phonons is small. In this case, using the substitution (4) and the average (5), the one-phonon component of is
| (6) |
in which is the one-phonon weight factor, , is the Debye-Waller factor and is the one-phonon response function. In an anharmonic crystal such as solid helium, has the formCowley (1968); Glyde (1994),
| (7) |
where = is the half width of the phonon group and = is a shift in the initial frequency arising from anharmonic effects. In solid helium, the are typically some positive anharmonic frequencies such as self-consistent harmonic frequencies. The is large so that is a broad function of , especially for phonons near the Brillouin zone edgesMinkkiewcz et al. (1973); Markovich et al. (2002). In a harmonic limit in which , the reduces to
| (8) |
For positive energies, , only the first term in in Eq. (8) contributes to .
At =48.6 bar the one-phonon weight factor has a broad peak at . Thus for polycrystalline solid helium, we expect to be largest at values where has its maximum and at energies where is small.
The phonon density of states (DOS) of a harmonic crystal is defined as
| (9) |
where the sum is over one complete Brillouin zone. The in Eq. (7) is proportional to a modified DOS
| (10) | ||||
| (11) |
which is the usual DOS weighted by . The is the modified DOS that is always observed in neutron scattering measurementsS. W. Lovesey (1984). Eq. (10) is the general anharmonic DOS that will be observed in of solid helium. The second expression, Eq. (11), for holds only in a harmonic approximation. Finally, if we integrate over a range of values as in Eq. (1), we obtain
| (12) | ||||
| (13) |
where we have used and is the volume of the unit cell. In Eqs. (6) and (13), there is a coupling between and the phonon wave vector which means that certain values of only will contribute to . A full DOS is not observed. In solid helium is a broad function in , so that only an anharmonic DOS given by Eq. (10), substantially broadened by anharmonic terms, is observed. In Fig. 4 we show an that is integrated over a limited range of only. Thus we expect the corresponding to be more sharply localized in (representing selected phonons) than the full modified DOS given by (10).
In an amorphous solid, the mean positions do not have periodic symmetry. We treat the amorphous solid as a large molecule or as a solid that has a single large unit cell with all atoms in the unit cellCarpenter and Price (1985). We express as a superposition of the normal modes of the molecule (numerated by , to ) so that Eq. (4) becomes,
| (14) |
In this case the polarization vectors have an index . We assume that averaged over the atoms in the amorphous solid the polarization vector fulfil,
| (15) |
With this assumption, and restricting ourselves to positive and low temperatures as before, for an amorphous solid reduces to,
| (16) |
where is a static structure factor defined in terms of the mean positions of the atoms, is the one mode intensity as before, is the one mode response function of the form (7) and
| (17) | ||||
| (18) |
is a modified DOS for the amorphous solid. In a HA, reduces to a function and Eq. (18) becomes exact. The corresponding intergrated over a range of values is
| (19) | ||||
| (20) |
There are two important differences between for a polycrystal, Eq. (13), and for an amorphous solid, Eq. (20). In the amorphous solid we observe the modified DOS directly in unaffected by selection of particular modes via a delta function. Also, in the amorphous solid contains an additional factor of , which as , peaks at , in solid 4He at = 48.6 bar. Thus, we expect in the amorphous solid to be somewhat more sharply peaked in (at ) than in the polycrystal. If and are similar, we expect the for a polycrystal to be somewhat more sharply peaked in because of the delta function selection of values in the polycrystalline case. However, given that is itself a broad function of , we expect the difference to be small.
In addition to the single mode there are higher mode terms , in (3) which are not negligible in solid helium. The , which is discussed in the appendix, is proportional to and has a broad maximum at somewhat higher values than . It peaks in at higher than . The chief effect of the higher order terms is to further broaden and to extend to higher .
Also, quite generally, at higher we expect the to be independent of phase (liquid or solid) and to become quite similar in polycrystalline, amorphous and liquid helium. Ultimately the response at high arises from high energy interaction between pairs of atoms via the hard core of the interatomic partial which will be independent of structure and similar in all three phases. This high energy region begins at energies greater than the collective mode (e.g. phonon) energies. Thus we expect of amorphous and crystalline 4He to be similar at high as well as at lower from the arguments above.
V Conclusion
The dynamical response of amorphous solid helium confined in MCM-41 at 48.6 bar as observed in the dynamical structure factor, , is a smooth function of energy () characteristic of a solid that has a vibrational density of states approximately proportional to 2 at low . No sharp excitation at low similar to the phonon-roton mode in Bose-condensed liquid helium is observed. The of amorphous and bulk polycrystalline solid helium are similar and broad at values around 2 Å-1, as anticipated for a highly anharmonic solid. Above = 1 K, the amorphous solid melts to normal liquid 4He. The at 2 Å-1 of the normal liquid at 48.6 bar is a broad function that peaks near 0 as in classical liquids, rather than a broad function peaking at a finite (e.g. = 0.5 meV) as in (more quantum) normal liquid 4He at 0.
VI Acknowledgement
It is a pleasure to acknowledge the support of the Institut Laue Langevin and O. Losserand and X. Tonon at ILL for valuable assistance with the experiments. This work was supported by the DOE, Office of Basic Energy Sciences under contract No. ER46680.
VII Appendix
In this appendix, we present some background on the dynamic structure factor, , to support the expressions given in section IV B. We begin with the coherent, intermediate scattering function,
| (21) | ||||
| (22) |
in which where is the mean position of atom (lattice vector in a crystal) and is the displacement of the atom from at time . is the wave vector transfer in the scattering and is the Debye-Waller factor, in a cubic crystal. We consider one atom per unit cell and cubic symmetry for simplicity. Eq. (22) omits the anharmonic interference terms. The corresponding DSF is
| (23) |
To generate the series Eq. (3), we expand the second exponential in Eq. (22) in a power series in in the usual wayS. W. Lovesey (1984); Glyde (1994). The zero order term is the elastic term. For a crystal in which the has periodic order, the corresponding elastic DSF is
| (24) |
The intensity in is confined to Bragg peaks at the reciprocal lattice vectors . In the present measurements involving bulk polycrystalline solid lying between the grains of the MCM-41, we generally chose wave vectors to avoid the Bragg peaks. In this way, elastic scattering from the polycrystallic solid is not observed. Above 1K this is not always easy since above 1K the polycrystals are continually re-crystallizingBurns et al. (2008); Bossy et al. (2010) and a Bragg peak may appear during a measurement.
For an amorphous solid, where the mean positions of the atoms do not have periodic order,
| (25) |
where is a static structure factor defined by the mean positions, of the atoms. The elastic is not the same as the static structure factor . We have found that the of the amorphous solid is somewhat more sharply peaked in the peak region than that of the liquid but otherwise the of the liquid and amorphous solid are very similar.Bossy et al. (2010)
The inelastic scattering in which the neutron creates or annihilates a single mode arises from the term proportional to in the expansion of Eq. (22). The corresponding intermediate DSF is,
| (26) |
For a crystal, we expand in Eq. (26) in terms of phonon modes as in Eq. (4). The single mode term of for a crystal is then,
| (27) |
where is the one phonon response function given by Eq. (7) in general and by Eq. (8) for a harmonic crystal. Making the assumption Eq. (5) for a polycrystal and in the limit of low temperatures where may be neglected, Eq. (27) reduces to Eq. (9).
For an amorphous solid, we expand the in terms of the modes of the molecule given by Eq. (14). The resulting for an amorphous solid is,
| (28) |
With the assumption Eq. (16) for the and neglecting , Eq. (28) reduces to Eq. (17) for amorphous solids. As discussed in section IV B, the coherent of an amorphous solid is directly proportional to the DOS that would be observed in the incoherent DSF. There is no well defined wave vector and therefore no coupling between and as there is in the crystalline case. For an anharmonic solid, we expect in the crystalline and amorphous phases to both be substantially broadened by anharmonic effects which will make the two quite similar.
The two phonon term is the term proportional to in the expansion of Eq.(22). Substituting the expansion Eq. (4) in this term, we obtain,
| (29) |
where
| (30) |
and where and . For a polycrystalline sample in which Eq. (5) is assumed to hold and in which the temperature is low, reduces to
| (31) |
where
| (32) |
Since is a broad function, the will be an even broader function since is a convolution. is significant in solid helium and contributes to at higher . When is significant, we expect given by (1) to be even more similar for amorphous and crystalline solids, especially at higher .
References
- Kim and Chan (2004a) E. Kim and M. H. W. Chan, Science 305, 1941 (2004a).
- Kim and Chan (2004b) E. Kim and M. H. W. Chan, Nature (London) 427, 225 (2004b).
- Rittner and Reppy (2006) A. S. C. Rittner and J. D. Reppy, Phys. Rev. Lett. 97, 165301 (2006).
- Kim and Chan (2006) E. Kim and M. H. W. Chan, Phys. Rev. Lett. 97, 115302 (2006).
- Rittner and Reppy (2007) A. S. C. Rittner and J. D. Reppy, Phys. Rev. Lett. 98, 175302 (2007).
- Kondo et al. (2007) M. Kondo, S. Takada, Y. Shibayama, and K. Shirahama, J. Low Temp. Phys. 148, 695 (2007).
- Aoki et al. (2007) Y. Aoki, J. C. Graves, and H. Kojima, Phys. Rev. Lett. 99, 015301 (2007).
- Gumann et al. (2011) P. Gumann, M. C. Keiderling, D. Ruffner, and H. Kojima, Phys. Rev. B 83, 224519 (2011).
- Fefferman et al. (2012) A. D. Fefferman, X. Rojas, A. Haziot, S. Balibar, J. T. West, and M. H. W. Chan, Phys. Rev. B 85, 094103 (2012).
- Prokof’ev (2007) N. Prokof’ev, Adv. Phys. 56, 381 (2007).
- Balibar and Caupin (2008) S. Balibar and F. Caupin, J. Phys. Condens. Matter 20, 173201 (2008).
- West et al. (2009) J. T. West, O. Syshchenko, J. Beamish, and M. H. W. Chan, Nat. Phys. 5, 598 (2009).
- S. Balibar (2010) S. Balibar, Nature 464, 176 (2010).
- Xiao Mi and John D. Reppy (2012) Xiao Mi and John D. Reppy, arXiv:1204.0749v2 (2012).
- Hunt et al. (2009) B. Hunt, E. Pratt, V. Gadagkar, M. Yamashita, A. V. Balatsky, and J. C. Davis, Science 324, 632 (2009).
- Pratt et al. (2011) E. J. Pratt, J. B. Hunt, V. Gadagkar, M. Yamashita, M. J. Graf, A. V. Balatsky, and J. C. Davis, Science 332, 821 (2011).
- J. Day and J. Beamish (2007) J. Day and J. Beamish, Nature (London) 450, 853 (2007).
- Day et al. (2009) J. Day, O. Syshchenko, and J. Beamish, Phys. Rev. B 79, 214524 (2009).
- Rojas et al. (2010) X. Rojas, A. Haziot, V. Bapst, S. Balibar, and H. J. Maris, Phys. Rev. Lett. 105, 145302 (2010).
- Maris (2012) H. J. Maris, Phys. Rev. B 86, 020502 (2012).
- Beamish et al. (2012) J. R. Beamish, A. D. Fefferman, A. Haziot, X. Rojas, and S. Balibar, Phys. Rev. B 85, 180501 (2012).
- Choi et al. (2010) H. Choi, D. Takahashi, K. Kono, and K. E., Science 330, 1512 (2010).
- Choi et al. (2012) H. Choi, D. Takahashi, W. Choi, K. Kono, and E. Kim, Phys. Rev. Lett. 108, 105302 (2012).
- Rittner and Reppy (2008) A. S. C. Rittner and J. D. Reppy, Phys. Rev. Lett. 101, 155301 (2008).
- Kim et al. (2011) D. Y. Kim, H. Choi, W. Choi, S. Kwon, E. Kim, and H. C. Kim, Phys. Rev. B 83, 052503 (2011).
- Ceperley and Bernu (2004) D. M. Ceperley and B. Bernu, Phys. Rev. Lett. 93, 155303 (2004).
- Boninsegni et al. (2006) M. Boninsegni, N. V. Prokof’ev, and B. V. Svistunov, Phys. Rev. Lett. 96, 070601 (2006).
- Clark and Ceperley (2006) B. K. Clark and D. M. Ceperley, Phys. Rev. Lett. 96, 105302 (2006).
- Rossi et al. (2005) M. Rossi, D. E. Galli, and L. Reatto, Phys. Rev. B 72, 064516 (2005).
- Coasne et al. (2006) B. Coasne, S. K. Jain, and K. E. Gubbins, Phys. Rev. Lett. 97, 105702 (2006).
- Bossy et al. (2010) J. Bossy, T. Hansen, and H. R. Glyde, Phys. Rev. B 81, 184507 (2010).
- Suzuki (1987) K. Suzuki, in Methods of Experimental Physics, edited by K. Sköld and D. L. Price (Neutron Scattering, 1987), vol. 23, chapter 12.
- Jens-Boie Suck, Hermann Rudin, Hans Bretscher, Peter Gr tter, and Hans-Joachim G ntherodt (1988) Jens-Boie Suck, Hermann Rudin, Hans Bretscher, Peter Gr tter, and Hans-Joachim G ntherodt, Zeitschrift f r Physikalische Chemie 157, 817 (1988).
- Mentese et al. (2002) S. Mentese, J.-B. Suck, and V. Reát, Appl. Phys. A [Suppl.] 74, S969 (2002).
- Lauter et al. (2011) H. Lauter, V. Apaja, I. Kalinin, E. Kats, M. Koza, E. Krotscheck, V. V. Lauter, and A. V. Puchkov, Phys. Rev. Lett. 107, 265301 (2011).
- Taniguchi et al. (2010) J. Taniguchi, Y. Aoki, and M. Suzuki, Phys. Rev. B 82, 104509 (2010).
- Yamamoto et al. (2004) K. Yamamoto, H. Nakashima, Y. Shibayama, and K. Shirahama, Phys. Rev. Lett. 93, 075302 (2004).
- Pearce et al. (2004) J. V. Pearce, J. Bossy, H. Schober, H. R. Glyde, D. R. Daughton, and N. Mulders, Phys. Rev. Lett. 93, 145303 (2004).
- Bossy et al. (2008a) J. Bossy, J. V. Pearce, H. Schober, and H. R. Glyde, Phys. Rev. Lett. 101, 025301 (2008a).
- Shirahama et al. (2008) K. Shirahama, K. Yamamoto, and Y. Shibayama, Low temperature Physics 34, 273 (2008).
- Yamamoto et al. (2008) K. Yamamoto, Y. Shibayama, and K. Shirahama, Phys. Rev. Lett. 100, 195301 (2008).
- Glyde et al. (2000) H. R. Glyde, O. Plantevin, B. Fak, G. Coddens, P. S. Danielson, and H. Schober, Phys. Rev. Lett. 84, 2646 (2000).
- Plantevin et al. (2002) O. Plantevin, H. R. Glyde, B. Fåk, J. Bossy, F. Albergamo, N. Mulders, and H. Schober, Phys. Rev. B 65, 224505 (2002).
- Wallacher et al. (2005) D. Wallacher, M. Rheinstaedter, T. Hansen, and K. Knorr, J. Low Temp. Phys. 138, 1013 (2005).
- Mulders et al. (2008) N. Mulders, J. T. West, M. H. W. Chan, C. N. Kodituwakku, C. A. Burns, and L. B. Lurio, Phys. Rev. Lett. 101, 165303 (2008).
- Bossy et al. (2008b) J. Bossy, J. V. Pearce, H. Schober, and H. R. Glyde, Phys. Rev. B 78, 224507 (2008b).
- Bossy et al. (2012) J. Bossy, J. Ollivier, H. Schober, and H. R. Glyde, Euro. Phys. Lett. 98, 56008 (2012).
- Talbot et al. (1988) E. F. Talbot, H. R. Glyde, W. G. Stirling, and E. C. Svensson, Phys. Rev. B 38, 11229 (1988).
- Gibbs et al. (1999) M. R. Gibbs, K. H. Andersen, W. G. Stirling, and H. Schober, J. Phys. Condens. Mat. 11, 603 (1999).
- Sköld et al. (1972) K. Sköld, J. M. Rowe, G. Ostrowski, and P. D. Randolph, Phys. Rev. A 6, 1107 (1972).
- Buyers et al. (1975) W. J. L. Buyers, V. F. Sears, P. A. Lonngi, and D. A. Lonngi, Phys. Rev. A 11, 697 (1975).
- Glyde (1994) H. R. Glyde, Excitations in Liquid and Solid Helium (Oxford University Press, Oxford, 1994).
- Taniguchi and Suzuki (2011) J. Taniguchi, and M. Suzuki, Phys. Rev. B 84, 054511 (2011).
- Pitaevskii (1959) L. P. Pitaevskii, Sov. Phys. JETP 36, 830 (1959).
- Glyde et al. (1998) H. R. Glyde, M. R. Gibbs, W. G. Stirling, and M. A. Adams, Europhys. Lett. 43, 422 (1998).
- Cowley (1968) R. A. Cowley, Rep. Prog. Phys. 31, 123 (1968).
- Minkkiewcz et al. (1973) V. J. Minkkiewcz, T. A. Kitchens, G. Shirane, and E. B. Osgood, Phys. Rev. A 8, 1513 (1973).
- Markovich et al. (2002) T. Markovich, E. Polturak, J. Bossy, and E. Farhi, Phys. Rev. Lett. 88, 195301 (2002).
- S. W. Lovesey (1984) S. W. Lovesey, Theory of Neutron Scattering from condensed Matter (Clarendon Press, Oxford, 1984).
- Carpenter and Price (1985) J. M. Carpenter and D. L. Price, Phys. Rev. Lett. 54, 441 (1985).
- Burns et al. (2008) C. A. Burns, N. Mulders, L. Lurio, M. H. W. Chan, A. Said, C. N. Kodituwakku, and P. M. Platzman, Phys. Rev. B 78, 224305 (2008).