Time Lag in Sgr A⋆ Intra-Day Variability between the light curves at 90 and 102 GHz
Abstract
We performed the observation of the flux densities of Sgr A⋆ at 90 and 102 GHz on 6 April 2005 using the Nobeyama Millimeter Array in order to detect the time lag between these frequencies. We constructed light curves covering a few hour with 1 min bin, and the Intra-Day Variability, which had a rising phase and intensity peak, of Sgr A⋆ is clearly seen at both frequencies. We calculated the z-transformed discrete correlation function between the light curves of Sgr A⋆ at 90 and 102 GHz. The derived time lag of the flares at these frequencies was approximately zero, contrary to our expectations based on the previously reported time lag at lower frequencies. If the radio flares of Sgr A⋆ are explained by the expanding plasma model, the light curve at 90 GHz would be delayed with respect to the one at 102 GHz. However, we could not find such a delay with statistical significance in our data.
keywords:
black hole physics — Galaxy: center — galaxies: active — galaxies: nuclei1 Introduction
Sagittarius A⋆ (Sgr A⋆) is a compact source with emissions from radio to X-ray, and it is believed to be associated with the Galactic Center black hole (GCBH). Sgr A⋆ was observed at many wavelengths, and temporal flux variations were reported. Time variability observation is a powerful tool to probe the structure and emission mechanisms. From mm to submm wave, Intra-Day Variability (IDV), flux variability with a timescale of a few hours, has been observed frequently (e.g., [Miyazaki et al.(2004), Miyazaki et al. 2004]). The emitter of Sgr A⋆ is in controversy but undoubtedly the emissions come from very near the GCBH. One of possibilities that have been proposed as the radio emitter is expanding plasma ejected near GCBH. The VLA detected time lags of 20-30 min between IDVs at 22 and 43 GHz ([Yusef-Zadeh et al.(2006), Yusef-Zadeh et al.(2008), Yusef-Zadeh et al. 2006, 2008]). These time lags are consistent with the model that the radio flux is emitted from adiabatically expanding plasma. However, additional observations at other frequencies are needed to verify it.
2 Observation Data and Light Curves
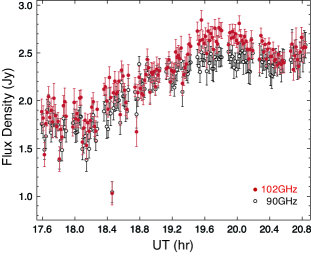
Aiming to detect a small time lag, we observed the flux densities of Sgr A⋆ at 90 and 102 GHz on 6 April 2005 using the Nobeyama Millimeter Array (NMA) in Japan. The flux densities at 90 and 102 GHz were simultaneously obtained with 1 GHz bandwidth. We alternately observed Sgr A⋆ and NRAO530 (2.16 Jy in April 2005) as calibrator. The visibility data are restricted to the projected baseline larger than 25 in order to suppress the contamination from the extended components around Sgr A⋆. Fig. 2 shows the light curves of Sgr A⋆ covering a few hour with 1 min bin at 90 and 102 GHz on 6 April 2005 using the NMA. It is obviously the IDV had a rising phase and broad intensity peak. The IDV timescale for a two-fold increase is estimated to be about 2 hour assuming that the increase has a constant gradient.
3 Cross Correlation Analysis
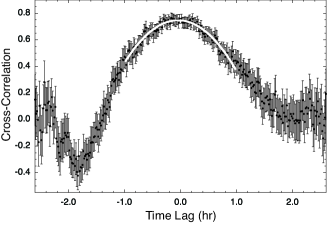
We calculated the z-transformed discrete correlation function (ZDCF; [Alexander(1997), Alexander 1997]) to search for a time lag between the light curves of Sgr A⋆ at 90 and 102 GHz on 6 April 2005 (see, fig. 2). The ZDCF appears to peak at a time lag of approximate zero. The peak time lag estimated by fitting the data to a quadratic function in the range time lag hr is min. The observed value indicates no time lag or the flux density at 102 GHz being marginally delayed relative to that at 90 GHz.
The time lag of 20-30 min between the flux variability at 22 and 43 GHz reported by [Yusef-Zadeh et al.(2006), Yusef-Zadeh et al. (2006)] supports the expanding plasma model ([van der Laan(1966), van der Laan 1966]). We estimated the time lag expected with the model based on [Yusef-Zadeh et al.(2006), Yusef-Zadeh et al.(2008), Yusef-Zadeh et al. (2006, 2008)]. If the time lag is 25 min, the time lag is expected to be min at , the index of the relativistic electron energy spectrum. The estimated time lag, min, with NMA is sufficiently smaller than the expected value, min. This result suggests that the expanding plasma blobs may be widely diverse. Some blobs may be optically thin at 100 GHz even in the initial phase of the expansion. Another possibility is that the major portion of the flux above 100 GHz does not originate from the blobs. To reveal the origin of Sgr A⋆ flare, more light curve samples are required.
References
- [Alexander(1997)] Alexander, T. 1997, in: D. Maoz, A. Sternberg, & E. Leibowitz (eds.), Astronomical Time Series, (Dordrecht: Kluwer), p. 163
- [Miyazaki et al.(2004)] Miyazaki, A., Tsutsumi, T., Tsuboi, M. 2004, ApJL, 611, L97
- [van der Laan(1966)] van der Laan, H. 1966, Nature, 211, 1131
- [Yusef-Zadeh et al.(2006)] Yusef-Zadeh, F., Roberts, D., Wardle, M., Heinke, C.O., Bower, G.C. 2006, ApJ, 650, 189
- [Yusef-Zadeh et al.(2008)] Yusef-Zadeh, F., Wardle, M., Heinke, C., et al. 2008, ApJ, 682, 361