Tracing High-Energy Radiation from T Tauri Stars Using Mid-Infrared Neon Emission from Disks
Abstract
High-energy radiation from T Tauri stars (TTS) influences the amount and longevity of gas in disks, thereby playing a crucial role in the creation of gas giant planets. Here we probe the high-energy ionizing radiation from TTS using high-resolution mid-infrared (MIR) Spitzer IRS Neon forbidden line detections in a sample of disks from IC 348, NGC 2068, and Chamaeleon. We report three new detections of [Ne III] from CS Cha, SZ Cha, and T 54, doubling the known number of [Ne III] detections from TTS. Using [Ne III]-to-[Ne II] ratios in conjunction with X-ray emission measurements, we probe high-energy radiation from TTS. The majority of previously inferred [Ne III][Ne II] ratios based on [Ne III] line upper limits are significantly less than 1, pointing to the dominance of either X-ray radiation or soft Extreme-Ultraviolet (EUV) radiation in producing these lines. Here we report the first observational evidence for hard EUV dominated Ne forbidden line production in a T Tauri disk: [Ne III][Ne II]1 in SZ Cha. Our results provide a unique insight into the EUV emission from TTS, by suggesting that EUV radiation may dominate the creation of Ne forbidden lines, albeit in a minority of cases.
Subject headings:
accretion disks, stars: circumstellar matter, planetary systems: protoplanetary disks1. Introduction
We can develop timescales for the evolution of planetary systems and refine theories of planet formation by studying the gas in the inner, planet-forming regions of disks around young TTS. On the one hand, significant gas must be present for gas giant planets to form. On the other, the lifetime of the gas in the inner disk places an upper limit on the timescale for giant planet formation. Short dissipation timescales (1000 yr) favor the formation of planets via gravitational instability (e.g., Boss, 1997) while longer dissipation timescales allow for core accretion, which takes a few Myr (e.g., Lissauer & Stevenson, 2007). The amount and longevity of gas in the disk is linked to the rate at which gas is eroded by photoevaporative winds created by high energy radiation fields from the central star (Hollenbach et al., 1994; Clarke et al., 2001; Alexander & Armitage, 2009).
Initial models of photoevaporation by EUV (13.6 eV h 100 eV) emission predicted low mass loss rates of M⊙ yr-1 (e.g., Hollenbach et al., 1994; Clarke et al., 2001; Alexander et al., 2006). Recent models of photoevaporation which include X-ray (0.1-2 keV) and far-ultraviolet (FUV; 6 eV h 13.6 eV) emission achieve mass loss rates up to yr-1 (Ercolano et al., 2009; Gorti & Hollenbach, 2009; Owen et al., 2011). Observations of objects with rates much lower than this limit and still surrounded by substantial disks challenge these recent photoevaporation models (Ingleby et al., 2011). These observations are in better agreement with the low mass loss rates predicted by the EUV photoevaporation models. However, the main weakness of photoevaporation models is the uncertainty in the ionizing flux, given that no robust measurement of EUV emission from TTS currently exists.
In TTS, most EUV emission is produced in the stellar corona and the transition region between the corona and chromosphere in active stars (Brown, 2010). Accreting TTS may have additional contribution to the EUV emission from the accretion shock which, in the near-UV (NUV), is significantly in excess of the UV emission from an active chromosphere for typical TTS (Calvet & Gullbring, 1998). Our knowledge of the strength of EUV emission from TTS is limited due to absorption of EUV photons by neutral hydrogen along the line of light. In accreting TTS, EUV emission may be absorbed in the accretion flows, which have high column densities () up to cm-3; even for non-accreting TTS, the interstellar hydrogen column density dampens the transmission of EUV photons. For example, the column density of neutral hydrogen toward TW Hya, the closest accreting TTS, is 51020 cm-3 (Kalberla et al., 2005; Dickey & Lockman, 1990). According to Drake (1999), with these column densities, less than 10% of the EUV flux at 100 Å will be transmitted through the interstellar medium, making it difficult to ascertain the EUV spectrum.
A mission devoted to EUV observations, the Extreme Ultraviolet Explorer (EUVE) All Sky Survey was unsuccessful in detecting TTS. However, it did obtain spectra of many active stars, including RS CVn stars (Sanz-Forcada et al., 2002) and dwarf stars which undergo strong flares (Brown, 2010). The EUV spectra of these active stars are sometimes used when approximating the radiation field incident on circumstellar disks (Owen et al., 2010). Whether or not this is an appropriate proxy for a TTS’s EUV radiation field is unclear.
As a result, secondary methods for estimating the strength of the EUV radiation field have been sought. Alexander et al. (2005) used FUV He II 1640 Å line fluxes to probe the strength of ionizing emission at 228 Å. However, Ardila et al. (submitted) argue that other mechanisms besides radiative recombination may play a role in the excitation of the line. For example, (Brown et al., 1981) find that collisional excitation plus photon trapping were the dominant agents in He II 1640 Å formation in the case of T Tau. Another alternative is to use observations of solar type stars at different ages to infer the evolution of high energy radiation fields. Ribas et al. (2005) analyzed high energy emission from the X-ray to the FUV of nearby young stars between 0.1 and 7 Gyr, from which they developed power law fits to the decay in high energy radiation fields. Due to the proximity of the targets, they were able to use EUV spectra obtained with EUVE, but even then, most of the detected flux was in emission lines. The strength of the emission lines (mainly highly ionized Fe lines) was observed to decrease with age. It is unclear whether the Ribas et al. (2005) power laws for EUV radiation may be extended down to the ages of T Tauri stars (1–10 Myr). Given that X-ray and FUV emission likely saturate at ages 10–30 Myr (Preibisch et al., 2005; Ingleby et al., 2012), EUV emission may saturate as well.
An alternative high-energy radiation diagnostic line emerged with the detection of mid-infrared (MIR) fine-structure forbidden emission lines of Ne II with the Infrared Spectrograph (IRS; Houck et al., 2004) on the Spitzer Space Telescope (Werner et al., 2004) in over 50 TTS (Pascucci et al., 2007; Espaillat et al., 2007; Lahuis et al., 2007; Flaccomio et al., 2009; Güdel et al., 2010; Baldovin-Saavedra et al., 2011; Szulagyi, 2012). Due to the high first ionization potential of Ne (21.56 eV), [Ne II] is capable of constraining high energy stellar radiation. Two mechanisms have been proposed to be responsible for [Ne II] lines in disks around TTS; while some researchers have posited that MIR Ne fine-structure lines can be attributed solely to X-ray ionization and heating (Glassgold et al., 2007, GNI07), recent work by Hollenbach & Gorti (2009, HG09) has shown that EUV photons can play an important role in creating [Ne II] lines.
In the GNI07 thermal-chemical model, the gas in the upper atmosphere of the protoplanetary disk is heated and ionized by stellar X-rays. GNI07 and Meijerink et al. (2008) have shown that X-rays can heat the gas in the disk to temperatures up to 4000-5000 K at an altitude where NH1021 cm-2 out to about 25 AU from the star. These authors find that the degree of ionization in these regions is less than a few percent. These two works consider only X-rays for ionizing the neutral and low-ionization forms of the Ne atom since FUV photons have insufficient energy to ionize Ne and EUV is absorbed over short distances. More recently, HG09 argue that EUV heating should not be discounted given that it can penetrate disk winds when the mass accretion rate onto the star is less than 10-8 M⊙ yr-1, the average accretion rate in TTS (Hartmann et al., 1998). HG09 have shown that EUV photons can potentially play an important role in creating [Ne II] lines as well. These lines can originate in the EUV surface layer of the disk which is completely ionized and reaches temperatures as high as 10,000 K (Hollenbach et al., 1994, e.g.,).
Since the first detections of MIR Ne fine-structure lines, researchers have attempted to link observed [Ne II] line luminosities to high-energy stellar radiation. Pascucci et al. (2007) found a correlation between the [Ne II] luminosity and the X-ray luminosity, supporting X-rays as the dominant [Ne II] production mechanism. However, Espaillat et al. (2007) did not find such a trend between [Ne II] luminosities and X-ray luminosities. Instead, they found a correlation between the [Ne II] luminosity and the accretion rate. Espaillat et al. (2007) proposed that this was evidence that EUV radiation was important in creating [Ne II] lines given that the accretion shock on the stellar surface is expected to create EUV emission, as mentioned earlier. Moreover, Calvet et al. (2004) found that FUV fluxes scale with Lacc and a similar scaling is expected for EUV emission. Later work by Güdel et al. (2010) with a much larger sample, found correlations between the [Ne II] luminosity and both the X-ray luminosity and accretion rate. However, these correlations have large scatter, possibly due to different disk structures (Schisano et al., 2010) or variability. Based on known [Ne II] detections, it is difficult to distinguish between the relative importance of X-ray and EUV radiation in creating Ne fine-structure line emission in disks without additional data.
Here we approach the issue of linking high-energy TTS radiation to disk gas emission from a different avenue with new [Ne III] emission line detections. Ne has a second ionization potential of 41.0 eV, and [Ne III], like [Ne II], can originate in either the X-ray or EUV layer of the disk (GNI07, HG09). Due to the limited number of [Ne III] detections in the past (Lahuis et al., 2007; Flaccomio et al., 2009; Najita et al., 2010), the potential of this line to trace high energy radiation has not been significantly utilized. Recently, Szulagyi (2012) made an extensive search for [Ne III] in 56 disks around TTS and found no detections. This highlights the rarity of this line and the importance of using new [Ne III] line detections to constrain the radiation field irradiating the circumstellar disk. In Section 2, we detail our sample selection and review the data presented in this work. In Section 3, we present three new [Ne III] emission line detections in our sample (Section 3.1) and search for correlations between X-ray radiation and [Ne III] emission lines (Section 3.2). We discuss the implications of our results on the connection between high-energy TTS radiation and the disk in further detail in Section 4.
2. Observations & Data Reduction
2.1. Sample Selection
Our sample consists of 19 objects in NGC 2068, IC 348, and Chamaeleon (Table 1). Chamaeleon is a 2 Myr old region with relatively isolated star-formation and low extinction (Luhman et al., 2008). NGC 2068 and IC 348 are 2 Myr old (Flaherty & Muzerolle, 2008) and 3 Myr old (Luhman et al., 2003), respectively, and are more clustered star-forming regions with higher extinction. The main goal of our project was to detect the [Ne II] line using high-resolution Spitzer IRS spectra. Therefore, we selected disks where it would be easier to detect line emission, namely those that exhibited low continuum emission such as transitional disks (TD), pre-transitional disks (PTD), and full disks with low continuum emission (Espaillat et al., 2012).
We identified the disks for this sample using the criteria above and existing low-resolution IRS spectra. This sample contains 6 FD, 6 TD, and 7 PTD (Table 2), all of which have known disk properties determined by SED fitting using the D’Alessio et al. (2006) irradiated, accretion disk model. The low-resolution IRS spectra for our NGC 2068 and IC 348 objects were presented in Espaillat et al. (2012) along with detailed SED modeling. For our Chamaeleon targets, low-resolution IRS spectra were presented in Kim et al. (2009) and Manoj et al. (2011). In Espaillat et al. (2011), we presented detailed modeling of the SEDs of CS Cha, SZ Cha, T 35. Modeling of T 54 was presented in Kim et al. (2009). Stellar parameters for our targets and references for these quantities are listed in Table 2.
2.2. Data Reduction
Here we present high-resolution Spitzer spectra for our 19 targets as well as X-ray data for most of our sources in IC 348 and NGC 2068.
2.2.1 Infrared Data
Spitzer IRS spectra for all of our targets except CS Cha were taken in General Observing (GO) Program 40247 (PI: Calvet; Table 3). We also included archival IRS observations of CS Cha from Program 30300 (PI: Najita; Table 3). All of the observations were performed in staring mode using the short-high-resolution module (SH) of IRS, spanning wavelengths from 10–19 m, with a resolution 600.
Details on the observational techniques and general data reduction steps, including bad pixel identification, sky subtraction, and flux calibration, can be found in Furlan et al. (2006) and Watson et al. (2009). Here we provide a summary. Each object was observed twice along the slit, at a third of the slit length from the top and bottom edges of the slit. Instead of using the basic calibrated data (bcd) products from the Spitzer Science Center pipeline, we used the droop products, pipeline version S18.18. As opposed to the bcd products, the droop products lack corrections for inter-order light leakage (which is a very small effect) and are not divided by the flatfield. We found that especially the latter step introduced more noise to our data, so the droop products yielded spectra with better signal-to-noise ratios.
We reduced the data with the SMART package (Higdon et al., 2004) and used the ISO Spectral Analysis Package (ISAP) within SMART to measure line fluxes, uncertainties, and upper limits. Bad and rogue pixels were corrected by interpolating from neighboring pixels. For each of the targets, we obtained several observations at each nod position to increase the time spent on the target. We also acquired an off-source background observation for each target. We extracted each background-subtracted spectrum individually, then calculated their average and standard deviation. After background subtraction, a full slit extraction was performed. To flux calibrate the observations we used spectra of Dra (K2III). We performed a nod-by-nod division of the target spectra and Dra spectra and then multiplied the result by a template spectrum (Cohen et al., 2003). The final spectrum was produced by averaging the calibrated spectra from the two nods, and uncertainties were derived from the standard deviation of the mean flux at each wavelength. Our spectrophotometric accuracy is typically 2–5. We note that we manually masked artifacts in the extracted, calibrated spectra that were not captured by the bad pixel and rogue masks. We also applied extinction corrections to the IRS data using the AV for each object listed in Table 2.
The average signal-to-noise ratio (SNR) in the continuum for our spectra is 30, with a range of 15–70. We note that FM 281 has SNR5 and so we exclude these data from our analysis. We overlaid the IRS slit positions for each AOR on K-band images from the Two Micron All Sky Survey (2MASS; Skrutskie et al., 2006) to check for anomalous behavior. In the observation of LRLL 21 in IC 348, another object was located in one of the nods. However, our SH spectrum (with a slit width of 4.7′′) agrees with an earlier GTO SL spectrum (slit width = 3.6′′; AOR ID: 16269056) which does not include this object. We conclude that this other object that entered the slit does not emit significantly in the mid-infrared and so object LRLL 21 dominates the SH spectrum presented here.
2.2.2 X-ray Data
Of the 19 targets in our sample, X-ray properties for 18 of them were either extracted in this work from Chandra observations or compiled from the literature. X-ray luminosities for the Chamaeleon targets were taken from the literature (Table 2). X-ray properties for objects in IC 348 and NGC 2068 come from this work. Chandra observations were obtained as part of a joint Chandra-Spitzer GO program (Proposal 09200909, PI: Calvet) for IC 348 (Observation ID (Obs ID) 8584) and NGC 2068 (Obs ID 8585 and 10763). We note that our Spitzer and Chandra data were not taken simultaneously.
The above observations were performed with the Chandra Advanced CCD Imaging Spectrometer (ACIS) in FAINT mode using the Imaging Array (ACIS-I) and Spectroscopic Array (ACIS-S). Dates and exposure times can be found in Table 4. The evt2 files analyzed here were obtained through the Chandra processing pipeline (version: 7.6.11.4). Events and spectra for targets in our sample were extracted using the ACIS Extract (AE) software package (version 2010-02-26)111 The ACIS Extract software package and User’s Guide are available at http://www.astro.psu.edu/xray/acis/acis$_$analysis.html and the aebetterbackgrounds algorithm. (Broos et al., 2010).
We measured X-ray fluxes for our NGC 2068 and IC 348 targets by extracting X-ray spectra using the HEASARC X-ray fitting package XSPEC version 12.6 (Arnaud, 1996) and AE fitting scripts. Source counts over the energy range 0.5–8 keV are listed in Table 5. Most of the sources have more than 100 counts, the exceptions being LRLL 72, LRLL 133, and FM 281. LRLL 2 and LRLL 6 have over 1,000 counts.
We fit all of the spectra with single- and two-temperature vapec thermal collisional ionization equilibrium plasma models (Smith et al., 2001) along with an absorbing column of interstellar material (i.e. tbabs absorption model; Wilms et al., 2000). Automated fitting performed by AE adopted elemental abundances frozen at the values used by the XEST study for typical pre-main sequence stars (Güdel et al., 2007). We left the temperature(s) and the absorbing hydrogen column density, , as free parameters. In most cases, the between the one- and two-temperature fits were similar. In Table 5 we list the parameters from the best fitting one-temperature model. However, for LRLL 67, FM 177, and FM 618, the of the two-temperature model was 2–3 times better than that of the one-temperature model. For these three objects we list the parameters of the best fit two-temperature model in Table 5. The luminosities were derived from spectral modeling assuming a distance of 315 pc for IC 348 (Luhman et al., 2008) and 400 pc for NGC 2068 (Flaherty & Muzerolle, 2008).
We note that FM 515 was not within the FOV of the observations and was not located in the Chandra or XMM-Newton data archive. Therefore, we do not provide an X-ray flux for FM 515 here. LRLL 133 was located within the FOV of our IC 348 observation, but was not detected while LRLL 21 was not within the FOV. However, LRLL 133 and LRLL 21 were detected in ObsID 606 (53 ks; 2000-09-21; PI: Preibisch) and these data were used to extract the X-ray fluxes for these two objects in Table 5. LRLL 68 was within the FOV of our observations, but was not detected and was not observed by another program. We estimate an upper limit for the luminosity of this source by calculating the on-axis limiting sensitivity of ObsID: 8584 with the Portable Interative Multi-Mission Simulator (PIMMS)222 http://heasarc.gsfc.nasa.gove/Tools/w3pimms.html. We assume an on-axis detection of 3 counts over the energy range 0.5–8 keV in our 50.14 ks exposure and a thermal plasma of 2 keV. We adopt an absorbing column of 1.61022 cm-2, calculated with the and relation of Vuong et al. (2003), along with an AJ of 0.83 from Luhman et al. (2003). The derived limiting flux is 7.410-16 ergs s-1 cm-2 and the limiting absorption-corrected flux is 1.910-15 ergs s-1 cm-2. We adopt an upper limit of 2.31028 ergs s-1 for the absorption-corrected X-ray luminosity of LRLL 68.
3. Results
Here we search for Neon forbidden emission in our sample. We explore the relationship between [Ne III] lines and high-energy radiation by looking at the X-ray properties of TTS with [Ne II]. In our sample of disks with [Ne III], we also compare X-ray properties to observed [Ne III]-to-[Ne II] ratios.
3.1. Neon Line Detections
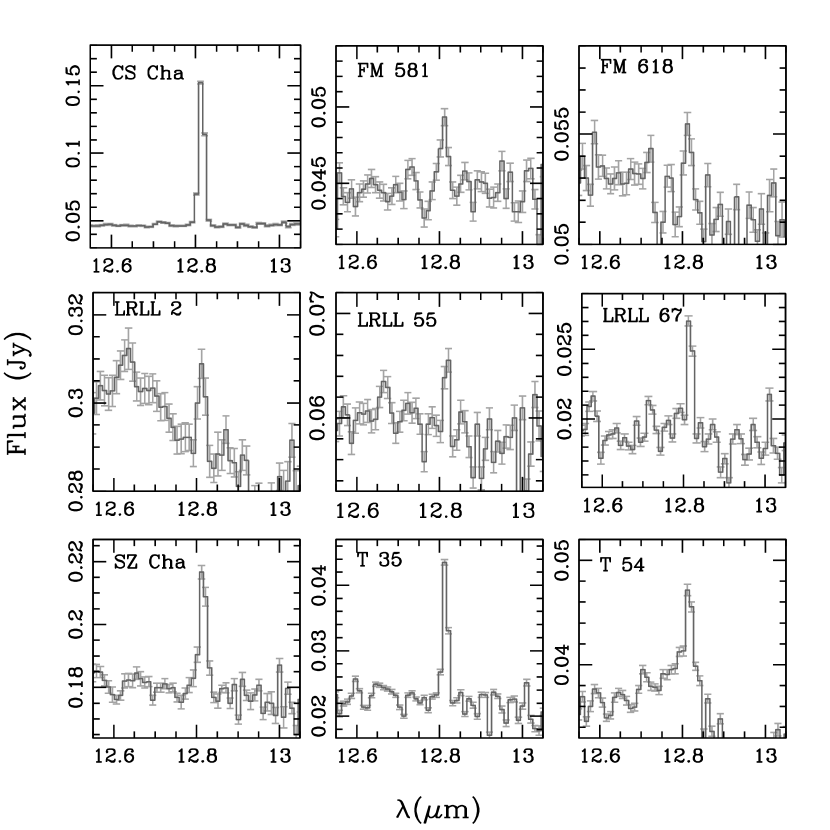
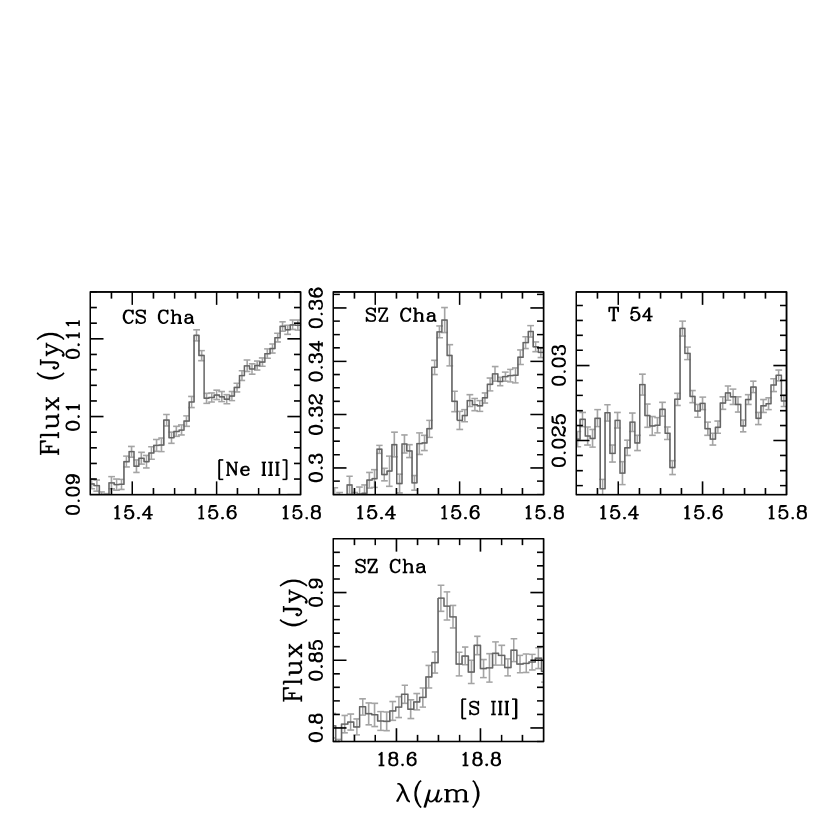
We detected [Ne II] line emission from nine objects in our sample (Figure 1). Line fluxes, errors, and SNR are listed in Table 6 along with 3 upper limits for sources with non-detections. [Ne III] lines are also present in three objects in our sample: CS Cha, SZ Cha, and T 54 (Figure 2; Table 6). [S III] is also detected in SZ Cha with a line flux of 2.630.310-14 erg cm-2 s-1 and SNR12 (Figure 2). We note that the 13 to 12 transition of H2O is located at 15.57 m. However, neither SZ Cha, CS Cha, nor T 54 have evidence for any other water lines in their spectra. It is highly unlikely that only one of the numerous H2O line transitions would be present (see Figure 4 of Pontoppidan et al., 2010).
In SZ Cha the [Ne III] and [S III] lines are broader than the [Ne II] line. The FWHM of [Ne III] and [S III] is 700 km s-1. The FWHM of [Ne II] is 500 km s-1, essentially equal to the resolution of the IRS SH module. Inspection of the data shows that these lines are not spatially extended. However, one pixel is 2.3′′ or about 370 AU at 160 pc. Therefore, we cannot exclude the possibility that these broad line widths indicate more than one emitting region within 370 AU (e.g. disk, wind). Najita et al. (2009) suggested the [Ne II] line flux was composed of both a broad, extended shock component and a spatially unresolved disk component based on ground-based high-resolution spectra of two different disks. Likewise, higher spectral and spatial resolution data of SZ Cha are needed to explore this further.
3.2. [Ne III] & High-Energy Radiation
Compared to [Ne II], [Ne III] line emission is much less common. Prior to this work, there were only three reports of [Ne III] lines: Sz 102 (Lahuis et al., 2007), WL 5 (Flaccomio et al., 2009), and TW Hya (Najita et al., 2010). Here we reported three new detections in SZ Cha, T 54, and CS Cha. We limit ourselves to objects with disks in this work and exclude the Class III object WL 5333 McClure et al. (2010) classified WL 5 as a Class III object based on its low-resolution IRS spectrum. The spectrum of WL 5 presented in McClure et al. (2010) is a composite of two objects. In the short-low-resolution module of IRS (SL; 5–14 m), WL 5A was the only object in the slit while in the long-low-resolution module of IRS (LL;14–38 m) its companion (8.5′′ away) entered the slit. WL 5A is a photosphere based on the SED slope in the SL data. The companion is most likely a Class I object based on the steeply rising SED observed in the LL data. Given the orientation of the SH slit used in Flaccomio et al. (2009)’s observation of WL 5A and the fact that a nearby background observation was not taken for data reduction, it is likely that some emission from the nearby Class I object entered the slit. Therefore, the Ne fine-structure line emission from WL 5 is most likely from the nearby Class I object, especially given that Class III objects are typically not surrounded by material.. To the best of our knowledge, there are no studies which search for jets in NGC 2068 and IC 348. SZ 102 and CS Cha are known to have jets (Lahuis et al., 2007; Takami et al., 2003; Güdel et al., 2010).
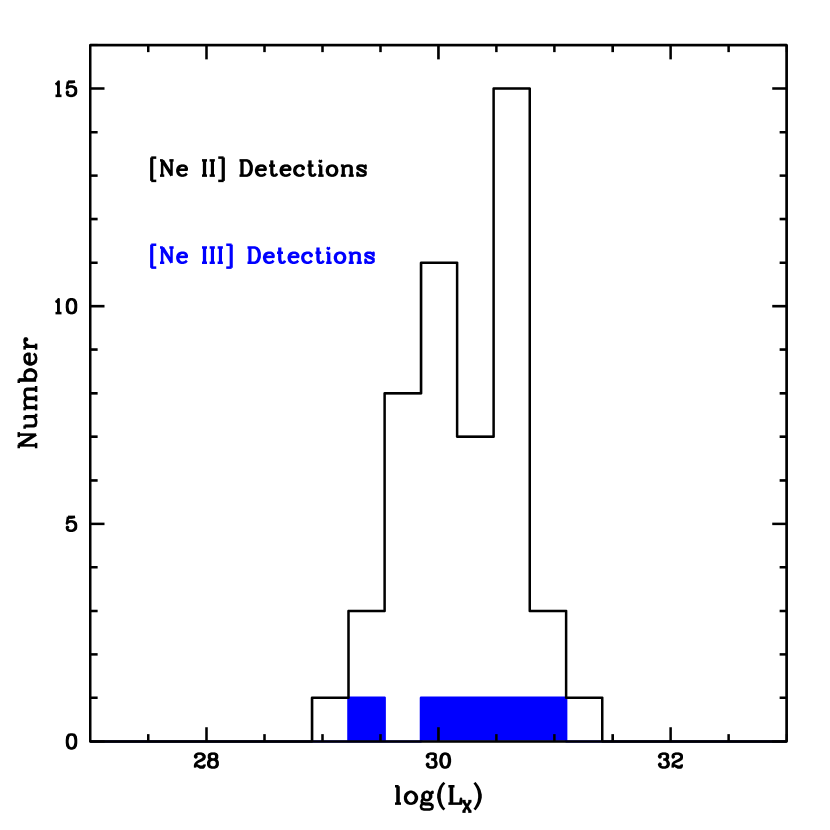
Since MIR Ne fine-structure lines have been proposed to be due to X-rays (GNI07, HG09), we first tested if sources with [Ne III] have a higher X-ray luminosity than sources that have [Ne II] but no [Ne III] detections. Our sample in Figure 3 is composed of objects in this work and the literature which have reported [Ne II] detections and X-ray luminosities (see the Appendix for more details; Güdel et al., 2010; Baldovin-Saavedra et al., 2011; Carr & Najita, 2011; Sacco et al., 2012; Lahuis et al., 2007; Najita et al., 2010; Pascucci et al., 2007; Ingleby et al., 2011; White et al., 2000; Neuhaeuser et al., 1995). We find that the X-ray luminosities of objects with [Ne III] lines is similar to those of objects with only [Ne II] lines. The median X-ray luminosity of sources with [Ne II] but without [Ne III] is 1.61030 ergs s-1. For those with [Ne III] lines, the median is 2.11030 ergs s-1. Given that the KS probability these are both taken from the same distribution is 99, we conclude that sources with [Ne III] emission are not significantly more luminous in X-rays than sources without [Ne III] emission. However, we note that given the small number of known sources with [Ne III] emission, this needs to be confirmed with a larger sample.
[Ne II] and [Ne III] can be also be due to EUV radiation from the central star (HG09). One way to distinguish between X-ray and EUV creation of Ne fine-structure emission is by measuring the [Ne III]-to-[Ne II] line ratio. Ne ion production by X-ray emission can lead to [Ne III]-to-[Ne II] line ratios of the order 0.1 (see Fig. 4 of GNI07 and Fig. 17 Meijerink et al., 2008). However, EUV photons can lead to much higher [Ne III]-to-[Ne II] line ratios (HG09). This is largely because X-ray photons penetrate deeper into the disk than EUV photons. The GNI07 and HG09 models find that the X-ray dominated layer of the disk is predominantly neutral. The abundance of H atoms leads to efficient charge exchange of Ne++ and H, leading to Ne+. Therefore, in the X-ray layer of the disk, there will be more Ne II than Ne III, leading to larger [Ne II] line luminosities relative to those of [Ne III]. In contrast, the models find that the EUV regions are fully ionized; the abundance of H atoms is low and so here charge exchange is not that efficient. Therefore, in the EUV layer of the disk there will be more Ne III relative to the X-ray layer and hence it is possible that the [Ne III] line luminosity can be greater than the [Ne II] line luminosity.
Prior to our work, all objects with [Ne III] emission had [Ne III][Ne II]0.1, in line with X-ray dominated Ne ion production. Here we report the first source with [Ne III][Ne II]1, SZ Cha, which has a ratio of 1.360.24. We note that T 54 also has [Ne III][Ne II]0.1. However, T 54’s ratio of 0.340.13 is not 3 above 0.1 within the uncertainties of the line measurement; future observations with higher sensitivity are needed to confirm this ratio. The value of [Ne III][Ne II] can also trace the shape of the EUV spectrum. [Ne III][Ne II]1 points to roughly LEUV (Fig 1. of HG09; U. Gorti, personal communication). A caveat is that it is likely X-rays are present and will contribute to the observed [Ne II] line emission, contaminating the EUV spectral slope determination.
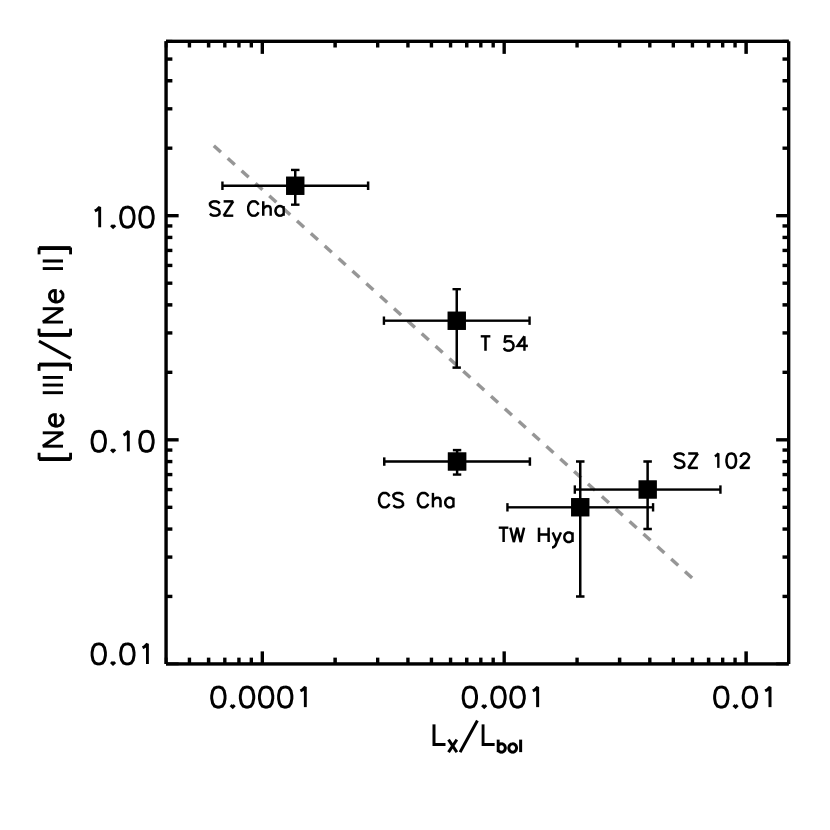
Given that the EUV luminosity has to be two times greater than the X-ray luminosity to dominate Ne ion production (HG09), we compared the [Ne III]-to-[Ne II] line ratio to the X-ray luminosity of the object, normalized by its bolometric luminosity (Lbol; Figure 4). We note that here we use Lbol to refer to the stellar luminosity (L∗). LX and L∗ for SZ Cha, CS Cha, and T 54 are listed in Table 2. TW Hya’s LX and L∗ are from Ingleby et al. (2011). SZ 102’s LX is from Güdel et al. (2010); we estimated L∗ using 2MASS photometry and Kenyon & Hartmann (1995) colors for an M0 star (Lahuis et al., 2007). We note that CS Cha and T 54 are known binaries. CS Cha is a spectroscopic binary with a separation of 4 AU (Guenther et al., 2007) and both components are of equal brightness (Nguyen et al., 2012). Neither component was resolved in the optical nor X-ray. T 54 is brighter than its secondary by a factor of at least 5 and their separation is 40 AU (Lafrenière et al., 2008). Using based on the primary star should not significantly affect the correlation we find here, especially given that we assume that the error in LX is dominated by the variability in the X-ray. We adopt an error of a factor of 2 for LX based on the typical range in X-ray variability, as has been done in previous works (e.g., Güdel et al., 2010).
In Figure 4, [Ne III][Ne II] increases as LXLbol decreases. We find a strong trend (with a Pearson correlation coefficient of -0.9) and fit the data with the following equation:
| (1) |
This trend is consistent with EUV radiation dominating the production of [Ne II] and [Ne III] at low LXLbol values in Figure 4 and leading to a high [Ne III][Ne II]. It follows that X-ray radiation dominates the heating of the disk at higher LXLbol values in Figure 4, creating more [Ne II] than [Ne III] (i.e., [Ne III][Ne II]1). We note that this trend is promising, but largely driven by SZ Cha. Future work with archival high-resolution IRS spectra and JWST may reveal additional objects with [Ne III][Ne II]0.1 and known LX that can be used to confirm this relation.
Another potentially important diagnostic of high-energy radiation could lie in the relationship between [Ne III][Ne II] and [S III]. Here we detected [S III] in SZ Cha, the disk in our sample with the highest [Ne III][Ne II]. S++ and Ne++ have similar charge exchange rates with H (Butler & Dalgarno, 1980). Therefore, for the same reasons outlined earlier, we would expect more S III when EUV dominates the production of Ne II and Ne III. Prior to this work [S III] had only been detected in the disk of SSTc2dJ1829282 (Lahuis et al., 2007). Using [Ne III] upper limits from Lahuis et al. (2007) we estimate [Ne III][Ne II]0.18, in contrast to the large [Ne III][Ne II] observed for SZ Cha. We leave it to future work to explore any potential connection between these lines and high-energy ionizing radiation.
4. Discussion
There has not yet been a definitive observational result discriminating between X-ray and EUV radiation as the primary source of Ne forbidden line emission. There have been over 50 objects with [Ne II] line detections to date (Pascucci et al., 2007; Espaillat et al., 2007; Lahuis et al., 2007; Flaccomio et al., 2009; Güdel et al., 2010; Baldovin-Saavedra et al., 2011; Szulagyi, 2012). There have also been many theoretical works examining the importance of the Ne line luminosities and their connection to high-energy radiation (Glassgold et al., 2007; Meijerink et al., 2008; Ercolano et al., 2008; Gorti & Hollenbach, 2008; Hollenbach & Gorti, 2009; Schisano et al., 2010; Ercolano & Owen, 2010). However, comparing observations and theories has not led to clear results. There have been no distinct correlations between [Ne II] line luminosities and LX or mass accretion rates. In the case of [Ne II], it is not obvious that expanding the known sample of disks with these lines will lead to substantially clearer results. We note that the LX and mass accretion rates for objects in our sample with detected [Ne II] falls within range of those objects with [Ne II] line detections in literature and that our results are consistent with previous results. In addition, the models of HG09 and GNI07 use LX1028–1032 ergs s-1 in their models, covering the range seen in the observations.
Another relatively unexplored avenue to probe the relative importance of X-ray and EUV radiation in creating Ne forbidden line emission lies in [Ne III] line detections. Of those disks with [Ne II] line detections, only five disks have [Ne III] line detections, three of which come from this work. While [Ne III] detections are very rare, we can start to make preliminary studies of these lines with the expectation that these results can be greatly expanded upon with JWST. Out of the six objects with known [Ne III] line emission, five of these have [Ne III][Ne II]1. Also, based on [Ne II] and [Ne III] upper line limits, Szulagyi (2012) find that typically [Ne III][Ne II]1. This ratio can either be a result of X-ray or soft EUV as the primary source of Ne forbidden lines according to the models of HG09. We note that our report of CS Cha’s [Ne III][Ne II] agrees with previously observed ratios for TW Hya and SZ 102, i.e, ratios about 0.1 or less, of the order theoretically predicted by GNI07 and Meijerink et al. (2008). T 54’s ratio of 0.3 is higher than that of CS Cha, TW Hya, and SZ 102. However, Ercolano & Owen (2010) get [Ne III][Ne II] up to 0.3 in TD since the gas in these disks tends to be warmer than that of FD. Studies of other lines like [Ar II] have [Ar II]-to-[Ne II] ratios which indicate either soft EUV or soft X-ray emission as the primary source of these lines (Szulagyi, 2012).
SZ Cha is the only known object to date with [Ne III][Ne II]1; HG09 have shown that this high ratio can only occur in the EUV layer of the disk. If confirmed, this result in SZ Cha would be the only clear observational result discriminating between X-ray and EUV radiation as the primary source of Ne forbidden line emission. Some caveats to bear in mind are that the charge exchange coefficients used in the theoretical models need to be updated (Butler & Dalgarno, 1980; Ercolano & Owen, 2010). In addition, high-resolution spectroscopy of the [Ne III] line in SZ Cha is necessary to constrain where in the disk this emission is originating from. Lastly, a larger sample of disks with [Ne III] line detections is necessary to test this further.
While [Ne III][Ne II]1 is an indication of EUV-dominated production of Ne ions, the issue still remains that EUV radiation is easily absorbed in the environment of the star and may not even reach the disk. However, EUV radiation should be able to reach the disk in the case of SZ Cha given its substantial accretion rate (2.410-9 M⊙ yr-1 as measured from its U-band excess by Espaillat et al., 2011). This is because in order for the EUV radiation to penetrate the protostellar wind, the outflow mass loss rate must be less than 10-9 M⊙ yr-1 (HG09). This corresponds to a mass accretion rate of 10-8 M⊙ yr-1 given that protostellar winds of TTS are typically 0.1 of the mass accretion rate (Hartigan et al., 1995; Calvet, 1997). Therefore, EUV radiation should reach the disk of SZ Cha given its accretion rate.
These Neon forbidden line observations raise the question of whether EUV photoevaporation is responsible for the gapped disk structure of SZ Cha. Based on SED modeling, SZ Cha has an inner disk separated from the outer disk by a 20 AU gap (Espaillat et al., 2011). EUV photoevaporation models predict that the disk wind will open a small, short-lived gap within the outer disk before clearing out an inner hole and then the rest of the outer disk (e.g., Clarke et al., 2001). However, the gaps from photoevaporation are expected to open quickly relative to the lifetime of the disk, and so it is unlikely that we are catching the disk in this short-lived phase (Alexander et al., 2006). Instead, we propose that the gap in SZ Cha was formed through dynamical clearing by either planetary (Zhu et al., 2011) or stellar mass (Artymowicz & Lubow, 1994) companions before EUV photoevaporation took effect. In the case of planetary mass companions, one can speculate that their presence led to a decrease in the mass accretion rate (e.g., Lubow & D’Angelo, 2006; Rice et al., 2006) necessary for EUV radiation to reach the disk, accelerating photoevaporation (Alexander & Armitage, 2009). A stellar mass companion would also quicken photoevaporation since it would increase the LX of the system, in addition to lowering or even eliminating the accretion onto the star.
Another feature of EUV photoevaporation models is the uncertainty in the EUV ionizing flux since EUV emission cannot be directly observed. If the creation of [Ne III] in SZ Cha is being dominated by EUV radiation, this provides the most direct measurement to date of the EUV emission of TTS. The [Ne III] line luminosity in SZ Cha implies LEUV of 1032–1033 ergs s-1 (0.03–0.26 L☉) according to the predictions of the HG09 model (based on LEUV). These values can be compared to SZ Cha’s Lacc (0.06 L☉; Espaillat et al., 2011) and LFUV (0.002 L☉; Ingleby et al., 2011). LEUV is of the same order as Lacc, which was determined using U-band data with an intrinsic uncertainty of a factor of 2–3 (Calvet et al., 2004), so the EUV could in principle be powered by accretion. The expected LEUV is more than a factor of 10 higher than the observed LFUV. Using the EUV spectra of solar active regions as representative, even with a strong Lyman continuum the ratio of EUV to FUV luminosities is expected to be lower than this (Vernazza & Reeves, 1978). However, LFUV is underestimated since the value is based on ACS spectra which do not cover Ly, which may be up to 90 of the total FUV luminosity (Herczeg et al., 2004; Schindhelm et al., 2012).
In conclusion, these results are an important contribution to our understanding of the effect of high energy radiation from the star on the disk. Unfortunately, the [Ne III] line is not observable from the ground, but JWST will allow us to fully exploit the potential of this line.
5. Summary
We reported new Ne forbidden line detections in high-resolution Spitzer IRS
spectra of disks in IC 348, NGC 2068, and Chamaeleon.
We use these
results, in conjunction with other reports in the literature, to arrive
at the following results and conclusions:
1. Previous
to this work the only detections of [Ne III] in disks were reported around SZ 102 and
TW Hya. Here we reported the detection of [Ne III] in CS Cha, SZ Cha, and T 54.
CS Cha and T 54 have [Ne III][Ne II]1 which is consistent
with previous [Ne III]-to-[Ne II] ratios. Such small ratios can be due to Ne forbidden
line production by either soft EUV radiation or X-ray radiation.
SZ Cha is the first object observed to have a [Ne III]-to-[Ne II] ratio of
about 1. Given that X-rays are more efficient at
producing Ne II relative to Ne III (GNI07, HG09), [Ne III][Ne II]1
indicates that EUV emission dominates the creation of Ne ions in SZ Cha.
2.
In order for EUV radiation to dominate the ionization of Ne, the EUV luminosity of the object has
to be two times greater than the X-ray luminosity
(HG09). While we do not have a direct measurement of the EUV
emission of SZ Cha, we find that the [Ne III]-to-[Ne II] ratio increases as
the X-ray luminosity (normalized by Lbol) decreases. This is
consistent with the EUV luminosity being greater than the X-ray
luminosity in objects with high [Ne III]-to-[Ne II] line ratios.
3.
Lastly, using the HG09 models we estimate that the EUV luminosity of
SZ Cha is 1032–1033 ergs s-1
(0.03–0.26 L☉).
References
- Alexander & Armitage (2009) Alexander, R. D., & Armitage, P. J. 2009, ApJ, 704, 989
- Alexander et al. (2005) Alexander, R. D., Clarke, C. J., & Pringle, J. E. 2005, MNRAS, 358, 283
- Alexander et al. (2006) —. 2006, MNRAS, 369, 229
- Arnaud (1996) Arnaud, K. A. 1996, in Astronomical Society of the Pacific Conference Series, Vol. 101, Astronomical Data Analysis Software and Systems V, ed. G. H. Jacoby & J. Barnes, 17–+
- Artymowicz & Lubow (1994) Artymowicz, P., & Lubow, S. H. 1994, ApJ, 421, 651
- Baldovin-Saavedra et al. (2011) Baldovin-Saavedra, C., et al. 2011, A&A, 528, A22
- Boss (1997) Boss, A. P. 1997, Science, 276, 1836
- Broos et al. (2010) Broos, P. S., Townsley, L. K., Feigelson, E. D., Getman, K. V., Bauer, F. E., & Garmire, G. P. 2010, ApJ, 714, 1582
- Brown (2010) Brown, A. 2010, in IAU Symposium, Vol. 264, IAU Symposium, ed. A. G. Kosovichev, A. H. Andrei, & J.-P. Roelot, 395–400
- Brown et al. (1981) Brown, A., Ferraz, M., & Jordan, C. 1981, in NASA Conference Publication, Vol. 2171, NASA Conference Publication, ed. R. D. Chapman, 297–302
- Butler & Dalgarno (1980) Butler, S. E., & Dalgarno, A. 1980, ApJ, 241, 838
- Calvet (1997) Calvet, N. 1997, in IAU Symposium, Vol. 182, Herbig-Haro Flows and the Birth of Stars, ed. B. Reipurth & C. Bertout, 417–432
- Calvet & Gullbring (1998) Calvet, N., & Gullbring, E. 1998, ApJ, 509, 802
- Calvet et al. (2004) Calvet, N., Muzerolle, J., Briceño, C., Hernández, J., Hartmann, L., Saucedo, J. L., & Gordon, K. D. 2004, AJ, 128, 1294
- Carr & Najita (2011) Carr, J. S., & Najita, J. R. 2011, ApJ, 733, 102
- Clarke et al. (2001) Clarke, C. J., Gendrin, A., & Sotomayor, M. 2001, MNRAS, 328, 485
- Cohen et al. (2003) Cohen, M., Megeath, S. T., Hammersley, P. L., Martín-Luis, F., & Stauffer, J. 2003, AJ, 125, 2645
- D’Alessio et al. (2006) D’Alessio, P., Calvet, N., Hartmann, L., Franco-Hernández, R., & Servín, H. 2006, ApJ, 638, 314
- Dickey & Lockman (1990) Dickey, J. M., & Lockman, F. J. 1990, ARA&A, 28, 215
- Drake (1999) Drake, J. J. 1999, ApJS, 122, 269
- Ercolano et al. (2009) Ercolano, B., Clarke, C. J., & Drake, J. J. 2009, ApJ, 699, 1639
- Ercolano et al. (2008) Ercolano, B., Drake, J. J., Raymond, J. C., & Clarke, C. C. 2008, ApJ, 688, 398
- Ercolano & Owen (2010) Ercolano, B., & Owen, J. E. 2010, MNRAS, 406, 1553
- Espaillat et al. (2011) Espaillat, C., Furlan, E., D’Alessio, P., Sargent, B., Nagel, E., Calvet, N., Watson, D. M., & Muzerolle, J. 2011, ApJ, 728, 49
- Espaillat et al. (2007) Espaillat, C., et al. 2007, ApJ, 664, L111
- Espaillat et al. (2012) —. 2012, ApJ, 747, 103
- Flaccomio et al. (2009) Flaccomio, E., Stelzer, B., Sciortino, S., Micela, G., Pillitteri, I., & Testi, L. 2009, A&A, 505, 695
- Flaherty & Muzerolle (2008) Flaherty, K. M., & Muzerolle, J. 2008, AJ, 135, 966
- Furlan et al. (2006) Furlan, E., et al. 2006, ApJS, 165, 568
- Glassgold et al. (2007) Glassgold, A. E., Najita, J. R., & Igea, J. 2007, ApJ, 656, 515
- Gorti & Hollenbach (2008) Gorti, U., & Hollenbach, D. 2008, ApJ, 683, 287
- Gorti & Hollenbach (2009) —. 2009, ApJ, 690, 1539
- Güdel et al. (2007) Güdel, M., Padgett, D. L., & Dougados, C. 2007, in Protostars and Planets V, ed. B. Reipurth, D. Jewitt, & K. Keil, 329–344
- Güdel et al. (2010) Güdel, M., et al. 2010, A&A, 519, A113
- Guenther et al. (2007) Guenther, E. W., Esposito, M., Mundt, R., Covino, E., Alcalá, J. M., Cusano, F., & Stecklum, B. 2007, A&A, 467, 1147
- Hartigan et al. (1995) Hartigan, P., Edwards, S., & Ghandour, L. 1995, ApJ, 452, 736
- Hartmann et al. (1998) Hartmann, L., Calvet, N., Gullbring, E., & D’Alessio, P. 1998, ApJ, 495, 385
- Herczeg et al. (2004) Herczeg, G. J., Wood, B. E., Linsky, J. L., Valenti, J. A., & Johns-Krull, C. M. 2004, ApJ, 607, 369
- Higdon et al. (2004) Higdon, S. J. U., et al. 2004, PASP, 116, 975
- Hollenbach & Gorti (2009) Hollenbach, D., & Gorti, U. 2009, ApJ, 703, 1203
- Hollenbach et al. (1994) Hollenbach, D., Johnstone, D., Lizano, S., & Shu, F. 1994, ApJ, 428, 654
- Houck et al. (2004) Houck, J. R., et al. 2004, ApJS, 154, 18
- Ingleby et al. (2012) Ingleby, L., Calvet, N., Herczeg, G., & Briceño, C. 2012, ApJ, 752, L20
- Ingleby et al. (2011) Ingleby, L., Calvet, N., Hernández, J., Briceño, C., Espaillat, C., Miller, J., Bergin, E., & Hartmann, L. 2011, AJ, 141, 127
- Kalberla et al. (2005) Kalberla, P. M. W., Burton, W. B., Hartmann, D., Arnal, E. M., Bajaja, E., Morras, R., & Pöppel, W. G. L. 2005, A&A, 440, 775
- Kenyon & Hartmann (1995) Kenyon, S. J., & Hartmann, L. 1995, ApJS, 101, 117
- Kim et al. (2009) Kim, K. H., et al. 2009, ApJ, 700, 1017
- Lafrenière et al. (2008) Lafrenière, D., Jayawardhana, R., Brandeker, A., Ahmic, M., & van Kerkwijk, M. H. 2008, ApJ, 683, 844
- Lahuis et al. (2007) Lahuis, F., van Dishoeck, E. F., Blake, G. A., Evans, II, N. J., Kessler-Silacci, J. E., & Pontoppidan, K. M. 2007, ApJ, 665, 492
- Lissauer & Stevenson (2007) Lissauer, J. J., & Stevenson, D. J. 2007, in Protostars and Planets V, ed. B. Reipurth, D. Jewitt, & K. Keil, 591–606
- Lubow & D’Angelo (2006) Lubow, S. H., & D’Angelo, G. 2006, ApJ, 641, 526
- Luhman et al. (2003) Luhman, K. L., Stauffer, J. R., Muench, A. A., Rieke, G. H., Lada, E. A., Bouvier, J., & Lada, C. J. 2003, ApJ, 593, 1093
- Luhman et al. (2008) Luhman, K. L., et al. 2008, ApJ, 675, 1375
- Manoj et al. (2011) Manoj, P., et al. 2011, ApJS, 193, 11
- McClure et al. (2010) McClure, M. K., et al. 2010, ApJS, 188, 75
- Meijerink et al. (2008) Meijerink, R., Glassgold, A. E., & Najita, J. R. 2008, ApJ, 676, 518
- Najita et al. (2010) Najita, J. R., Carr, J. S., Strom, S. E., Watson, D. M., Pascucci, I., Hollenbach, D., Gorti, U., & Keller, L. 2010, ApJ, 712, 274
- Najita et al. (2009) Najita, J. R., et al. 2009, ApJ, 697, 957
- Neuhaeuser et al. (1995) Neuhaeuser, R., Sterzik, M. F., Schmitt, J. H. M. M., Wichmann, R., & Krautter, J. 1995, A&A, 297, 391
- Nguyen et al. (2012) Nguyen, D. C., Brandeker, A., van Kerkwijk, M. H., & Jayawardhana, R. 2012, ApJ, 745, 119
- Owen et al. (2011) Owen, J. E., Ercolano, B., & Clarke, C. J. 2011, MNRAS, 412, 13
- Owen et al. (2010) Owen, J. E., Ercolano, B., Clarke, C. J., & Alexander, R. D. 2010, MNRAS, 401, 1415
- Pascucci et al. (2007) Pascucci, I., et al. 2007, ApJ, 663, 383
- Pontoppidan et al. (2010) Pontoppidan, K. M., Salyk, C., Blake, G. A., Meijerink, R., Carr, J. S., & Najita, J. 2010, ApJ, 720, 887
- Preibisch et al. (2005) Preibisch, T., et al. 2005, ApJS, 160, 401
- Ribas et al. (2005) Ribas, I., Guinan, E. F., Güdel, M., & Audard, M. 2005, ApJ, 622, 680
- Rice et al. (2006) Rice, W. K. M., Armitage, P. J., Wood, K., & Lodato, G. 2006, MNRAS, 373, 1619
- Sacco et al. (2012) Sacco, G. G., et al. 2012, ApJ, 747, 142
- Sanz-Forcada et al. (2002) Sanz-Forcada, J., Brickhouse, N. S., & Dupree, A. K. 2002, ApJ, 570, 799
- Schindhelm et al. (2012) Schindhelm, E., France, K., Herczeg, G. J., et al. 2012, ApJ, 756, L23
- Schisano et al. (2010) Schisano, E., Ercolano, B., & Güdel, M. 2010, MNRAS, 401, 1636
- Skrutskie et al. (2006) Skrutskie, M. F., et al. 2006, AJ, 131, 1163
- Smith et al. (2001) Smith, R. K., Brickhouse, N. S., Liedahl, D. A., & Raymond, J. C. 2001, ApJ, 556, L91
- Szulagyi (2012) Szulagyi, e. a. 2012, in press, ApJ
- Takami et al. (2003) Takami, M., Bailey, J., & Chrysostomou, A. 2003, A&A, 397, 675
- Vernazza & Reeves (1978) Vernazza, J. E., & Reeves, E. M. 1978, ApJS, 37, 485
- Vuong et al. (2003) Vuong, M. H., Montmerle, T., Grosso, N., Feigelson, E. D., Verstraete, L., & Ozawa, H. 2003, A&A, 408, 581
- Watson et al. (2009) Watson, D. M., et al. 2009, ApJS, 180, 84
- Werner et al. (2004) Werner, M. W., et al. 2004, ApJS, 154, 1
- White et al. (2000) White, N. E., Giommi, P., & Angelini, L. 2000, VizieR Online Data Catalog, 9031, 0
- Wilms et al. (2000) Wilms, J., Allen, A., & McCray, R. 2000, ApJ, 542, 914
- Zhu et al. (2011) Zhu, Z., Nelson, R. P., Hartmann, L., Espaillat, C., & Calvet, N. 2011, ApJ, 729, 47
Appendix A Sample Descriptions
For comparison with the results from our sample (described in Section 2.1), we compiled additional reports of [Ne II] line emission from the literature. We limited ourselves to studies of Class II disks using Spitzer IRS spectra. We note that Flaccomio et al. (2009) report [Ne II] detections in the disks of WL 10, IRS 45, and IRS 47. However, we do not include these detections in this work since they are located in areas of high extinction (AV24; McClure et al., 2010) and so their reported line fluxes are less certain. We also note that Güdel et al. (2010) report a [Ne II] detection in SZ 50, but we do not see this line in our analysis of the spectrum and so do not list SZ 50 as having a [Ne II] detection here. The literature sample used in Figure 3 consists of the objects listed in Table 7. These objects have a reported [Ne II] detection as well as known X-ray luminosities from Section 2.2.2 or from the literature.
| Object | Region | RA | DEC |
|---|---|---|---|
| CS Cha | Cha | 11h02m25s | –77d33m36s |
| FM 177 | NGC 2068 | 05h45m42s | –00d12m05s |
| FM 281 | NGC 2068 | 05h45m53s | –00d13m25s |
| FM 515 | NGC 2068 | 05h46m12s | +00d32m26s |
| FM 581 | NGC 2068 | 05h46m19s | –00d05m38s |
| FM 618 | NGC 2068 | 05h46m23s | –00d08m53s |
| LRLL 2 | IC 348 | 03h44m35s | +32d10m04s |
| LRLL 6 | IC 348 | 03h44m37s | +32d06m45s |
| LRLL 21 | IC 348 | 03h44m56s | +32d09m15s |
| LRLL 31 | IC 348 | 03h44m18s | +32d04m57s |
| LRLL 37 | IC 348 | 03h44m38s | +32d03m29s |
| LRLL 55 | IC 348 | 03h44m31s | +32d00m14s |
| LRLL 67 | IC 348 | 03h43m45s | +32d08m17s |
| LRLL 68 | IC 348 | 03h44m29s | +31d59m54s |
| LRLL 72 | IC 348 | 03h44m23s | +32d01m53s |
| LRLL 133 | IC 348 | 03h44m42s | +32d12m02s |
| SZ Cha | Cha | 10h58m17s | –77d17m17s |
| T 35 | Cha | 11h08m39s | –77d16m04s |
| T 54 | Cha | 11h12m43s | –77d22m23s |
| Object | Disk | AV | Spectral | T∗ | L∗ | M∗ | R∗ | LX | Ref. | |
|---|---|---|---|---|---|---|---|---|---|---|
| Type | Type | (K) | (M☉) | (M☉) | (R☉) | (10-8 M☉ yr-1) | (L☉) | |||
| (1) | (2) | (3) | (4) | (5) | (6) | (7) | (8) | (9) | (10) | (11) |
| CS Cha | TD | 0.8 | K6 | 4205 | 1.5 | 0.9 | 2.3 | 1.2 | 8.3 10-4 | 1, 2 |
| FM 177 | TD | 1.6 | K4 | 4590 | 1.0 | 1.2 | 1.5 | 0.004 | 3.1610-4 | 3, 4 |
| FM 281 | TD | 2.0 | M1 | 3720 | 0.4 | 0.5 | 1.6 | 0.002 | 2.6210-4 | 3, 4 |
| FM 515 | PTD | 1.6 | K2 | 4900 | 2.5 | 1.5 | 2.2 | 3.10 | … | 3, 4 |
| FM 581 | PTD | 4.1 | K4 | 4590 | 4.1 | 1.6 | 3.1 | 2.57 | 1.4510-3 | 3, 4 |
| FM 618 | FD | 2.9 | K1 | 5080 | 2.2 | 1.5 | 1.9 | 1.21 | 8.9010-4 | 3, 4 |
| LRLL 2 | FD | 3.8 | A2 | 8970 | 57.1 | 2.8 | 3.1 | … | 1.8110-3 | 3, 4 |
| LRLL 6 | FD | 3.9 | G3 | 5830 | 16.6 | 2.4 | 4.0 | … | 1.7210-3 | 3, 4 |
| LRLL 21 | PTD | 4.7 | K0 | 5250 | 3.8 | 1.6 | 2.4 | 0.20 | 7.9610-4 | 3, 4 |
| LRLL 31 | PTD | 8.6 | G6 | 5700 | 5.0 | 1.6 | 2.3 | 1.4 | 2.6210-1 | 3, 4 |
| LRLL 37 | PTD | 2.8 | K6 | 4205 | 1.3 | 0.9 | 2.2 | 0.13 | 1.8610-4 | 3, 4 |
| LRLL 55 | FD | 8.5 | M0.5 | 3850 | 1.0 | 0.6 | 2.2 | … | 2.0410-4 | 3, 4 |
| LRLL 67 | TD | 2.0 | M0.75 | 3720 | 0.5 | 0.5 | 1.8 | 0.01 | 1.3110-3 | 3, 4 |
| LRLL 68 | FD | 2.1 | M3.5 | 3470 | 0.5 | 0.3 | 2.0 | 0.04 | 6.0310-6 | 3, 4 |
| LRLL 72 | TD | 3.0 | M2.5 | 3580 | 0.7 | 0.4 | 2.1 | 0.0003 | 3.8510-5 | 3, 4 |
| LRLL 133 | TD | 3.6 | M5 | 3240 | 0.2 | 0.2 | 1.5 | 0.8 | 3.1810-5 | 3, 4 |
| SZ Cha | PTD | 1.9 | K0 | 5250 | 1.9 | 1.4 | 1.7 | 0.24 | 2.6 10-4 | 1, 2 |
| T 35 | PTD | 3.5 | M0 | 3850 | 0.4 | 0.6 | 1.5 | 0.12 | 3.310-5 | 1, 2 |
| T 54 | TD | 1.8 | G8 | 5520 | 3.3 | 1.5 | 2.0 | … | 2.110-3 | 5, 2 |
Note. — Col. (1): Name of target. Col. (2): We label objects as transitional disks (TD), pre-transitional disks (PTD), and full disks (FD). Col. (3): Visual extinction. Col. (4): Spectral type. Col. (5): Stellar temperature. Col. (6): Stellar luminosity. Col. (7): Stellar mass. Col. (8): Stellar radius. Col. (9): Mass accretion rate. Col. (10): X-ray luminosity. Col. (11): Literature references for the values listed in Cols. (1)–(10). Disk Type, AV, L∗, M∗, R∗, and are the same as those adopted in [1] Espaillat et al. (2011), [3] Espaillat et al. (2012), and [5] Espaillat et al, (in prep). LX is from [2] Ingleby et al. (2011), and [4] this work. We assume a distance of 160 pc for Chamaeleon (Luhman et al., 2003), 315 pc for IC 348 (Luhman et al., 2008), and 400 pc for NGC 2068 (Flaherty & Muzerolle, 2008).
| Object | AOR ID | Date | Exposure (s) |
|---|---|---|---|
| CS Cha | 18021632 | 2006-08-02 | 1500 |
| FM 177 | 22852864 | 2008-11-18 | 6000 |
| FM 281 | 22853376 | 2008-11-20 | 6000 |
| FM 515 | 22853888 | 2008-04-23 | 3000 |
| FM 581 | 22854400 | 2008-04-23 | 2400 |
| FM 618 | 22854912 | 2008-04-23 | 1500 |
| LRLL 2 | 22847744 | 2007-10-13 | 120 |
| LRLL 6 | 22848256 | 2008-10-17 | 480 |
| LRLL 21 | 22848768 | 2008-10-14 | 900 |
| LRLL 31 | 22849280 | 2008-10-17 | 480 |
| LRLL 37 | 22849792 | 2008-10-14 | 900 |
| LRLL 55 | 22850304 | 2008-10-14 | 2400 |
| LRLL 67 | 22850816 | 2008-10-17 | 3000 |
| LRLL 68 | 22851328 | 2008-10-17 | 3000 |
| LRLL 72 | 22851840 | 2008-10-14 | 3000 |
| LRLL 133 | 22852352 | 2008-10-13 | 3000 |
| SZ Cha | 22846208 | 2008-08-17 | 120 |
| T 35 | 22847232 | 2008-10-12 | 3000 |
| T 54 | 22846720 | 2008-10-12 | 1800 |
| Target | ObsID | Date | Exposure (ks) |
|---|---|---|---|
| IC 348 | 8584 | 2008-03-15 | 50 |
| NGC 2068 | 8585 | 2008-11-28 | 29 |
| NGC 2068 | 10763 | 2008-11-27 | 20 |
| Sourceaa Columns (1)–(2) list the target names and net counts. We note that FM 515 did not lie in the FOV of our observations and is not included here. | Spectral Fitbb Cols. (3) and (4) present the best-fit values for the extinction column density and plasma temperature parameters. Col. (5) presents the of the model fit. | X-ray Luminositiescc X-ray luminosities derived from the model spectrum are presented in cols. (6) and (7) calculated over the band 0.5–8 keV. Absorption-corrected luminosities are subscripted with . | ||||
| Object | ||||||
| (1022 cm-2) | (keV) | (1030 ergs s-1) | (1030 ergs s-1) | |||
| (1) | (2) | (3) | (4) | (5) | (6) | (7) |
| FM 177 | 288.0 | 0.78 | d | 1.02 | 4.47 | |
| FM 281 | 71.5 | 1.07 | 0.77 | 0.19 | 1.00 | |
| FM 581 | 537.5 | 0.32 | 4.20 | 5.56 | ||
| FM 618 | 186.8 | 0.93 | d | 0.69 | 3.41 | |
| LRLL 2 | 1097.7 | 0.26 | 2.57 | 3.45 | ||
| LRLL 6 | 1630.5 | 0.55 | 3.77 | 6.58 | ||
| LRLL 21 | 675.7 | 0.56 | 2.12 | 3.05 | ||
| LRLL 31 | 184.8 | 2.20 | 0.60 | 2.06 | ||
| LRLL 37 | 109.9 | 0.23 | 0.35 | 0.60 | 0.71 | |
| LRLL 55 | 157.0 | 0.65 | 0.58 | 0.78 | ||
| LRLL 67 | 194.3 | 0.74 | d | 0.42 | 5.03 | |
| LRLL 68 | … | … | … | … | … | 0.02e |
| LRLL 72 | 63.4 | 0.04 | 1.36 | 0.14 | 0.15 | |
| LRLL 133 | 30.3 | 0.93 | 0.73 | 0.06 | 0.12 | |
| Object | [Ne II] | [Ne III] | ||||
| Flux | Error | SNR | Flux | Error | SNR | |
| (10-15 erg cm-2 s-1) | (10-15 erg cm-2 s-1) | |||||
| CS Cha | 36.3 | 0.65 | 105 | 3.07 | 0.48 | 12 |
| FM 177 | 1.56 | 1.24 | ||||
| FM 281 | 1.89 | 1.40 | ||||
| FM 515 | 1.41 | 1.24 | ||||
| FM 581 | 2.05 | 0.73 | 5 | 1.29 | ||
| FM 618 | 1.82 | 0.73 | 4 | 1.37 | ||
| LRLL 2 | 7.95 | 1.13 | 12 | 5.52 | ||
| LRLL 6 | 5.20 | 2.72 | ||||
| LRLL 21 | 5.12 | 2.93 | ||||
| LRLL 31 | 6.22 | 3.46 | ||||
| LRLL 37 | 2.00 | 2.18 | ||||
| LRLL 55 | 2.16 | 1.58 | 6 | 2.91 | ||
| LRLL 67 | 2.83 | 0.91 | 8 | 1.72 | ||
| LRLL 68 | 2.10 | 1.25 | ||||
| LRLL 72 | 1.83 | 1.74 | ||||
| LRLL 133 | 2.91 | 1.90 | ||||
| SZ Cha | 16.2 | 1.96 | 14 | 22.0 | 2.72 | 11 |
| T 35 | 6.53 | 0.69 | 18 | 1.53 | ||
| T 54 | 6.15 | 1.20 | 7 | 2.11 | 0.66 | 6 |
| Target | [Ne II] | LX | LX |
|---|---|---|---|
| Detection | (ergs s-1) | Reference | |
| AA Tau | CN11* | 1.01030 | G10 |
| BP Tau | G10 | 1.41030 | G10 |
| CoKu Tau3 | G10 | 5.71030 | G10 |
| CS Cha | E12* | 3.81030 | I11 |
| DG Tau | G10 | 5.51029 | G10 |
| DK Tau | G10 | 8.41029 | G10 |
| DM Tau | E07 | 2.01030 | G10 |
| DO Tau | CN11* | 2.41029 | G10 |
| DoAr 25 | G10 | 2.81030 | G10 |
| EC 74 | G10 | 4.31030 | G10 |
| EC 82 | G10 | 9.21028 | G10 |
| EC 92 | G10 | 9.51030 | G10 |
| FM 581 | E12 | 5.61030 | E12 |
| FM 618 | E12 | 3.41030 | E12 |
| FS Tau A | B11 | 3.21030 | B11 |
| GI Tau | G10 | 6.71029 | G10 |
| GK Tau | G10 | 1.21030 | G10 |
| GM Aur | G10 | 1.61030 | G10 |
| GQ Lup | E12 | 7.41029 | G10 |
| Haro 1-4 | G10 | 4.11029 | W00 |
| Haro 1-16 | G10 | 1.31030 | G10 |
| Haro 1-17 | G10 | 5.81029 | G10 |
| IM Lup | G10 | 3.21030 | G10 |
| IP Tau | G10 | 6.11029 | I11 |
| IQ Tau | G10 | 3.21029 | G10 |
| IRAS 08267-3336 | G10 | 1.81031 | G10 |
| IRS 51 | G10 | 3.41030 | G10 |
| IRS 60 | G10 | 2.61029 | G10 |
| LkH 270 | G10 | 1.11031 | G10 |
| LRLL 2 | E12 | 3.51030 | E12 |
| LRLL 55 | E12 | 0.81030 | E12 |
| LRLL 67 | E12 | 5.01030 | E12 |
| PZ99 J161411 | G10 | 3.51030 | P07 |
| Rox 42C | G10 | 4.51030 | G10 |
| RU Lup | G10* | 1.01030 | G10 |
| RW Aur | CN11* | 1.61030 | B11 |
| RXJ1111.7-7620 | G10 | 3.61030 | P07 |
| RXJ1842.9-3542 | G10 | 2.31030 | P07 |
| RXJ1852.3-3700 | G10 | 3.71030 | P07 |
| SY Cha | G10 | 6.91029 | G10 |
| SZ Cha | E12 | 9.91029 | I11 |
| Sz 102 | L07 | 1.81029 | G10 |
| T Cha | G10 | 1.11030 | G10 |
| TW Hya | N10 | 2.11030 | G10 |
| T 54 | E12 | 8.01030 | I11 |
| UY Aur | CN11* | 4.01029 | G10 |
| VW Cha | G10 | 2.51030 | I11 |
| VZ Cha | G10 | 5.31029 | G10 |
| V773 Tau | B11 | 9.51030 | B11 |
| V836 Tau | G10 | 1.71030 | G10 |
| V853 Oph | G10 | 3.11030 | G10 |
| V4046 Sgr | S12 | 1.21030 | S12 |
| WX Cha | S12 | 4.61030 | G10 |
| XX Cha | G10 | 1.11030 | G10 |
Note. — For each target, the reference for the [Ne II] line detection is indicated and an asterisk indicates the source has a known jet. X-ray luminosities and relevant references are also listed. References are G10: Gudel et al. 2010; B11: Baldovin et al. 2011; CN11: Carr & Najita 2011; E12: this work; S12: Sacco et al. 2012; L07: Lahuis et al. 2007; N10: Najita et al. 2010; P07: Pascucci et al. 2007; I11: Ingleby et al. 2011; W00: White et al. 2000.