A search for 95 GHz class I methanol masers in molecular outflows
Abstract
We have observed a sample of 288 molecular outflow sources including 123 high-mass and 165 low-mass sources to search for class I methanol masers at 95 GHz transition and to investigate relationship between outflow characteristics and class I methanol maser emission with the PMO-13.7m radio telescope. Our survey detected 62 sources with 95 GHz methanol masers above 3 detection limit, which include 47 high-mass sources and 15 low-mass sources. Therefore the detection rate is 38% for high-mass outflow sources and 9% for low-mass outflow sources, suggesting that class I methanol maser is relatively easily excited in high-mass sources. There are 37 newly detected 95 GHz methanol masers (including 27 high-mass and 10 low-mass sources), 19 of which are newly identified (i.e. first identification) class I methanol masers (including 13 high-mass and 6 low-mass sources). Statistical analysis for the distributions of maser detections with the outflow parameters reveals that the maser detection efficiency increases with outflow properties (e.g. mass, momentum, kinetic energy and mechanical luminosity of outflows etc.). Systematic investigations of relationships between the intrinsic luminosity of methanol maser and the outflow properties (including mass, momentum, kinetic energy, bolometric luminosity and mass loss rate of central stellar sources) indicate a positive correlations. This further supports that class I methanol masers are collisionally pumped and associated with shocks, where outflows interact with the surrounding ambient medium.
1 Introduction
Methanol masers are widespread in our Galaxy, with more than 20 transitions in a wide frequency range from centimeter to millimeter discovered to date (Cragg et al., 2005). Their observed connections with other star formation activities (e.g., infrared dark clouds, millimetre and sub-millimetre dust continuum emissions and ultracompact (UC) Hii regions) made them one of the most effective tools to investigate star forming regions (e.g., Ellingsen, 2006). Their trigonometric parallaxes provide a direct and accurate measurement of distances to star formation regions wherein methanol masers reside (e.g., Xu et al., 2006; Rygl et al., 2010). Their multiple frequency transitions enable us to investigate the physical and chemical conditions of star forming regions (e.g., Leurini et al., 2004, 2007; Purcell et al., 2009), and evolutionary stages of star formation (e.g., Ellingsen et al., 2007; Chen et al., 2011, 2012).
Methanol masers can be divided into two classes (class I and II) according to the empirical classification on the basis of their different exciting locations (Batrla et al., 1987; Menten, 1991). Class I methanol masers are found usually offset (, nearly 1 pc at a distance of 4 Kpc) from the presumed origin of excitation, and can be further categorized to widespread class I methanol masers (e.g., 44 and 95 GHz) and rare or weak class I methanol masers (e.g., 9.9 and 104 GHz) (Voronkov et al., 2012). The rare or weak masers trace stronger shock regions which have higher temperatures and densities with regard to widespread masers (Sobolev et al., 2005; Voronkov et al., 2012). In contrast, class II methanol masers are often found to reside close to (within 1) high-mass young stellar objects (YSOs) (e.g., Caswell et al. 2010) and are frequently associated with UC Hii regions, infrared sources and OH masers. They also can be further categorized to widespread (e.g., 6.7 and 12.2 GHz) and rare (e.g., 19.9, 23.1 and 37.7 GHz) class II methanol masers (Ellingsen et al., 2011; Bartkiewicz & van Langevelde, 2012). Recently Ellingsen et al. (2011) found 37.7 GHz methanol masers (rare class II) related with most luminous 6.7 and 12.2 GHz sources and thus they suggested that the rare 37.7 GHz methanol masers are tracing more evolved sources and arise prior to the cessation of widespread class II methanol maser activity. The excitations of these two classes of masers depend on two different pumping mechanisms: the pumping mechanism of class I masers is dominated by collisions with molecular hydrogen, whereas class II masers are pumped by external far-infrared radiation (e.g., Cragg et al., 1992; Voronkov, 1999; Voronkov et al., 2005). There is a competition between the two mechanisms since strong radiation from a nearby infrared source suppresses class I masers but strengthens class II masers (see Voronkov et al. (2005) for details). Surveys of class II methanol masers found that they only exist in high-mass star forming regions (Minier et al., 2003; Ellingsen, 2006; Xu et al., 2008); while class I methanol masers have been detected not only in high-mass star forming regions, but also in low-mass star forming regions (Kalenskii et al., 2006, 2010).
Many surveys of methanol masers have been carried out in last four decades. The surveys of class II methanol masers (mainly at 6.7 GHz transition) have detected nearly 900 sources to date (e.g., Pestalozzi et al., 2005; Pandian et al., 2007; Xu et al., 2008, 2009; Cyganowski et al., 2009; Green et al., 2009, 2010, 2012; Caswell et al., 2010, 2011). While studies and surveys of class I methanol masers are rare compared to class II methanol masers surveys. There are only a few single-dish surveys (e.g., Haschick et al., 1990; Slysh et al., 1994; Val’tts et al., 2000; Ellingsen, 2005) as well as interferometric searches (e.g., Kurtz et al., 2004; Cyganowski et al., 2009). However class I masers have recently become the focus of more intensive research (e.g., Sarma & Momjian, 2009, 2011; Fontani et al., 2010; Kalenskii et al., 2010; Voronkov et al., 2010a, b, 2011; Chambers et al., 2011; Chen et al., 2011, 2012; Fish et al., 2011; Pihlström et al., 2011). Some surveys have been carried out at the rare maser transitions, e.g., at 9.9 GHz by Voronkov et al. (2010a) and 23.4 GHz by Voronkov et al. (2011). To date altogether 300 class I methanol maser sources have been detected in our Galaxy (see Chen et al., 2011, 2012, for details).
Earlier observations of class I methanol masers (e.g., Plambeck & Menten, 1990; Kurtz et al., 2004) had found that class I methanol masers located at the interface regions between outflows and interstellar medium, suggesting that locations associated with outflows may be one of the best target sites for class I maser search. Statistical analysis by Chen et al. (2009) found that 67% of outflow sources including millimeter line molecular outflows (cataloged by Wu et al. 2004) and EGOs, are associated with the class I methanol maser (at 95 GHz and 44 GHz) within 1′. The EGOs are identified from Infra Red Array Camera (IRAC) images in the 4.5 m band, which is thought to be a powerful outflow tracer and produced by shock-excited of H2 and CO (Cyganowski et al., 2008). A follow-up systematic survey towards a nearly complete EGO sample (192 sources) with the Australia Telescope National Facility (ATNF) Mopra 22-m radio telescope done by Chen et al. (2011) has detected 105 new 95 GHz class I methanol masers, thus supporting a high detection rate (55%) of 95 GHz methanol masers towards EGOs. In this paper we mainly focus on 95 GHz class I methanol maser searches in another outflow cataloged sample included in the statistical analysis of Chen et al. (2009) – the outflow sources identified from millimeter molecular spectral lines cataloged by Wu et al. (2004) to check whether these millimeter molecular outflows have also indeed a high detection rate of class I methanol maser as expected in Chen et al. (2009). In addition, although the spatial distribution relationship between class I methanol masers and outflows has been investigated by a series of mapping observations (e.g., Johnston et al., 1997; Sandell et al., 2003, 2005), most of these observations only confirmed their spatial connections. The statistical studies of their physical relationships (e.g., methanol luminosity and outflow properties) are still absent. So it is also necessary to perform a systematical search for class I methanol masers (e.g., 95 GHz) in outflow sources to investigate the physical dependences between outflows and the masers.
In this paper we report our result from the survey of 95 GHz class I methanol maser toward the outflow sources selected from Wu et al. (2004) outflow catalog. We describe our sample selection and observation in 2. In 3, we present our results of class I methanol maser detections. We discuss methanol maser detections with outflow parameters and the relationships between outflow parameters and maser luminosity in 4. The conclusion is summarized in 5.
2 OBSERVATION
2.1 Sample Selection
Our sample sources are selected from Wu et al. (2004), which cataloged a list of molecular outflow sources (400), identified from millimeters molecular lines, along with their outflow parameters. These sources are compiled mainly on the basis of mapping observations of CO at low transitions ( and ), showing evidence of large scale red- and blue-lobes. We choose the sources with Dec. -10 degrees, which can be accessible to the Purple Mountain Observatory (PMO) 13.7-m telescope, and exclude sources with 95 GHz class I methanol maser observed before the observing epoch, which included in the statistical study of Chen et al. (2009). A total of 288 molecular outflow sources were selected for our survey. The sample includes 123 high-mass and 165 low-mass sources according to their available bolometric luminosity or outflow mass. Wu et al. (2004) pointed out that the high-mass sources have bolometric luminosity of larger than (for sources with bolometric luminosity calculated) or outflow mass of larger than 3 (for sources without bolometric luminosity calculated), the others below these limits are classified as low-mass sources. Their different mass ranges are very helpful for comparing the 95 GHz class I methanol maser detections and the relationships between outflow properties and methanol masers. However, such classification for high- and low-mass sources may not be reliable for some cases. We will discuss this in Section 4.4.
2.2 Observation and Data Reduction
Single-point observations of 95 GHz class I methanol maser toward the selected 288 sources were made in a period from 2010 June to 2010 September with the PMO 13.7-m telescope in Delingha, China. The rest frequency of the observed transition is set to 95.169463 GHz. The half-power beamwidth of the telescope is about , and the pointing rms is better than during the observations. A cooled SIS receiver working in the 80115 GHz band was used and the system temperature was about 180250 K, depending on weather conditions. The spectra were recorded with an Acousto-Optical Spectrometer (AOS) backend which has 1024 channels, 42 KHz for each channel and a total bandwidth of 42.7 MHz, resulting in a velocity resolution of 0.13 and total velocity coverage of 135 . The observations were performed in position-switch mode with off positions offset from targeted point (no emission was found in each off position). The aperture efficiency of the telescope is 60%, which implies that 1 K of antenna temperature () corresponds to 31 Jy in flux density scale. The observation was firstly carried out with an integrated time of 30 minutes for each source (achieving a typical rms noise level of 1.2 Jy), and then extend integration time (typical integration time is 60 minutes, resulting in a typical rms of 0.9 Jy) for the potential weak sources.
The spectral data were reduced and analyzed with the GILDAS/CLASS package. A first-order polynomial baseline subtraction was performed for the majority of the observed sources, but for sources with no good solutions from the first-order polynomial fits, we carried out a second (or third)-order polynomial baseline subtraction. After such a baseline removed, Hanning smoothing was applied to obtain the spectra with a velocity resolution of 0.22 km s-1. Frequently the detected 95 GHz methanol spectra do not exactly show a particularly Gaussian profile, possibly due to that multiple maser features within a similar velocity range confuse the spectra. However, each maser feature contributing to the complex spectra often shows a single Gaussian profile. Thus, to characterize the spectral characteristics of the total emission, we have performed Gaussian fitting to each feature for each detected source.
3 RESULT
We have detected a total of 62 sources with 95 GHz methanol maser emission flux above 3. A summary is given in Table 1. The references which were used to catalog newly-identified class I methanol maser and 95 GHz methanol maser are presented in Table 2 & 3. These references include almost all the known class I methanol maser surveys (including 36 GHz, 44 GHz and 95 GHz) to date. By cross-matching our detections with the previously known-detected methanol masers from above references within a spatial scale of 1′, we found 37 newly-detected 95 GHz methanol maser sources. And among them 19 are newly identified as class I methanol maser sources, i.e. the first identification of a class I maser transition associated with these objects. This further increases the sample of class I methanol maser, adding up to nearly 300 class I methanol maser sources (see Chen et al., 2011, 2012). Appendix A gives the undetected sources along with their 1 rms noise, which have a range from 0.3 to 2.8 Jy, depending on integration time and weather condition (a typical rms is 1 Jy).
3.1 High-mass sources
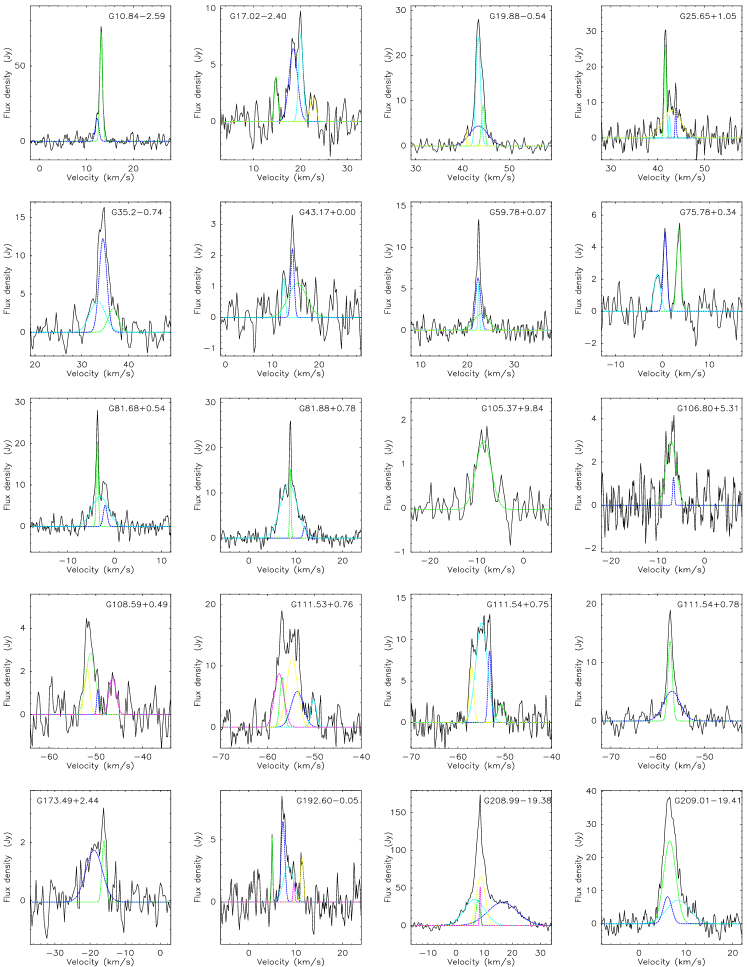
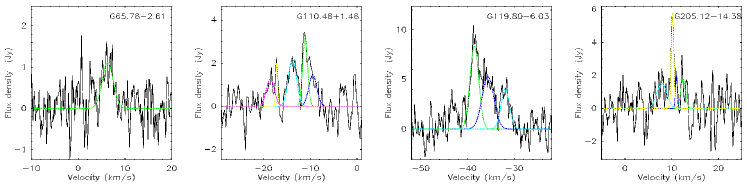
Our observations find 47 high-mass sources with 95 GHz methanol masers above a detection limit of 3, which include 27 newly-detected 95 GHz methanol masers and 13 of them are newly-identified class I methanol masers. A list of the detected 95 GHz methanol masers along with their Gaussian fitting parameters in high-mass sources are presented in Table 2, which includes three sub-tables: (a) sources had 95 GHz class I methanol masers detected previously; (b) sources detected at 95 GHz class I methanol masers in the first time; (c) sources detected only at 95 GHz class I methanol masers so far (i.e. Newly-identified class I methanol masers). We also listed information as to whether the detected class I methanol masers are associated with class II methanol masers or not in the table. Note that we only use the catalog of 6.7 GHz class II methanol masers for which accurate positions (better than 1′′) have been published (Xu et al., 2009; Caswell, 2009; Caswell et al., 2011; Green et al., 2010, 2012) in the cross-match. There are 13 sources which are found to be associated with class II methanol masers within the measured figure of the outflow region in the 47 detected high-mass sources. Figure 1 shows the detected 95 GHz methanol maser spectra and the fitted Gaussian profiles with different color lines representing different fitted components for these sources. The figure also shown in three sub-figures according to whether sources had 95 GHz or other class I methanol masers detected previously. The total integrated intensities of 95 GHz methanol maser range from 3.5 to 1070 with a mean of 47 for high-mass sources.
3.2 Low-mass sources
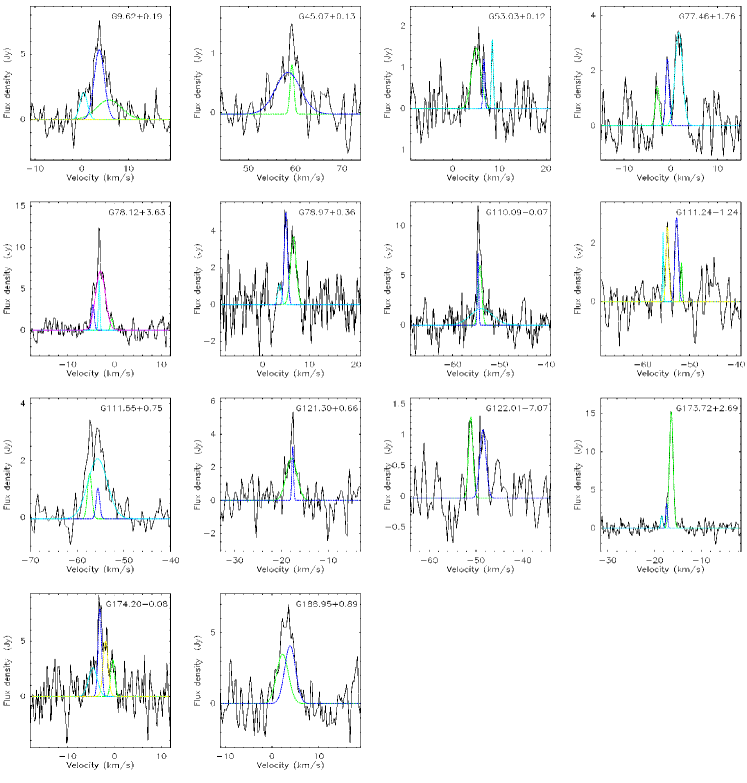
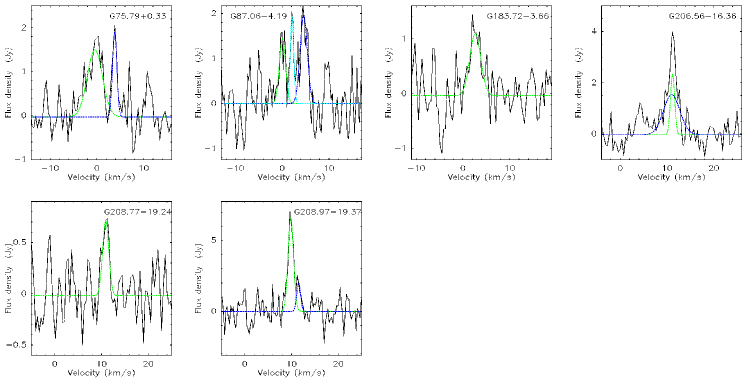
There are 15 sources which have 95 GHz methanol maser emission detected with flux density above 3 in the low-mass sample. Among them, 10 sources are newly-detected 95 GHz methanol masers and 6 are newly identified as class I methanol masers. The detected 95 GHz methanol masers along with their Gaussian fitting parameters for low-mass sources are listed in Table 3, which is also subdivided into three sub-tables according to whether sources had 95 GHz or other class I methanol masers detected previously. We also listed information as to whether the detected 95 GHz methanol maser sources are associated with class II methanol masers or not in the table in the same approach as high-mass sources (see section 3.1). There is only one source (G206.54-16.36, we will discuss this source in Section 4.4) which is found to be associated with high accurate position class II methanol masers in the 15 detected sources (see Table 3). The detected 95 GHz spectra and fitted Gaussian profiles for these low-mass sources are presented in Figure 2 and also including three sub-figures as high-mass counterpart. The total integrated intensities of 95 GHz methanol maser range from 1.3 to 45.5 with a mean of 12 for the low-mass sources.
Therefore the maximal methanol intensity in high-mass sources is nearly 24 times than that in low-mass sources, while the minimal methanol intensity in high-mass source is 3 times that in low-mass sources. The average intensity in high-mass sources is nearly 4 times larger than that in low-mass sources.
4 DISCUSSION
4.1 Detection Rates
A total of 62 sources have been detected 95 GHz methanol masers toward a sample of 288 outflow sources, giving a detection rate of 22% (62/288) for our survey. Out of 62 detections, 47 sources are high-mass sources, thus a detection rate of 38% (47/123) for high-mass sources. The remaining 15 belong to low-mass sources, thus a detection rate of 9% (15/165) for low-mass sources. However the actual detections/detection rates of methanol masers may be affected by the following factors: 1) it can be clearly seen from Figures 1 and 2 that only one single broad (and weak) Gaussian profile was detected toward a number of sources (including G70.29+1.60, G79.88+2.55, G105.37+9.84, G111.25-0.77, G173.58+2.44 and G213.70-12.60 in high mass source sample, and G65.78-2.61, G183.72-3.66 and G208.77-19.24 in low mass source sample). We can not determine whether they are thermal emission, or one or more maser spectral features appending together from our current single dish observations, although earlier high resolution observations to the similar broad emission profiles showed that they are usually masers, e.g, at 95 GHz (Voronkov et al., 2006), and 44 GHz (Cyganowski et al., 2009; Voronkov et al., 2010b); 2) it should be noted that some detected methanol masers are located within the PMO-13.7 m beam (e.g., high-mass sources G111.53+0.76, G111.54+0.75 and G111.55+0.75 have angular separations within 30′′; low-mass sources G205.10-14.39 and G205.12-14.38 have angular separations of ; low-mass source G206.56-16.36 and high-mass source G206.57-16.36 have angular separations of ). If these nearby masers are only excited by the same one source, the total detection rate would be 20% (58/284; out of these 58 detections, 45 sources are high-mass sources, resulting in a detection of 45/121=37%; the remaining 13 sources belong to low-mass group, thus a detection rate of 13/163=8%). However, these nearby detected masers show different spectral profiles, suggesting that they may be excited by different driving sources; 3) the detection rate may be affected by the possible extended spatial distribution of class I methanol masers arising from sources with larger scale outflows (some sources listed in Wu et al. (2004) catalog show larger scale outflows extending to several arc minutes). Therefore there is a possibility that the detected maser emissions in one source may actually originate from nearby sources with extended outflows to several arc minutes along the line-of-sight. All above factors would only be clarified with further higher resolution observations, but these factors would not bring too much changes to the actual detection rates. So we keep the methanol maser detection rates derived from the current single dish observations in the following subsequent discussions.
Interestingly, the detection rate of 22% for the full observing sample is in number nearly consistent with the finding of Val’tts & Larionov (2007), which derived that 25% of mm molecular line outflows were associated with class I masers including 36 GHz, 44 GHz and 95 GHz within 2′ from a statistical analysis. However it is significantly lower than that expected from the statistical analysis of Chen et al. (2009) for the Wu et al. (2004) outflow catalog. They have analyzed 34 outflow sources from the Wu et al. (2004) catalog which have been included in previous four class I methanol maser surveys (including the 44 GHz transition by Slysh et al. (1994) and Kurtz et al. (2004); and the 95 GHz transition by Val’tts et al. (2000) and Ellingsen (2005)). They found that 23 sources are associated with one or both of the 95 and 44 GHz class I methanol masers within 1′, thus the expected detection rate of class I masers in Wu et al. (2004) outflow catalog is 67% at this resolution. An actual lower detection rate was achieved in the majority (288/400) of the cataloged outflow sources may be due to that previous statistical study is subject to influences produced by the target selection effects as followings: 1) only a small size sample which includes 34 outflow sources was used in the statistical study; 2) in previous four class I methanol maser surveys used in the study most of target samples were pointed to UC Hii regions, class II masers and known class I maser sources; 3) the majority (29/34) of sample used in previous analysis is high-mass sources which usually show high detection rate of class I maser with regard to low-mass sources (for example 38% vs. 9% in our observations, we will discuss them in more details later); 4) previous statistical analysis combined 44 and 95 GHz class I maser searches, and emission from the 44 GHz transition is generally 3 times stronger than that at 95 GHz (Val’tts et al., 2000), thus the search for methanol masers only at 95 GHz transition is likely to have a lower detection rate than at 44 GHz or both 44 and 95 GHz transitions under comparable sensitivity. Combining these it is not surprising for an overestimated detection rate of class I methanol maser from previous statistical study.
Comparing the detection rate of 95 GHz class I methanol maser (55%) achieved toward nearly complete EGOs ( 200) with the Mopra telescope by Chen et al. (2011), we found that the actual detection rate (of 22%) of our 95 GHz class I masers in the full observing outflow sample is also lower than that in the EGO sample. However, EGOs trace a population of high-mass young stellar objects with ongoing outflow activities. If only considering high-mass outflow sources in our sample, the detection rate of 95 GHz class I maser of 38% for them is still smaller than that of 55% for EGOs. The difference between them is mainly due to the different detection sensitivities in the two surveys: the typical detection sensitivity of 3 Jy (3) in our observations is about two times that of 1.6 Jy (3) in the Chen et al. (2011) EGO surveys. To check this, we re-examined the detected maser sources in the Chen et al. (2011) EGO surveys. When we excluded the sources (24 in total) with maser peak flux density of less than 3 Jy from the detected sources in the EGO survey, we found the detection rate is 81/19242%, which is nearly consistent with that achieved for Wu et al. (2004) outflow catalog in this work at same sensitivity. This also suggests that the EGOs have similar properties to outflow sources traced by millimeter molecular lines from the view of their correlation with 95 GHz class I methanol masers.
Note that our detection rate in low-mass sources is consistent with that reported by Kalenskii et al. (2010), which detected four sources (NGC 1333I2A, NGC 1333I4A, HH25MMS, and L1157) at 44 GHz, and one source (NGC 2023) at 36 GHz in a total of 44 low-mass outflow sources, resulting in a detection rate of 11%. Although the low-mass sources are closer to us than high-mass sources on average, the detection rate and flux of methanol maser in low-mass sources are lower than that in high-mass counterparts on average in our observations. This suggests that the high-mass sources have a higher outflow power than low-mass sources, which could cause a higher collisional efficiency between methanol molecule and surrounding clouds than low-mass sources (see below).
4.2 Detection rates with outflow parameters
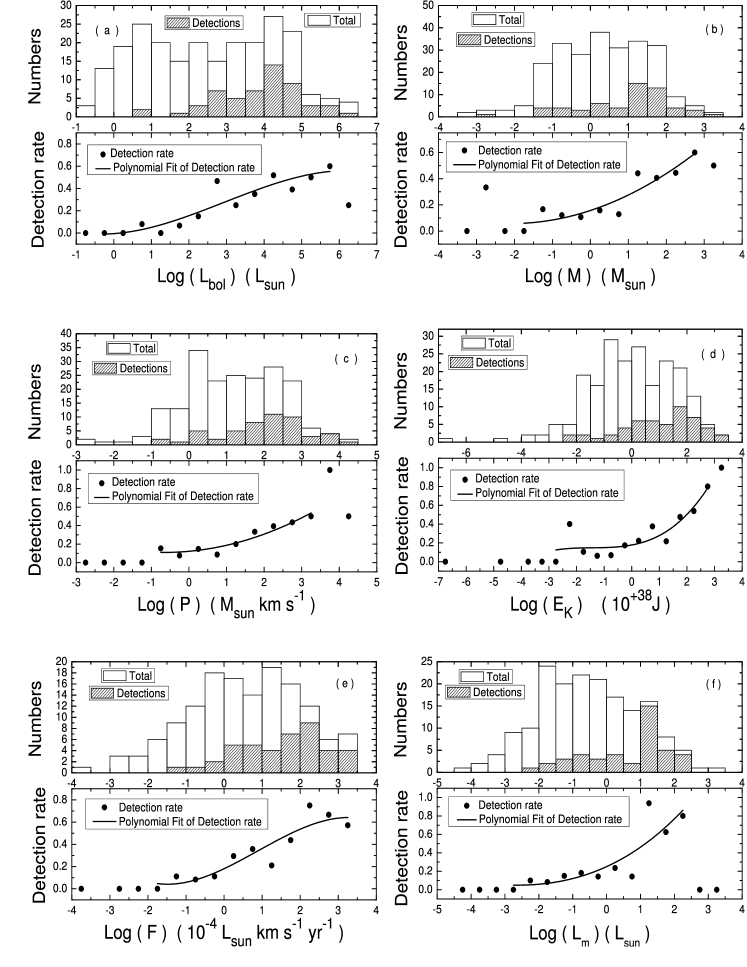
There are a series of outflow parameters including bolometric luminosity of driving sources (), outflow mass (), momentum of outflows (), kinetic energy of outflows (), force derived from outflow (), mechanical luminosity of outflows (), mass loss rate of central stellar sources () and dynamic time () associated with outflows etc, presented in Wu et al. (2004). We performed a series of investigations on maser detections with each of the outflow parameters. Histogram showing the detection rate of class I methanol masers as a function of the bolometric luminosity of driving sources (), outflow mass (), momentum of outflows (), kinetic energy of outflows (), force derived from outflows (), mechanical luminosity of outflows (), are presented in (a)–(f) of Figure 3, respectively. We adopt the mean value for parameters which have been given more than one values in Wu et al. (2004) in the analysis. The total sources and detected sources are presented with different shapes in top panel of each diagram. The bottom panel in each diagram denotes the corresponding detection rate with the outflow properties. The corresponding detection rate in each bin is represented by black dot and a low order polynomial fit for the detection rates is marked with solid line (only fitted for the data points with total observed source number larger than 5). All panels presented in Figure 3 show a clear tendency that the detection rates of 95 GHz methanol maser increase with the increment of outflow properties. With the increments of outflow properties (e.g., outflow mass, momentum of outflows, kinetic energy of outflows), much more materials would be ejected in form of outflows, which would compress parent clouds and increase methanol abundance, resulting in increasing collision between methanol molecule and surrounding medium (mainly H2) and stimulating methanol molecule to higher energy levels. These processes would ultimately cause a brighter maser excitation (we will discuss this further in Section 4.3), making it more easily to be detected in sources with higher outflow parameter values.
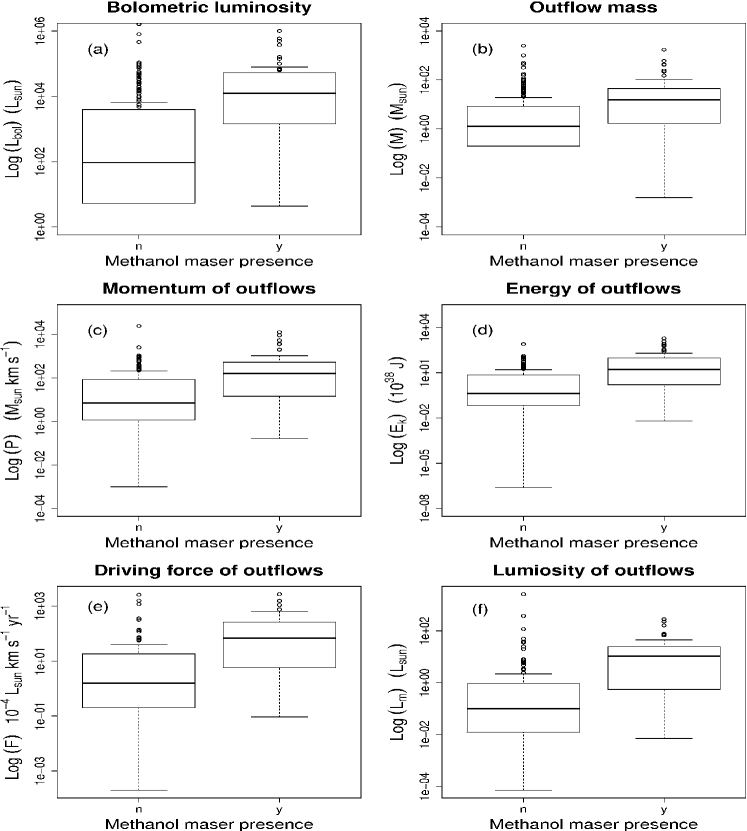
The methanol maser detection rates are related with outflow properties from above analysis. We plot box plot to show the significance of each outflow properties associated with methanol maser presence, similar to the approach used in Breen et al. (2007, 2011). Figure 4 shows result of box plot of the methanol maser presence in consideration of outflow properties, which can be divided into two categories of ‘n’ and ‘y’, corresponding to those not related with methanol maser, and those related with methanol maser. It can be clearly seen that the sources with maser detected have a higher (larger) range of outflow properties than the sources without maser detected. It suggests that these outflow properties could play important roles in predicting methanol maser presence. Methanol masers can be more easily detected in sources with higher outflow properties than in those with lower outflow properties relatively. This is consistent with above detection rate analysis.
4.3 Class I methanol maser emission with outflow properties
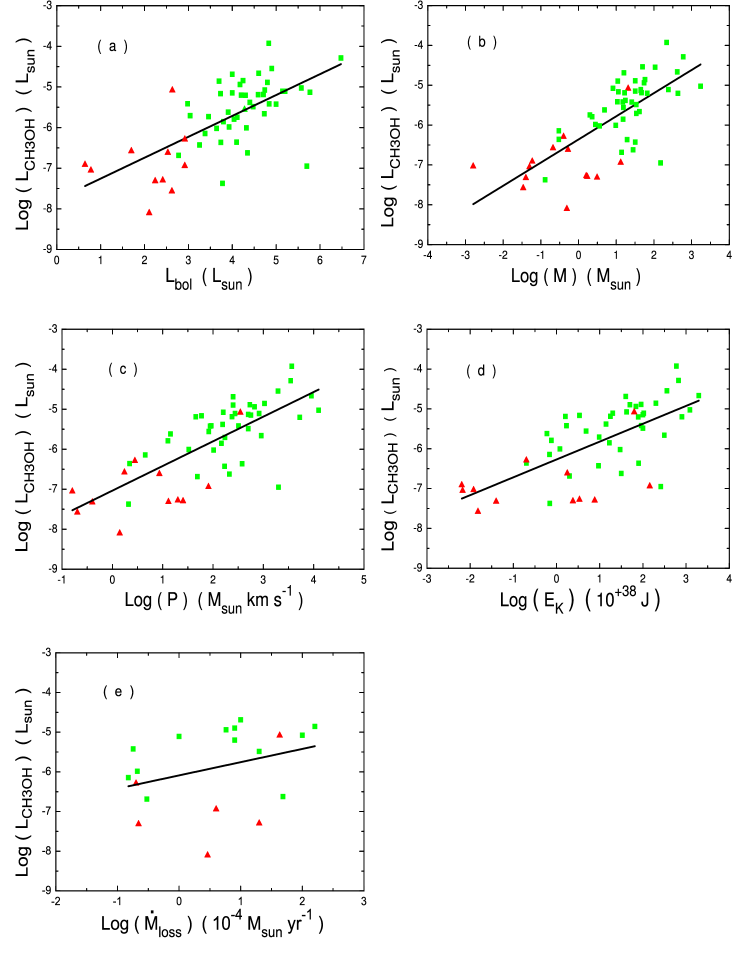
The statistical studies of correlations between outflow properties and class I methanol maser emission based on a large sample are crucial for investigating the physical relationship between class I methanol masers and outflows. It could be an important complement to mapping observations (e.g., Plambeck & Menten, 1990; Kurtz et al., 2004; Voronkov et al., 2006; Cyganowski et al., 2009) – the mapping observations were only made for limited size sample, and they only present the spatial associations between class I methanol masers and outflows at present. We have detected a large number of 95 GHz methanol masers (62 in total) toward molecular outflow sources in our observations. Most of the detected sources were provided with the outflow properties in Wu et al. (2004) catalog. All of them decide that our observations are very suitable for such a statistical study. We performed a series of analysis for the correlations between intrinsic luminosities of detected methanol maser and outflow properties. The luminosities of methanol maser can be calculated with , where is the intrinsic luminosity of methanol maser, is the total integrated intensity of 95 GHz methanol masers estimated from Gaussian fitting, is the distance to outflow source. The result indicates that there is significant correlation between methanol maser intrinsic luminosity and outflow properties including bolometric luminosity of central source (), outflow mass (), momentum of outflows (), mechanical luminosity of outflows (). We show the log–log distributions of methanol maser luminosity versus these four outflow properties in Figure 5 (a) – (d). The green squares and red triangles in each panel of this figure represent high-mass sources and low-mass sources, respectively. The black solid line in each panel denotes the best linear fit for each distribution. We give the best fitting results in Table 4. From this figure, we can clearly see that most of high-mass sources reside at top right place in each panel, with higher outflow properties and more luminous methanol masers, whereas low-mass sources locate at the bottom left place, with lower outflow properties and less luminous methanol masers. The correlation coefficients for all these four relationships are larger than 0.66, suggesting that strong correlations exist between 95 GHz methanol maser luminosity and these outflow properties. This is consistent with the theoretical expectation. The protostar ejects materials in form of outflows, which squeeze clouds surrounding the protostar. The generated shock propagating through high density medium would stimulate methanol formation (Wirström et al., 2011) and enhance methanol abundance (e.g., Gibb & Davis, 1998; Garay et al., 2002; Voronkov et al., 2010b). These effects combined would increase the collision efficiency of methanol molecule with surrounding clouds and raise up the pumping efficiency of class I methanol masers. As high-mass sources have higher outflow power than low-mass sources, a brighter methanol maser would not be unexpected to excite in high-mass sources. Our result for the correlation between maser luminosity and bolometric luminosity of outflow driving source is also comparable to the finding of Bae et al. (2011). They also demonstrated that there is a correlation between bolometric luminosity of outflow driving source and isotropic luminosity of only twelve 44 GHz methanol maser sources detected in 180 intermediate-mass star forming regions, with a correlation coefficient of 0.72.
The mass loss rate of central stellar sources directly reflect the ejected materials from the central objects per unit time. So the relationship between mass loss rate and class I methanol maser luminosity is essential to interpret the dependence between methanol masers and outflows. However, there are only a few sources in our sample with mass loss rate of central stellar source estimates presented by Wu et al. (2004), so there shows a poor correlation between them. We plot relationship between intrinsic luminosity of 95 GHz methanol maser and mass loss rate of central stellar sources in panel (e) of Figure 5. The best linear fitting result for this dependence is also listed in Table 4. Its correlation coefficient is 0.33 due to the small size of the sample. But it also shows the similar tendency to the other four outflow properties discussed above, that the intrinsic luminosity of methanol maser increases with the increment of mass loss rate of central stellar sources (i.e., the flux of methanol maser is proportional to mass loss rate of central stars in logarithm). This may further support that class I methanol masers are collisionally excited, under which with increment of outflow efficiency (e.g., outflow properties), the phenomenon (e.g., shock) triggering methanol population inversion is boosted up and hence more methanol excitations appear.
4.4 Low-mass sources
Studies of methanol maser in low-mass sources are an effective and direct method in explaining the properties of methanol masers, because the majority of detected low mass sources are closer to us than high-mass sources. To date a total of 14 low-mass sources have class I methanol masers detected including in one or more transitions from 36 GHz, 44 GHz or 95 GHz. We list the previously known class I methanol maser detections in low-mass sources in Table 5. Among them, 8 sources have also been detected in our 95 GHz class I methanol maser survey (see Table 5). Note that the previously detected source G205.11-14.38 is close to the two sources G205.10-14.39 and G205.12-14.38 detected in our survey, with a separation of 20′′ to each of the two sources respectively. It means the previous detected source is located within the PMO-13.7 m beam of our detected two sources. Thus we suggest that the two sources detected in our survey had class I methanol masers detected previously. Our observations have found another 6 new class I methanol masers at 95 GHz in low-mass sources, a significant increase in the low-mass sample size. This also confirms the existence of class I methanol maser in low-mass star formation regions.
However we should note that the classifications of the high-mass and low-mass sources on the basis of bolometric luminosity of the centeral source or outflow mass proposed by Wu et al. (2004) may not be exact for some cases. For example, the source G206.54-16.36 was classified as low-mass sources due to its low outflow mass (0.04 M⊙) according to Wu et al. (2004). But a 6.7 GHz class II methanol maser which is exclusive tracer of high-mass star-formation has been detected in this source, suggesting that it should be a high-mass rather than low-mass star forming region. Therefore part of low-mass sources classified by Wu et al. (2004) may not truly correspond to the regions wherein only low-mass star forms. On the other hand, some theories have proposed that high-mass star formation regions may evolve from low-mass star formation regions (e.g., Arce et al., 2007). If considering the above possible evolutionary effects, our observed different mass type sources can be seen to locate at different evolutionary stages. Our results shows that the detection rate of 95 GHz class I methanol maser in high-mass sources are 4 times larger than that in low-mass sources, meaning that the detection rate in more evolved sources (i.e. high-mass regions) are also 4 times larger than that in less evolved sources (i.e. low-mass regions). This conclusion is consistent with Fontani et al. (2010) which cataloged a total of 88 sources and classified them into two groups including Low sources and High sources according to their IRAS colours. The Low sources are younger than the High sources according to their criteria. Their result shows the detection rate of class I methanol masers in High sources are nearly 3 times (2.9 times for 44 GHz and 3.3 times for 95 GHz methanol masers) than that in Low sources. This also supports that more evolved sources are more easily detected class I methanol maser than less evolved sources during evolutionary stage of star formation. That is, with the source evolving from low-mass to high-mass, the pumping efficiency also increases and hence a brighter class I methanol maser is excited. Therefore as to whether the class I masers detected in low-mass sources in our observations are truly associated low-mass forming stars, we can not completely exclude effects from the inaccurate mass-type classifications and possible evolutionary effects from low-mass to high-mass.
5 SUMMARY
A systematic survey of 95 GHz class I methanol masers was performed towards 288 molecular outflow sources including 123 high- and 165 low-mass sources selected from Wu et al. (2004) outflow catalog with the PMO-13.7 m telescope. We detected 62 sources with 95 GHz class I maser above a detection limit of 3 , which include 47 high-mass sources and 15 low-mass sources. This suggests that the detection rate of high-mass sources is 38% and low-mass sources is 9%. The detection rate in high-mass sources is nearly 4 times that in low-mass sources, suggesting that 95 GHz class I methanol masers are easily excited in high-mass sources. There are 37 newly detected 95 GHz methanol maser sources (including 27 high-mass sources and 10 low-mass sources), and 19 of them are newly detected class I methanol maser sources (including 13 high-mass sources and 6 low-mass sources). This further increases the number of the known class I methanol masers (adding on top of the previous 300 class I maser sources) in our Galaxy. We performed statistical analysis for the distribution of detection rates with outflow properties. It shows a clear tendency that the distributions of methanol maser detection rates increase with the increment of outflow properties including outflow mass, momentum of outflows, kinetic energy of outflows, bolometric luminosity of central source, mechanical luminosity of outflows and force derived from outflows. Analysis of the relationship between intrinsic luminosity of methanol masers and outflow properties show that intrinsic luminosity of methanol masers is logarithmically proportional to outflow mass, momentum of outflows, kinetic energy, and, bolometric luminosity and mass loss rate from central stellar sources. This is in accord with the pumping mechanism (collisionally excited) of class I methanol masers and confirms the physical connections of methanol masers and outflows.
Acknowledgments
We are grateful to the staff of Qinghai Station of Purple Mountain Observatory for their help during the observations. This work is partly supported by China Ministry of Science and Technology under State Key Development Program for Basic Research (2012CB821800), the National Natural Science Foundation of China (grants 10621303, 10625314, 10803017, 11121062, 10921063, 11073041, 11073054, 11133008, 11173046 and 11273043), the CAS/SAFEA International Partnership Program for Creative Research Teams, and Key Laboratory for Radio Astronomy, CAS.
References
- (1)
- Arce et al. (2007) Arce, H. G., Shepherd, D., Gueth, F., et al. 2007, Protostars and Planets V, 245
- Bae et al. (2011) Bae, J.-H., Kim, K.-T., Youn, S.-Y., et al. 2011, ApJS, 196, 21
- Bartkiewicz & van Langevelde (2012) Bartkiewicz, A., & van Langevelde, H. J. 2012, IAU Symposium, 287, 117
- Batrla et al. (1987) Batrla, W., Matthews, H. E., Menten, K. M., & Walmsley, C. M. 1987, Nature, 326, 49
- Breen et al. (2007) Breen, S. L., Ellingsen, S. P., Johnston-Hollitt, M., et al. 2007, MNRAS, 377, 491
- Breen et al. (2011) Breen, S. L., Ellingsen, S. P., Caswell, J. L., et al. 2011, ApJ, 733, 80
- Caswell (2009) Caswell, J. L. 2009, PASA, 26, 454
- Caswell et al. (2010) Caswell, J. L., Fuller, G. A., Green, J. A., et al. 2010, MNRAS, 404, 1029
- Caswell et al. (2011) Caswell, J. L., Fuller, G. A., Green, J. A., et al. 2011, MNRAS, 417, 1964
- Chambers et al. (2011) Chambers, E. T., Yusef-Zadeh, F., & Roberts, D. 2011, ApJ, 733, 42
- Chen et al. (2009) Chen, X., Ellingsen, S. P., & Shen, Z.-Q. 2009, MNRAS, 396, 1603
- Chen et al. (2011) Chen, X., Ellingsen, S. P., Shen, Z.-Q., Titmarsh, A., & Gan, C.-G. 2011, ApJS, 196, 9
- Chen et al. (2012) Chen, X., Ellingsen, S. P., He, J.-H., et al. 2012, ApJS, 200, 5
- Cragg et al. (1992) Cragg, D. M., Johns, K. P., Godfrey, P. D., & Brown, R. D. 1992, MNRAS, 259, 203
- Cragg et al. (2005) Cragg, D. M., Sobolev, A. M., & Godfrey, P. D. 2005, MNRAS, 360, 533
- Cyganowski et al. (2008) Cyganowski, C. J., Whitney, B. A., Holden, E., et al. 2008, AJ, 136, 2391
- Cyganowski et al. (2009) Cyganowski, C. J., Brogan, C. L., Hunter, T. R., & Churchwell, E. 2009, ApJ, 702, 1615
- Ellingsen (2005) Ellingsen, S. P. 2005, MNRAS, 359, 1498
- Ellingsen (2006) Ellingsen, S. P. 2006, ApJ, 638, 241
- Ellingsen et al. (2007) Ellingsen, S. P., Voronkov, M. A., Cragg, D. M., et al. 2007, IAU Symposium, 242, 213
- Ellingsen et al. (2011) Ellingsen, S. P., Breen, S. L., Sobolev, A. M., et al. 2011, ApJ, 742, 109
- Fish et al. (2011) Fish, V. L., Muehlbrad, T. C., Pratap, P., et al. 2011, ApJ, 729, 14
- Fontani et al. (2010) Fontani, F., Cesaroni, R., & Furuya, R. S. 2010, A&A, 517, A56
- Garay et al. (2002) Garay, G., Mardones, D., Rodríguez, L. F., Caselli, P., & Bourke, T. L. 2002, ApJ, 567, 980
- Gibb & Davis (1998) Gibb, A. G., & Davis, C. J. 1998, MNRAS, 298, 644
- Green et al. (2009) Green, J. A., Caswell, J. L., Fuller, G. A., et al. 2009, MNRAS, 392, 783
- Green et al. (2010) Green, J. A., Caswell, J. L., Fuller, G. A., et al. 2010, MNRAS, 409, 913
- Green et al. (2012) Green, J. A., Caswell, J. L., Fuller, G. A., et al. 2012, MNRAS, 420, 3108
- Haschick et al. (1990) Haschick, A. D., Menten, K. M., & Baan, W. A. 1990, ApJ, 354, 556
- Johnston et al. (1997) Johnston, K. J., Gaume, R. A., Wilson, T. L., Nguyen, H. A., & Nedoluha, G. E. 1997, ApJ, 490, 758
- Kalenskii et al. (1994) Kalenskii, S. V., Liljestroem, T., Val’tts, I. E., et al. 1994, A&AS, 103, 129
- Kalenskii et al. (2001) Kalenskii, S. V., Slysh, V. I., Val’tts, I. E., Winnberg, A., & Johansson, L. E. 2001, Astronomy Reports, 45, 26
- Kalenskii et al. (2006) Kalenskii, S. V., Promyslov, V. G., Slysh, V. I., Bergman, P., & Winnberg, A. 2006, Astronomy Reports, 50, 289
- Kalenskii et al. (2010) Kalenskii, S. V., Johansson, L. E. B., Bergman, P., Kurtz, S., Hofner, P., Walmsley, C. M., & Slysh, V. I. 2010, MNRAS, 405, 613
- Kurtz et al. (2004) Kurtz, S., Hofner, P., & Álvarez, C. V. 2004, ApJS, 155, 149
- Larionov et al. (1999) Larionov, G. M., Val’tts, I. E., Winnberg, A., et al. 1999, A&AS, 139, 257
- Larionov & Val’tts (2007) Larionov, G. M., & Val’tts, I. E. 2007, Astronomy Reports, 51, 756
- Leurini et al. (2004) Leurini, S., Schilke, P., Menten, K. M., et al. 2004, A&A, 422, 573
- Leurini et al. (2007) Leurini, S., Schilke, P., Wyrowski, F., & Menten, K. M. 2007, A&A, 466, 215
- Liechti & Wilson (1996) Liechti, S., & Wilson, T. L. 1996, A&A, 314, 615
- Litovchenko et al. (2011) Litovchenko, I. D., Alakoz, A. V., Val’Tts, I. E., & Larionov, G. M. 2011, Astronomy Reports, 55, 1086
- Menten (1991) Menten, K. M. 1991, ApJ, 380, L75
- Minier et al. (2003) Minier, V., Ellingsen, S. P., Norris, R. P., & Booth, R. S. 2003, A&A, 403, 1095
- Pandian et al. (2007) Pandian, J. D., Goldsmith, P. F., & Deshpande, A. A. 2007, ApJ, 656, 255
- Pestalozzi et al. (2005) Pestalozzi, M. R., Minier, V., & Booth, R. S. 2005, A&A, 432, 737
- Pihlström et al. (2011) Pihlström, Y. M., Sjouwerman, L. O., & Fish, V. L. 2011, ApJ, 739, L21
- Plambeck & Menten (1990) Plambeck, R. L., & Menten, K. M. 1990, ApJ, 364, 555
- Purcell et al. (2009) Purcell, C. R., Longmore, S. N., Burton, M. G., et al. 2009, MNRAS, 394, 323
- Rygl et al. (2010) Rygl, K. L. J., Brunthaler, A., Reid, M. J., et al. 2010, A&A, 511, A2
- Sandell et al. (2003) Sandell, G., Wright, M., & Forster, J. R. 2003, ApJ, 590, L45
- Sandell et al. (2005) Sandell, G., Goss, W. M., & Wright, M. 2005, ApJ, 621, 839
- Sarma & Momjian (2009) Sarma, A. P., & Momjian, E. 2009, ApJ, 705, L176
- Sarma & Momjian (2011) Sarma, A. P., & Momjian, E. 2011, ApJ, 730, L5
- Slysh et al. (1994) Slysh, V. I., Kalenskii, S. V., Valtts, I. E., & Otrupcek, R. 1994, MNRAS, 268, 464
- Sobolev et al. (2005) Sobolev, A. M., Ostrovskii, A. B., Kirsanova, M. S., et al. 2005, Massive Star Birth: A Crossroads of Astrophysics, 227, 174
- Val’tts et al. (1995) Val’tts, I. E., Dzyura, A. M., Kalenskii, S. V., et al. 1995, AZh, 72, 22
- Val’tts et al. (2000) Val’tts, I. E., Ellingsen, S. P., Slysh, V. I., Kalenskii, S. V., Otrupcek, R., & Larionov, G. M. 2000, MNRAS, 317, 315
- Val’tts & Larionov (2007) Val’tts, I. E., & Larionov, G. M. 2007, Astronomy Reports, 51, 519
- Voronkov (1999) Voronkov, M. A. 1999, Astronomy Letters, 25, 149
- Voronkov et al. (2005) Voronkov, M. A., Sobolev, A. M., Ellingsen, S. P., & Ostrovskii, A. B. 2005, MNRAS, 362, 995
- Voronkov et al. (2006) Voronkov, M. A., Brooks, K. J., Sobolev, A. M., et al. 2006, MNRAS, 373, 411
- Voronkov et al. (2010a) Voronkov, M. A., Caswell, J. L., Ellingsen, S. P., & Sobolev, A. M. 2010a, MNRAS, 405, 2471
- Voronkov et al. (2010b) Voronkov, M. A., Caswell, J. L., Britton, T. R., Green, J. A., Sobolev, A. M., & Ellingsen, S. P. 2010b, MNRAS, 408, 133
- Voronkov et al. (2011) Voronkov, M. A., Walsh, A. J., Caswell, J. L., et al. 2011, MNRAS, 413, 2339
- Voronkov et al. (2012) Voronkov, M. A., Caswell, J. L., Ellingsen, S. P., et al. 2012, IAU Symposium, 287, 433
- Wirström et al. (2011) Wirström, E. S., Geppert, W. D., Hjalmarson, Å., et al. 2011, A&A, 533, A24
- Wu et al. (2004) Wu, Y., Wei, Y., Zhao, M., Shi, Y., Yu, W., Qin, S., & Huang, M. 2004, A&A, 426, 503
- Xu et al. (2006) Xu, Y., Reid, M. J., Zheng, X. W., & Menten, K. M. 2006, Science, 311, 54
- Xu et al. (2008) Xu, Y., Li, J. J., Hachisuka, K., et al. 2008, A&A, 485, 729
- Xu et al. (2009) Xu, Y., Voronkov, M. A., Pandian, J. D., et al. 2009, A&A, 507, 1117
| Summary | High-mass | Low-mass | Total |
|---|---|---|---|
| Outflow Targets | 123 | 165 | 288 |
| Detections | 47 | 15 | 62 |
| Detection rate | 38% | 9% | 22% |
| aClass I (new detections) | 27 (13) | 10 (6) | 37 (19) |
-
•
aNumber of class I methanol masers newly-identified at 95 GHz transition in the first time. The value in bracket present the number of newly-identified class I methanol masers in our work.
Source Other name RA DEC Class I Class II Name (J2000) (J2000) ( ) ( ) (Jy) ( ) ( ) (Jy) 36 GHza 44 GHzb 95 GHzc 6.7 GHzd (1) (2) (3) (4) (5) (6) (7) (8) (9) (10) (11) (12) (13) (14) (a) Sources had 95 GHz class I methanol masers detected previously. G10.84-2.59 GGD27 18:19:12.1 -20:47:26 13.15(0.04) 0.70(0.06) 72.98 54.12(8.56) 69.20 2.55 - Y Y - 12.26(0.19) 0.92(0.75) 15.39 15.08(10.11) G17.02-2.40 L379IRAS(2) 18:30:34.9 -15:14:38 14.80(0.11) 0.88(0.23) 3.94 3.67(0.87) 30.68 1.16 - - Y - 18.49(0.21) 2.16(0.56) 6.43 14.75(3.41) 20.11(0.08) 1.09(0.20) 7.74 8.96(2.88) 22.65(0.27) 1.46(0.46) 2.13 3.30(1.02) G19.88-0.54 18264-1152 18:29:14.7 -11:50:25 44.37(0.07) 0.82(0.14) 8.94 7.75(2.02) 59.19 0.85 - - Y Y 43.42(0.19) 4.53(0.55) 4.41 21.27(2.54) 43.32(0.03) 1.14(0.08) 24.19 29.22(2.48) 40.98(0.05) 0.26(6.03) 3.40 0.95(0.40) G25.65+1.05 18316-0602 18:34:20.8 -5:59:42 41.62(0.02) 0.54(0.04) 26.47 15.33(1.30) 58.54 2.44 - Y Y - 43.85(0.04) 0.30(0.10) 8.60 2.77(0.87) 42.51(0.07) 0.37(0.13) 6.29 2.49(0.96) 42.95(0.21) 4.56(0.47) 7.83 37.95(3.66) G35.20-0.74 G35.2-0.74 18:58:12.9 1:40:37 36.71(0.67) 2.56(1.00) 3.09 8.43(6.88) 50.31 1.30 - Y Y Y 34.52(0.06) 1.92(0.26) 12.23 25.05(4.25) 33.35(0.63) 3.87(1.73) 4.08 16.83(3.19) G43.17+0.00 W49 19:10:15.6 9:06:09 15.37(0.68) 4.68(1.06) 1.10 5.46(1.61) 8.41 0.53 Y Y Y Y 14.31(0.08) 0.85(0.31) 2.22 1.99(0.84) 12.46(0.15) 0.71(0.30) 1.26 0.96(0.56) G59.78+0.07 19410+2336(L) 19:43:11.3 23:44:06 22.98(0.29) 3.74(0.67) 1.97 7.82(1.64) 18.70 0.78 - - Y - 22.31(0.05) 1.30(0.16) 6.33 8.74(1.58) 22.44(0.02) 0.35(0.06) 5.70 2.15(0.59) G75.78+0.34 G75C 20:21:44.1 37:26:42 3.50(0.06) 1.08(0.14) 5.20 5.98(0.65) 14.70 0.79 Y Y Y - 0.58(0.07) 0.93(0.15) 4.94 4.91(0.81) -1.10(0.19) 1.55(0.44) 2.32 3.82(0.96) G81.68+0.54 DR21 20:39:00.0 42:19:28 -3.68(0.01) 0.51(0.04) 20.47 11.00(0.87) 48.29 1.30 - Y Y - -2.00(0.08) 0.97(0.15) 5.14 5.32(1.27) -3.12(0.10) 4.13(0.23) 7.28 31.96(2.17) G81.88+0.78 W75-N 20:38:37.4 42:37:57 8.87(0.01) 0.37(0.03) 15.30 5.99(0.43) 62.22 1.06 Y Y Y Y 11.92(0.09) 0.73(0.19) 2.54 1.98(0.59) 8.52(0.05) 4.25(0.13) 11.98 54.25(1.33) G105.37+9.84 NGC7129 FIR 21:43:01.3 66:03:37 -8.53(0.14) 3.84(0.36) 1.61 6.58(0.50) 6.58 0.26 - Y Y - G106.80+5.31 S140 22:19:18.1 63:18:54 -7.15(0.13) 2.58(0.22) 2.95 8.09(0.81) 8.69 0.75 Y Y Y - -6.63(0.10) 0.43(0.19) 1.31 0.60(0.40) G108.59+0.49 22506+5944 22:52:36.9 60:00:48 -51.11(0.26) 2.41(0.26) 2.86 7.32(0.34) 14.14 0.70 - Y Y - -49.63(0.26) 0.48(0.26) 1.17 0.59(0.34) -51.90(0.26) 1.29(0.26) 2.18 2.99(0.34) -46.45(0.26) 1.77(0.26) 1.72 3.23(0.34) G111.53+0.76 NGC7538 IRAS11 23:13:44.7 61:26:54 -56.91(0.13) 1.13(0.13) 8.17 9.79(0.81) 89.82 1.74 - Y Y - -53.67(0.13) 3.03(0.13) 5.85 18.89(0.81) -50.16(0.13) 1.38(0.13) 4.49 6.60(0.81) -54.77(0.13) 2.72(0.13) 11.19 32.43(0.81) -57.55(0.13) 2.37(0.13) 8.75 22.11(0.81) G111.54+0.75 NGC7538 A 23:13:47.8 61:26:39 -50.80(0.18) 1.69(0.34) 2.19 3.94(0.84) 55.53 1.18 - Y Y - -53.24(0.03) 0.78(0.09) 8.62 7.11(1.30) -54.95(0.08) 2.86(0.25) 12.04 36.62(2.98) -57.06(0.06) 1.09(0.14) 6.80 7.85(1.64) G111.54+0.78 NGC7538 23:13:44.7 61:28:10 -57.39(0.04) 1.00(0.18) 12.11 12.88(4.19) 31.76 1.25 Y Y Y - -57.02(0.20) 2.86(0.60) 6.20 18.88(3.97) G173.49+2.44 05358+3543 5:39:10.6 35:45:19 -16.05(0.11) 1.26(0.27) 2.18 2.94(0.90) 13.84 0.50 Y Y Y Y -18.84(0.40) 5.58(0.85) 1.84 10.90(1.59)
Source Other name RA DEC Class I Class II Name (J2000) (J2000) ( ) ( ) (Jy) ( ) ( ) (Jy) 36 GHza 44 GHzb 95 GHzc 6.7 GHzd (1) (2) (3) (4) (5) (6) (7) (8) (9) (10) (11) (12) (13) (14) G192.60-0.05 S255-IRS1 6:12:54.4 17:59:25 4.98(0.03) 0.30(0.08) 5.25 1.69(0.34) 19.35 1.10 - Y Y Y 7.29(0.06) 0.94(0.17) 6.48 6.50(1.92) 8.45(0.50) 2.46(0.60) 2.94 7.70(2.02) 11.33(0.07) 0.73(0.16) 3.56 2.75(0.59) 9.62(0.14) 0.42(0.34) 1.57 0.71(0.78) G208.99-19.38 ORION-A 5:35:14.5 -5:22:21 7.85(0.09) 1.54(0.16) 34.60 56.83(10.23) 1070.60 2.88 Y Y Y Y 16.58(0.01) 12.39(0.34) 31.00 408.74(10.48) 6.53(0.06) 8.69(0.26) 34.62 320.42(9.55) 8.82(0.01) 3.62(0.09) 66.15 255.23(9.21) 8.60(0.02) 0.54(0.05) 51.66 29.39(4.74) G209.01-19.41 ORION-S 5:35:12.4 -5:24:11 6.57(0.14) 3.05(0.16) 25.03 81.21(4.22) 143.69 1.92 Y - Y Y 6.10(0.22) 2.10(0.38) 8.18 18.33(6.98) 8.35(0.24) 5.84(0.54) 7.10 44.15(5.18) (b) Sources detected at 95 GHz class I methanol masers in the first time. G9.62+0.19 G9.62+0.19F 18:06:14.8 -20:31:39 5.82(0.58) 6.20(0.82) 1.50 9.90(7.75) 28.47 0.75 - Y - Y 3.74(0.08) 2.55(0.21) 5.33 14.45(0.96) 0.41(0.20) 1.87(0.33) 2.07 4.12(0.87) G45.07+0.13 G45.07+0.13 19:13:21.7 10:50:53 59.29(0.14) 0.95(0.41) 0.86 0.87(0.39) 5.79 0.25 - Y - - 58.44(0.42) 6.36(1.01) 0.73 4.92(0.68) G53.03+0.12 19266+1745 19:28:53.9 17:51:56 5.05(0.18) 2.32(0.50) 1.47 3.62(0.62) 5.02 0.41 - Y - - 6.71(0.09) 0.46(0.21) 1.20 0.59(0.31) 8.51(0.06) 0.46(0.11) 1.67 0.82(0.22) G77.46+1.76 20188+3928 20:20:39.6 39:37:52 -2.87(0.19) 1.01(0.32) 1.43 1.53(0.50) 10.55 0.69 - Y - - -0.72(0.10) 0.85(0.20) 2.41 2.17(0.50) 1.72(0.10) 1.89(0.24) 3.39 6.84(0.74) G78.12+3.63 20126+4104 20:14:26.0 41:13:32 -0.59(0.14) 0.61(0.35) 1.38 0.90(0.47) 24.18 0.75 - Y - - -4.61(0.06) 0.67(0.18) 3.12 2.23(0.87) -3.29(0.02) 0.37(0.05) 6.01 2.36(0.40) -3.01(0.09) 2.47(0.21) 7.11 18.69(1.43) G78.97+0.36 20293+3952 20:31:10.4 40:03:10 6.59(0.09) 1.45(0.25) 3.67 5.66(0.78) 11.17 1.04 - Y - - 4.98(0.06) 0.84(0.14) 4.99 4.46(0.68) 3.63(0.24) 0.89(0.38) 1.12 1.05(0.53) G110.09-0.07 23033+5951 23:05:25.0 60:08:12 -54.14(0.15) 0.96(0.25) 6.00 6.15(2.26) 18.57 1.19 - Y - - -54.55(0.03) 0.35(0.08) 7.34 2.72(1.40) -53.81(0.47) 5.52(1.31) 1.65 9.70(1.86) G111.24-1.24 23151+5912 23:17:21.4 59:28:49 -51.73(0.13) 0.38(0.62) 1.32 0.54(0.37) 5.76 0.58 - Y - - -52.74(0.08) 0.85(0.17) 2.86 2.58(0.43) -55.64(0.03) 0.26(0.95) 2.37 0.66(0.25) -54.73(0.07) 0.73(0.17) 2.56 1.98(0.37) G111.55+0.75 NGC7538 IRAS9 23:13:53.8 61:27:09 -57.32(0.12) 1.10(0.14) 1.63 1.91(0.34) 14.33 0.35 - Y - - -55.55(0.16) 0.90(0.40) 1.11 1.06(0.64) -55.62(0.17) 4.92(0.49) 2.17 11.36(0.87) G121.30+0.66 00338+6312 0:36:47.2 63:29:02 -17.80(0.20) 2.74(0.48) 2.57 7.49(1.21) 8.95 0.85 - Y - Y -17.56(0.06) 0.41(0.28) 3.29 1.45(0.74) G122.01-7.07 00420+5530 0:44:57.2 55:47:18 -51.10(0.00) 1.09(0.22) 1.36 1.58(0.31) 3.49 0.34 - Y - - -48.50(0.00) 1.56(0.30) 1.15 1.91(0.37) G173.72+2.69 S235B 5:40:52.5 35:41:26 -16.40(0.01) 0.95(0.03) 15.22 15.31(0.37) 17.65 0.61 - Y - - -17.37(0.03) 0.43(0.08) 3.24 1.48(0.28) -18.43(0.08) 0.49(0.21) 1.66 0.87(0.28) G174.20-0.08 AFGL5142 5:30:46.0 33:47:52 -0.38(0.15) 1.00(0.25) 3.33 3.56(0.96) 23.73 1.54 - Y - - -3.15(0.03) 0.88(0.20) 7.92 7.38(3.16) -4.62(0.50) 2.18(1.04) 2.60 6.05(2.79) -1.90(0.13) 1.27(0.33) 5.00 6.75(1.36) G188.95+0.89 AFGL 5180 6:08:54.2 21:38:25 2.27(0.45) 2.98(1.12) 3.49 11.08(2.08) 23.01 1.35 Y - - Y 3.89(0.49) 2.74(0.93) 4.09 11.93(2.23)
Source Other name RA DEC Class I Class II Name (J2000) (J2000) ( ) ( ) (Jy) ( ) ( ) (Jy) 36 GHza 44 GHzb 95 GHzc 6.7 GHzd (1) (2) (3) (4) (5) (6) (7) (8) (9) (10) (11) (12) (13) (14) (c) Sources detected only at 95 GHz class I methanol masers so far (newly-identified class I methanol masers). G37.55+0.20 18566+0408 18:59:10.1 4:12:14 85.65(0.20) 4.33(0.54) 2.00 9.22(0.90) 9.22 0.53 - - - - G51.68+0.72 19217+1651 19:23:58.8 16:57:37 2.66(0.28) 2.93(0.90) 1.30 4.04(0.96) 8.23 0.48 - - - - -0.23(0.21) 1.00(0.38) 1.17 1.24(0.50) 4.66(0.11) 0.48(0.23) 1.29 0.66(0.37) 5.59(0.18) 0.73(0.36) 0.93 0.73(0.37) 7.55(0.18) 1.29(0.30) 1.13 1.56(0.40) G70.29+1.60 19598+3324 20:01:45.6 33:32:43 -24.63(0.54) 7.24(1.03) 0.66 5.07(0.66) 5.07 0.19 - - - - G79.87+1.18 20286+4105 20:30:28.4 41:15:48 -3.12(0.23) 3.80(0.43) 2.78 11.24(1.36) 15.03 0.65 - - - - -4.09(0.08) 0.76(0.25) 3.01 2.42(0.87) -6.79(0.11) 0.71(0.28) 1.81 1.38(0.47) G79.88+2.55 20227+4154 20:24:31.1 42:04:17 4.84(0.58) 10.41(1.52) 1.34 14.82(1.67) 14.82 0.64 - - - - G109.99-0.28 23032+5937 23:05:23.2 59:53:53 -51.99(0.30) 0.43(0.49) 0.74 0.34(0.84) 5.11 0.52 - - - - -50.55(0.19) 1.19(0.44) 1.07 1.36(0.43) -54.13(0.29) 1.00(1.61) 0.95 1.01(1.02) -52.71(0.15) 0.93(0.62) 2.44 2.41(1.46) G111.25-0.77 23139+5939 23:16:09.4 59:55:23 -44.98(0.12) 2.67(0.27) 2.54 7.23(0.62) 7.23 0.40 - - - - G123.07-6.31 00494+5617 0:52:23.9 56:33:45 -30.73(0.13) 5.88(0.36) 5.43 34.00(1.61) 45.28 0.81 - - - Y -40.31(0.28) 4.35(0.57) 2.43 11.27(1.33) G138.30+1.56 AFGL4029 3:01:32.7 60:29:12 -33.98(0.10) 0.85(0.19) 1.66 1.50(0.34) 6.50 0.51 - - - - -36.67(0.14) 1.25(0.34) 1.99 2.65(0.62) -38.05(0.11) 0.86(0.22) 2.08 1.91(0.53) -39.12(0.05) 0.27(0.73) 1.53 0.44(0.19) G173.58+2.44 05361+3539 5:39:27.5 35:40:43 -16.79(0.14) 1.58(0.32) 2.18 3.68(0.64) 3.68 0.54 - - - - G206.57-16.36 NGC2024 FIR 6 5:41:45.5 -1:56:02 11.77(0.10) 0.74(0.18) 1.96 1.54(0.40) 7.84 0.70 - - - - 10.26(0.13) 1.88(0.20) 2.30 4.61(0.03) 7.16(0.07) 0.72(0.16) 2.20 1.69(0.31) G207.27-1.81 AFGL961 6:34:37.6 04:12:44 12.09(0.13) 0.84(0.38) 2.84 2.54(0.76) 5.39 0.74 - - - - 14.10(0.14) 0.68(0.33) 2.03 1.48(0.59) 17.27(0.13) 0.62(0.26) 2.09 1.37(0.56) G213.70-12.60 MON R2 6:07:48.3 -06:22:54 10.14(0.17) 2.34(0.39) 1.88 4.68(0.67) 4.68 0.47 - - - Y Columns (1) present the source name sorted by the galactic coordinates. Columns (2) - (4) list other source name from Wu et al. (2004) and corresponding equatorial coordinates. Columns (5) - (9) present Gaussian fitting parameters of detected methanol emission: the velocity at peak , the line FWHM , the integrated intensity , the total integrated intensity . Value in brackets is the fitting error. Columns (10) list 1- noise of observations. Columns (11) - (14) list the 36 GHz, 44 GHz and 95 GHz class I and 6.7 GHz class II methanol maser associations: Y = Yes, N = No, ”-” = No information. References: a Liechti & Wilson (1996) b Val’tts & Larionov (2007); Kurtz et al. (2004); Larionov & Val’tts (2007); Fontani et al. (2010); Kalenskii et al. (2006, 2010); Litovchenko et al. (2011); Bae et al. (2011) c Val’tts et al. (1995); Val’tts & Larionov (2007); Kalenskii et al. (1994); Kalenskii et al. (2006); Larionov et al. (1999); Fontani et al. (2010); Chen et al. (2011, 2012) d Xu et al. (2009); Caswell (2009); Caswell et al. (2010, 2011); Green et al. (2010, 2012)
Name Other name RA DEC Class I Class II Name (J2000) (J2000) ( ) ( ) (Jy) ( ) ( ) (Jy) 36 GHza 44 GHzb 95 GHzc 6.7 GHzd (1) (2) (3) (4) (5) (6) (7) (8) (9) (10) (11) (12) (13) (14) (a) Sources had 95 GHz class I methanol masers detected previously. G99.98+4.17 IC1396-N 21:40:42.1 58:16:10 0.00(0.04) 0.39(0.13) 3.21 1.32(0.40) 13.75 0.94 - Y Y - -0.84(0.03) 0.47(0.07) 5.44 2.75(0.53) -0.76(0.19) 3.61(0.41) 2.52 9.68(1.02) G158.40-20.57 NGC1333/IRAS4A 3:29:10.5 31:13:32 7.18(0.08) 0.30(2.67) 6.86 2.19(0.90) 17.39 1.42 - Y Y - 6.81(0.12) 1.92(0.28) 7.44 15.20(1.92) G205.10-14.39 HH26IR 5:46:05.5 -00:14:17 10.42(0.06) 0.83(0.16) 3.69 3.25(0.53) 6.17 0.53 - Y Y - 9.17(0.13) 0.90(0.29) 1.83 1.74(0.53) 12.14(0.16) 0.43(0.77) 2.57 1.18(0.35) G205.11-14.11 NGC2071 5:47:04.1 0:21:42 8.43(0.19) 1.34(0.37) 3.69 5.26(1.58) 14.64 0.86 Y - Y - 12.96(0.41) 1.58(0.83) 1.35 2.27(0.99) 10.22(0.16) 1.59(0.46) 4.20 7.10(1.77) G206.54-16.36 NGC2024 FIR 4 5:41:43.5 -1:54:45 9.64(0.39) 1.50(0.47) 2.40 3.83(0.65) 8.75 1.22 Y - Y Y 10.31(0.51) 0.72(0.77) 2.19 1.68(0.84) 10.86(0.29) 0.91(0.30) 3.36 3.24(0.99) (b) Sources detected at 95 GHz class I methanol masers in the first time. G65.78-2.61 20050+2720 20:07:06.2 27:28:53 6.32(0.17) 2.76(0.47) 1.12 3.29(0.43) 3.29 0.46 - Y - - G110.48+1.48 23011+6126 23:03:13.0 61:42:26 -11.09(0.26) 1.26(0.26) 3.15 4.21(0.31) 15.87 0.69 - Y - - -9.46(0.26) 2.02(0.26) 1.45 3.13(0.31) -13.82(0.26) 2.08(0.26) 2.18 4.81(0.31) -17.17(0.26) 0.46(0.26) 2.01 0.98(0.31) -18.53(0.26) 2.04(0.26) 1.26 2.74(0.31) G119.80-6.03 00259+5625 0:28:44.8 56:42:07 -38.55(0.14) 2.20(0.38) 8.37 19.62(3.94) 45.54 1.37 - Y - - -35.66(0.30) 2.98(0.71) 5.27 16.70(4.15) -31.95(0.15) 2.14(0.36) 4.05 9.23(1.46) G205.12-14.38 HH25 MMS 5:46:07.5 -0:13:36 12.45(0.16) 1.18(0.30) 1.79 2.25(0.56) 11.30 1.00 - Y - - 11.02(0.09) 0.45(0.18) 2.04 0.98(0.40) 7.89(0.31) 2.54(0.66) 1.53 4.14(0.93) 10.18(0.04) 0.65(0.11) 5.72 3.93(0.62) (c) Sources detected only at 95 GHz class I methanol masers so far (newly-identified class I methanol masers). G75.79+0.33 G75E 20:21:47.1 37:26:30 -0.41(0.23) 3.83(0.60) 1.58 6.44(0.80) 8.75 0.41 - - - - 3.82(0.10) 1.09(0.21) 1.99 2.31(0.41) G87.06-4.19 L944 SMM1 21:17:43.8 43:18:47 0.06(0.17) 1.57(0.48) 1.44 2.39(0.62) 8.00 0.52 - - - - 4.60(0.14) 1.83(0.30) 1.96 3.80(0.56) 2.12(0.08) 0.88(0.30) 1.93 1.80(0.47) G183.72-3.66 GGD4 5:40:24.1 23:50:54 2.64(0.26) 2.79(0.67) 1.17 3.47(0.67) 3.47 0.41 - - - - G206.56-16.36 NGC2024 FIR 5 5:41:44.5 -1:55:38 11.20(0.00) 1.05(0.41) 2.44 2.73(1.60) 9.78 0.46 - - - - 11.00(0.00) 4.11(1.38) 1.61 7.05(1.38) G208.77-19.24 FIR 1 5:35:21.8 -05:07:37 10.90(0.18) 1.56(0.35) 0.75 1.25(0.27) 1.25 0.25 - - - - G208.97-19.37 ORION-KLN 5:35:15.5 -5:20:41 9.84(0.06) 1.39(0.17) 6.60 9.73(0.90) 11.79 0.82 - - - - 11.52(0.16) 0.98(0.37) 1.99 2.06(0.74) Columns (1) present the source name sorted by the galactic coordinates. Columns (2) - (4) list other source name from Wu et al. (2004) and corresponding equatorial coordinates. Columns (5) - (9) present Gaussian fitting parameters of detected methanol emission: the velocity at peak , the line FWHM , the integrated intensity , the total integrated intensity . Value in brackets is the fitting error. Columns (10) list 1- noise of observations. Columns (11) - (14) list the 36 GHz, 44 GHz and 95 GHz class I and 6.7 GHz class II methanol maser associations: Y = Yes, N = No, ”-” = No information. References: a Liechti & Wilson (1996) b Val’tts & Larionov (2007); Kurtz et al. (2004); Larionov & Val’tts (2007); Fontani et al. (2010); Kalenskii et al. (2006, 2010); Litovchenko et al. (2011); Bae et al. (2011) c Val’tts et al. (1995); Val’tts & Larionov (2007); Kalenskii et al. (1994); Kalenskii et al. (2006); Larionov et al. (1999); Fontani et al. (2010); Chen et al. (2011, 2012) d Xu et al. (2009); Caswell (2009); Caswell et al. (2010, 2011); Green et al. (2010, 2012)
| Outflow properties | Slope | Intercept | correlation coefficient |
|---|---|---|---|
| 0.514(0.081) | -7.769(0.326) | 0.66 | |
| 0.581(0.074) | -6.361(0.110) | 0.73 | |
| 0.616(0.079) | -7.036(0.179) | 0.74 | |
| 0.448(0.072) | -6.270(0.123) | 0.67 | |
| 0.334(0.229) | -6.089(0.260) | 0.33 |
Source Other name R.A. Dec. Frequency (GHz) References Our name (1) (2) (3) (4) (5) (6) (7) G65.78-2.61 20050+2720 20:07:06.7 27:28:53 44 9 G65.78-2.61 G99.98+4.17 Mol 138 21:40:41.0 58:16:16 44,95 5,6,7 G99.98+4.17 G102.64+15.78 L1157 B1 20:39:08.1 68:01:13 44,95 2,3 G102.65+15.80 L1157-mm 20:39:06.2 68:02:15 95 1 G110.48+1.48 IRAS 23011+6126 23:03:13.0 61:42:26 44 8 G110.48+1.48 G119.80-6.03 CB 3 0:28:42.7 56:42:07 44 8 G119.80-6.03 G158.36-20.58 NGC 1333I2A 3:29:01.0 31:14:20 44 3 G158.39-20.57 NGC 1333I4A 3:29:10.3 31:03:13 44 3 G158.40-20.58 NGC 1333IRAS4A 3:29:12.0 31:13:09 44,95 2 G158.40-20.57 G205.07-14.36 HH 25MMS 5:46:08.0 0:16:26 44,95 2 G205.11-14.11 NGC 2071 5:47:04.1 0:21:42 36,95 4,5 G205.11-14.11 G205.11-14.38 HH25MMS 5:46:06.5 -0:13:54 44,95 3 G205.10-14.39, G205.12-14.38 G206.54-16.36 NGC 2024 5:41:42.9 -1:54:34 36,95 4,5 G206.54-16.36 G206.89-16.60 NGC2023 5:41:28.5 -2:19:19 36 3
-
•
Column (1) list source name sorted by the galactic coordinates.
-
•
Columns (2)–(4) present other source name and corresponding equatorial coordinates from references.
-
•
Columns (5)–(6) present frequency of previous detections and corresponding references.
-
•
Column (7) list corresponding low-mass source names with 95 GHz methanol maser detections in this work.
- •
(a)
(b)
(c)
(a)
(b)
(c)
Appendix A Undetected 95 GHz methanol maser sources
Name Other name RA DEC RMS Mass (J2000) (J2000) (Jy) (1) (2) (3) (4) (5) (6) G1.36+20.97 L43 16:34:29.3 -15:47:01.0 1.62 L G8.66+22.18 16442-0930 16:46:58.4 -09:35:22.0 0.54 L G11.30-2.02 18150-2016 18:17:59.2 -20:06:58.0 1.54 H G11.42-1.68 18139-1952 18:16:56.9 -19:51:08.0 1.28 H G11.42-1.37 18128-1943 18:15:47.7 -19:42:18.0 0.74 H G11.50-1.48 18134-1942 18:16:21.7 -19:41:31.0 0.85 H G17.64+0.15 18196-1331 18:22:26.8 -13:30:15.0 1.35 H G23.57+1.58 18258-0737 18:28:34.6 -07:35:31.0 1.12 H G24.89+5.38 L483 18:17:30.2 -04:39:38.0 0.6 L G28.58-1.73 18470-0044 18:49:41.1 -04:39:35.0 0.79 H G28.75+3.52 W40 18:31:16.2 -02:06:49.0 1.43 H G30.64+3.25 18331-0035 18:35:42.4 -00:33:18.0 0.69 L G31.59+5.35 S68 Firs1 18:29:57.4 01:14:45 0.99 L G31.59+5.38 Serpens SMM1-11 18:29:50.4 01:15:19 1.32 L G39.39-0.14 19012+0536 19:03:45.4 05:40:40 1.35 H G39.82-11.92 S87 19:46:20.5 00:35:24 1.59 H G40.62-0.14 19035+0641 19:06:01.2 06:46:35 0.67 H G42.16-11.49 19471+2641 19:49:09.8 02:48:52 1.44 H G42.64-10.17 L810 19:45:24.2 03:51:01 1.38 H G43.23-12.57 19529+2704 19:54:59.7 03:12:52 0.54 H G43.83-14.82 CB214 20:03:59.1 02:38:14 1.3 L G43.94-11.94 19520+2759 19:54:06.4 04:07:25 1.08 H G44.93-6.55 B335 19:36:59.7 07:34:07 1.42 L G45.12+0.13 G45.12+0.13 19:13:28.6 10:53:22 1.33 H G46.17-1.55 AS353 19:21:30.6 11:02:14 1.41 L G46.31-1.19 L673 19:20:29.2 11:19:40 1.27 L G46.34-1.15 L673 SMM1 19:20:25.2 11:22:17 1.16 L G46.53-1.02 CB188 19:20:17.9 11:35:57 1.31 H G48.57-10.19 19550+3248 19:56:55.0 08:56:32 0.72 L G50.84-11.92 20056+3350 20:07:31.5 09:59:39 0.65 H G50.92-12.07 20062+3350 20:08:12.6 09:59:20 1.2 L G51.25-27.69 L988-a 21:02:23.0 02:03:06 0.65 L G51.36-27.26 V1331Cyg 21:01:09.0 02:21:46 0.93 L G51.58-28.00 L988-f 21:04:03.2 02:07:49 1.14 L G51.67-27.92 L988-e 21:03:58.0 02:14:38 1.22 L G52.10+1.04 19213+1723 19:23:37.1 17:28:59 1.63 H G52.98+3.05 L723 2 Flows 19:17:53.9 19:12:19 1.2 L G53.16-11.98 20106+3545 20:12:31.3 11:54:46 1.31 H G53.60-10.36 CB217 20:07:45.9 13:07:01 1.27 L G53.63+0.02 19282+1814 19:30:28.4 18:20:53 0.66 H G53.78-24.68 20582+7724 20:57:10.6 05:35:46 1.11 L G53.88-15.15 20231+3440 SMM1 20:25:00.3 10:50:05 0.7 L G53.93-15.13 20231+3440 SMM2 20:25:01.2 10:53:05 0.94 L G55.72-13.06 G75N 20:21:42.1 13:27:20 1.36 L G55.86-12.99 G75.78NE 20:21:44.8 13:37:00 1.03 H G57.08-33.39 21307+5049 21:32:31.2 03:02:22 0.94 H G57.39-34.01 21334+5039 21:35:09.2 02:53:09 0.63 H G57.61-35.37 V645Cyg 21:39:58.6 02:14:22 0.7 H G58.15+3.51 L778 19:26:32.2 23:58:42 1.36 L G59.11-13.13 AFGL2591 20:29:24.9 16:11:19 1.15 H G59.13-20.12 20520+6003 20:53:13.9 12:14:44 1.27 L G59.15-20.29 20526+5958 20:53:50.4 12:09:46 0.59 L G59.24-11.32 20216+4107 20:23:24.2 17:17:40 1.28 H G59.27-13.20 20281+4006 20:30:00.9 16:16:36 1.15 L G59.36-12.88 20272+4021 20:29:05.3 16:31:58 1.1 H G59.36-0.21 19411+2306 19:43:18.0 23:13:59 0.34 H G59.47-0.05 1548C27 19:42:55.7 23:24:20 1.23 L G59.60+0.92 19374+2352 19:39:32.8 23:59:55 1.44 H G60.35-10.94 20228+4215 20:24:34.5 18:25:01 1.19 H G61.30-13.63 20343+4129 d 20:36:07.6 17:40:01 0.85 H G62.22-4.54 CB216 20:05:54.1 23:27:04 1.57 L G62.68-33.11 21413+5442 21:43:01.2 06:56:18 0.59 H G63.11-12.29 20353+6742 20:35:45.4 19:52:59 0.56 L G63.71-12.84 L1157 20:39:06.9 20:02:13 0.77 L Name Other name RA DEC RMS Mass (J2000) (J2000) (Jy) (1) (2) (3) (4) (5) (6) G63.73-31.59 GN21.38.9 21:40:29.8 08:35:13 1.17 L G64.60-14.18 Pvcep 20:45:53.6 19:57:39 1.46 L G65.55-32.10 IC1396-E 21:46:07.0 09:26:23 1.05 L G66.12-34.15 21519+5613 21:53:38.9 08:27:46 0.96 H G66.76-16.43 V1057Cyg 20:58:53.5 20:15:29 0.46 L G66.95-41.06 22142+5206 22:16:10.7 04:21:25 0.93 H G67.01-17.30 L1172D 21:02:24.0 19:54:27 0.67 L G67.17-17.10 21015+6757 21:02:09.5 20:09:09 1.54 L G69.72-19.82 CB230 21:17:40.0 20:17:32 0.73 L G70.43-45.27 22343+7501 22:35:24.3 03:17:06 1.25 L G71.14-39.02 22172+5549 22:19:09.3 08:04:45 1.15 H G71.19-45.93 22376+7455 22:38:47.3 03:11:29 1.11 L G71.38-16.87 B361 21:12:26.2 23:24:24 1.14 L G71.94-35.92 22103+5828 22:12:07.8 10:43:33 1.05 L G72.26-23.87 CB232 21:37:10.9 19:20:36 1.1 L G72.34-25.73 LKHa234 21:43:06.1 18:06:52 0.71 H G72.67-36.37 22134+5834 22:15:08.9 10:49:09 0.55 H G76.20-39.62 22305+5803 22:32:24.2 10:18:58 1.01 H G76.94-22.25 21432+4719 21:45:10.2 23:33:21 0.79 L G76.98-22.12 21429+4726 21:44:51.9 23:40:31 0.85 L G77.03-22.02 21428+4732 21:44:43.9 23:46:45 0.73 L G77.12-22.35 21441+4722 21:45:59.3 23:36:04 1.52 L G77.31-22.61 EL1-12 21:47:20.8 23:32:05 0.82 L G77.49-22.66 21461+4722 21:48:00.8 23:36:38 1.2 L G77.53-33.61 S140-N 22:19:28.6 15:32:56 0.81 L G78.03-23.66 BD+46 3471 21:52:34.6 23:13:43 1.07 L G78.21-33.68 L1204-A 22:21:27.9 15:51:42 1.3 H G80.15-34.54 L1206 22:28:52.0 16:13:43 1.35 H G81.79-41.02 22475+5939 22:49:29.6 11:54:57 0.97 H G83.48-30.65 L1221 22:28:02.7 21:01:13 1 L G84.01-42.75 22570+5912 22:59:06.7 11:28:28 1.22 H G84.50-54.06 CB244 23:25:45.8 02:17:38 1.38 L G85.13-31.50 22336+6855 22:35:06.1 21:10:53 0.68 L G85.19-40.26 Cep A 22:56:17.9 14:01:46 1.27 H G89.19-40.94 MBM 55 23:08:23.7 15:05:16 1.19 H G90.23-43.99 MWC1080 23:17:27.2 12:50:16 0.59 H G90.40-43.15 23140+6121 23:16:11.8 13:37:45 1.02 H G94.25-42.40 L1246 SMM1 23:25:04.8 15:36:40 0.58 L G95.21-45.81 23314+6033 23:33:44.6 12:50:30 0.49 H G97.69-46.21 23385+6053 23:40:51.1 13:10:29 1.13 H G104.92-43.54 23545+6508 23:57:05.1 17:25:11 1.39 H G107.26-50.82 LKHA 198 00:11:25.6 10:49:47 0.91 H G110.24-45.48 00117+6412 00:14:26.7 16:28:44 0.48 H G113.80-44.60 00213+6530 00:24:10.4 17:47:02 0.98 L G115.28-45.09 00259+6510 00:28:49.1 17:26:47 0.91 L G117.95-46.66 00342+6374 00:37:13.0 16:04:15 1.21 H G131.56-45.61 01133+6434 01:16:37.2 16:50:39 1.24 H G154.86-42.86 W3-IRS5 02:25:40.5 14:05:52 1.29 H G156.19-42.92 IC1805-W 02:29:02.3 13:33:32 1.16 H G157.66-42.02 02310+6133 02:34:46.4 13:46:22 1.44 H G161.63-39.79 02461+6147 02:50:09.5 13:59:58 0.97 H G168.75-39.96 AFGL437 03:07:24.4 10:31:08 0.74 H G173.06-36.36 AFGL490-iki 03:27:28.0 10:54:10 1.65 H G173.20-36.41 AFGL490 03:27:38.6 10:47:04 1.5 H G176.26-39.68 RNO13 03:25:09.5 06:46:22 1.23 L G176.37-39.62 L1448 03:25:36.5 06:45:19 1.02 L G176.40-39.62 L1448 U-star 03:25:38.5 06:44:04 1.13 L G176.61-38.74 NGC1333 03:28:39.5 07:13:34 0.75 L G176.64-38.69 IRAS2NNE-SSW 03:28:53.5 07:14:53 0.71 L G176.65-38.60 HH6 03:29:10.8 07:18:19 1.13 L G176.66-38.64 HH7-11 SSV 03:29:03.7 07:16:04 1.4 L G177.24-39.63 L1455NW 03:27:26.1 06:15:48 1.26 L G177.34-39.62 RNO15FIR 03:27:40.1 06:13:03 0.74 L G177.38-39.60 L1455M 03:27:48.1 06:12:06 1.67 L
|
Name Other name RA DEC RMS Mass (J2000) (J2000) (Jy) (1) (2) (3) (4) (5) (6) G177.63-38.58 03282+3035 03:31:20.2 06:45:25 1.32 L G177.73-37.96 03301+3057 03:33:22.8 07:07:30 0.7 L G177.73-39.03 03271+3013 03:30:14.6 06:23:49 0.84 L G178.78-26.46 PP 13S 04:10:41.1 14:07:54 0.64 L G178.86-19.97 HL/XZ Tau 04:31:38.0 18:13:59 1.41 L G178.92-34.02 B5-IRS4 03:47:45.9 09:03:45 1.17 L G178.93-20.05 L1551-IRS5 04:31:33.9 18:08:05 0.69 L G178.93-20.03 L1551NE 04:31:36.9 18:08:35 1.39 L G179.08-34.17 B5-IRS1 03:47:41.6 08:51:43 0.7 L G179.09-34.38 B5-IRS3 03:47:05.4 08:43:09 1.41 L G179.11-35.42 HH211 03:43:57.1 08:00:50 1.29 L G179.19-34.13 B5-IRS2 03:48:03.6 08:49:28 1.3 L G179.56-23.49 04191+1523 04:21:59.5 15:30:17 1.29 L G186.95-3.84 CB34 05:47:02.3 21:00:10 1 L G187.96-12.83 05137+3919 05:17:13.5 15:22:23 0.85 H G188.51-34.95 L1489 04:04:43.5 02:18:57 1.21 L G189.03+0.78 AFGL 6366S 06:08:41.1 21:31:01 1.01 H G190.20-31.37 04166+2706 04:19:42.7 03:13:40 1.21 L G190.63-31.18 04181+2655 04:21:10.5 03:02:06 0.69 L G190.75-13.70 05168+3634 05:20:16.5 12:37:21 1.72 H G192.07-11.00 RNO43N 05:32:27.0 12:57:06 1.44 L G192.13-11.06 RNO43S 05:32:23.9 12:52:07 1.23 L G192.16-11.11 L1582B 05:32:15.8 12:49:20 1.09 L G192.16-3.82 05553+1631 05:58:13.6 16:32:00 0.63 H G192.16-11.08 RNO43 05:32:21.8 12:49:40 0.8 L G192.88-3.18 HD250550 06:02:00.2 16:13:04 1.05 L G192.99+0.15 06114+1745 06:14:24.1 17:44:36 0.96 H G193.81-31.25 04239+2436 04:26:56.9 00:43:36 1.16 L G193.86-10.32 05358+3543 A+B 05:38:34.6 11:47:35 1.01 H G194.37-30.83 L1524 04:29:23.8 00:32:58 1 L G194.45-30.44 ZZ Tau 04:30:53.0 00:41:50 1.08 L G194.52-27.82 L1527 04:39:53.3 02:03:06 1.19 L G194.58-28.04 04361+2547 04:39:14.0 01:53:22 1.34 L G194.81-30.30 TMC2A 04:31:59.8 00:30:49 1.1 L G194.82-28.07 TMC1A 04:39:34.8 01:41:46 1.62 L G194.82-27.96 IC2087 04:39:58.9 01:45:06 1.88 L G194.99-27.68 04381+2540 04:41:13.0 01:46:37 0.74 L G195.03-11.71 05327+3404 05:36:05.7 10:06:12 1.26 L G195.05-30.21 L1529 04:32:44.7 00:23:13 0.88 L G195.27-16.98 HH114/115 05:18:17.0 07:11:01 1.44 H G195.72-29.75 04325+2402 04:35:33.5 00:08:15 1.34 L G196.93-10.42 B35 05:44:26.4 09:08:14 0.91 L G197.11-12.41 AFGL5157 05:37:48.2 07:59:24 0.7 H G198.58-9.14 L1598NW 05:52:11.5 08:21:28 1.16 L G201.87-7.62 S241 06:03:53.7 06:14:44 0.84 H G202.12+2.65 Mon OB1I 06:41:05.4 10:49:46 1.07 L G202.30+2.54 Mon OB1H 06:41:03.1 10:37:03 0.97 L G202.93+2.26 Mon OB1G 06:41:12.3 09:55:35 1.78 L G203.23+2.07 Mon OB1D 06:41:03.9 09:34:39 1.1 L Name Other name RA DEC RMS Mass (J2000) (J2000) (Jy) (1) (2) (3) (4) (5) (6) G203.32-11.94 05487+0255 05:51:23.1 02:55:45 1.03 L G203.36-11.73 05490+2658 05:52:12.7 02:59:33 1.08 H G203.47-11.92 05491+0247 05:51:46.0 02:48:35 1.26 L G203.76+1.27 NGC2261 06:39:09.9 08:44:12 1.02 L G204.88-13.85 NGC2071N 05:47:34.5 00:41:00 2.75 L G205.38-14.41 NGC2068/LBS17 05:46:29.7 -00:00:37.0 1.02 L G205.42-14.42 NGC2068 05:46:31.7 -00:02:56.0 1.18 L G205.52-14.57 HH24 05:46:11.5 -00:12:17.0 0.93 L G205.95-17.09 Ori-I-2 05:38:04.7 -01:45:09.0 1.36 L G206.01-15.48 HH212 05:43:51.5 -01:02:52.0 0.61 L G206.56-16.34 NGC2024 Ori B 05:41:49.5 -01:55:17.0 0.83 H G206.84-2.38 06291+0421 06:31:47.8 04:19:31 0.93 H G206.86-16.55 NGC 2023 05:41:37.1 -02:15:58.0 1.19 L G206.86-16.61 NGC2023-MM1 05:41:25.0 -02:18:09.0 1.51 L G207.33-2.15 06308+0402 06:33:31.4 04:00:07 1.05 H G207.60-23.03 L1634 05:19:49.0 -05:52:05.0 1.33 L G208.63-19.21 CSO 2 05:35:13.9 -04:59:22.0 1.48 L G208.66-19.21 AC 3 05:35:18.3 -05:00:41.0 1.06 L G208.75-19.22 OMC-2/3(MMS 9) 05:35:25.8 -05:05:37.0 0.85 L G208.77-19.19 MMS 10 05:35:33.8 -05:05:38.0 2.02 L G208.90-20.05 Ori A-W 05:32:42.2 -05:35:48.0 1.56 L G209.25-19.12 05341-0539 05:36:38.4 -05:28:16.0 1.46 L G209.85-20.27 HH83 05:33:32.2 -06:29:44.0 1.03 L G210.04-19.81 HH 34 05:35:30.2 -06:26:57.0 0.72 L G210.35-19.69 V380/OriNE 05:36:26.0 -06:39:12.0 1.36 L G210.40-19.72 V380 Ori 05:36:25.9 -06:42:38.0 1.3 L G210.43-19.74 05339-0646 05:36:23.9 -06:44:45.0 0.88 L G210.44-19.76 CS-star HH1 05:36:20.8 -06:45:35.0 1.55 L G210.44-19.75 VLA3 05:36:22.9 -06:45:22.0 1.55 L G210.45-19.76 HH 1-2 05:36:22.8 -06:46:07.0 1.96 L G210.58-19.81 V380/OriS 05:36:25.7 -06:54:12.0 1.49 L G210.82-36.61 L1642 04:34:49.9 -14:13:09.0 0.94 L G210.96-19.34 05363-0702 05:38:44.5 -07:01:03.0 1.04 L G211.44-19.39 Haro 4-255 05:39:22.0 -07:26:45.0 0.99 L G211.57-19.29 L1641S3 05:39:56.0 -07:30:26.0 0.45 L G211.58-19.15 L1641S 05:40:28.0 -07:27:28.0 0.99 L G212.25-19.36 L1641S4 05:40:49.2 -08:06:51.0 1.36 L G212.63-19.00 L1641S2 05:42:47.0 -08:17:06.0 0.98 L G213.88-11.83 GGD 12-15 06:10:51.5 -06:11:27.0 2.52 H G217.30-0.05 BFS 56 06:59:14.4 -03:54:52.0 0.53 L G217.38-0.08 BiP 14 06:59:16.3 -03:59:39.0 0.62 H G218.02-0.32 S287-C 06:59:36.5 -04:40:22.0 1.72 L G218.06-0.11 S287-A 07:00:23.6 -04:36:38.0 0.54 L G218.10-0.37 S287-B 06:59:34.4 -04:46:00.0 1.77 L G218.15-15.00 06047-1117 06:06:41.4 -11:18:40.0 1.05 L G224.35-2.01 07028 1100 07:05:13.2 -11:04:41.0 0.73 L G224.61-2.56 Z Cma 07:03:43.6 -11:33:06.0 1.02 L G228.99-4.62 CB54 07:04:20.9 -16:23:20.0 0.9 L G356.09+20.75 16191 1936 16:22:04.4 -19:43:26.0 1.57 L |
-
•
Columns (1)–(6) list the source name, other source name from Wu et al. (2004) catalog, corresponding equatorial coordinates, rms noise and mass type (L represents low-mass sources, H represents high-mass sources), respectively