Step Free Energies at Faceted Solid-Liquid Interfaces from Equilibrium Molecular Dynamics Simulations
Abstract
In this work a method is proposed for computing step free energies for faceted solid-liquid interfaces based on atomistic simulations. The method is demonstrated in an application to (111) interfaces in elemental Si, modeled with the classical Stillinger-Weber potential. The approach makes use of an adiabatic trapping procedure, and involves simulations of systems with coexisting solid and liquid phases separated by faceted interfaces containing islands with different sizes, for which the corresponding equilibrium temperatures are computed. We demonstrate that the calculated coexistence temperature is strongly affected by the geometry of the interface. We find that island radius is inversely proportional to superheating, allowing us to compute the step free energy by fitting simulation data within the formalism of classical nucleation theory. The step free energy value is computed to be J/m. The approach outlined in this work paves the way to the calculation of step free energies relevant to the solidification of faceted crystals from liquid mixtures, as encountered in nanowire growth by the vapor-liquid-solid mechanism and in alloy casting. The present work also shows that at low undercoolings the Stillinger-Weber interatomic potential for Si tends to crystallize in the wurtzite, rather than the diamond-cubic structure.
I Introduction
The properties of solid-liquid interfaces are known to play critical roles in governing defect formation and the evolution of microstructural patterns during the solidification of a crystal from its melt.Asta09rev In applications of crystal-growth theories and mesoscale simulation methods to the study of solidification phenomena, quantitative information is often required for the thermodynamic and kinetic properties of solid-liquid interfaces, and the degrees to which these properties vary with crystal orientation. For materials such as metals where crystal-melt interfaces are molecularly rough, the most relevant properties in this context include the magnitude and crystalline anisotropy of the interfacial stiffness and mobility,Asta09rev ; Hoyt2003121 which dictate, respectively, the capillary undercooling at a growing crystal-melt interface, and the relationship between local undercooling and interface velocity. For many crystalline compounds and covalent solids, the degree of crystalline anisotropy in crystal-melt interfacial free energies can be highly pronounced, such that the equilibrium crystal Wulff shape is characterized by faceted orientations. In this case, crystal-growth kinetics are typically strongly influenced by the properties of steps at faceted solid-liquid interfaces.ChernovRev2004 ; Jackson58 For example, the excess free energies and mobilities of these linear defects play critical roles in governing the rate of nucleation and the growth of crystal islands during layer-by-layer growth of faceted crystals, as observed in the synthesis of nanowires by the vapor-liquid-solid mechanism.wagner:89 ; ChernovRev2004 ; Tersoff2011 ; golovin:074301 ; ChernovMRS
Due to the difficulty inherent in performing direct experimental measurements of the thermodynamic and kinetic properties of crystal-melt interfaces, numerous computational approaches have been developed for their calculation within the framework of atomistic simulations.Asta09rev ; Mishin2010 Specifically, for crystal-melt interfaces in systems with molecularly-rough interfaces, equilibriumBroughton86 ; Davidchak00 ; Hoyt01 ; Horbach2012 ; Horbach11epl ; Frolov09jcp ; Frolov10p2 ; Frolov11a ; Morris02a ; davidchack:094710 and non-equilibriumBai05 ; Bai06 ; Baidakov10 molecular-dynamics (MD) and metadynamics Angioletti10 ; Angioletti11 methods have been developed for the calculation of interfacial free energies and associated crystalline anisotropies. Similarly, both equilibrium and non-equilibrium MD methods have been applied in calculations of the magnitude and anisotropies of the mobilities of such interfaces.Asta09rev ; Monk10 ; Hoyt2002 To date, far less simulation work has been devoted to the investigation of faceted crystal-melt interfaces.PhysRevE.78.031605 ; PhysRevE.80.050601 ; buta:074703 ; Henager09 ; PalafoxHernandez20113137 ; Yang20124960 Additionally, the properties of steps at faceted crystal-melt interfaces have been investigated primarily by kinetic Monte-Carlo simulationsBeatty2000 to date. To the best of the authors’ knowledge, only one MD study has been applied to the calculation of step mobilities,buta:074703 and no direct MD calculations of step free energies have yet been published. As a consequence, the molecular-level understanding of the properties of steps at faceted solid-liquid interfaces remains less advanced relative to those for rough crystal-melt interfaces or steps at crystalline surfaces.
In this work we propose a method for the calculation of step free energies at faceted crystal-melt interfaces from equilibrium MD simulations. The approach makes use of simulation geometries involving coexisting solid and liquid phases, separated by a faceted solid-liquid interface containing an island of solid or liquid on an otherwise flat terrace. As described in the next section, the coexistence temperature measured in such simulations is expected to vary with the curvature (radius) of the islands, such that the relationship between radius and the coexistence temperature measured in MD can be used to extract orientation-averaged values of . The approach is illustrated in this work in the application to steps in the Stillinger-Weber model of Si.Stillinger85 The simulation methodology employed in this application is described in Section III, followed by a presentation of results and a summary and discussion in Sections IV and V, respectively. In Section IV we also present results illustrating that the Stillinger-Weber model of Si shows a tendency to crystallize in the wurtzite, rather than the diamond-cubic, structure at relatively low undercoolings. While this finding is not directly relevant to the present study, it is important for the detailed interpretation of simulations of crystallization based on this potential.
II Theoretical Formalism
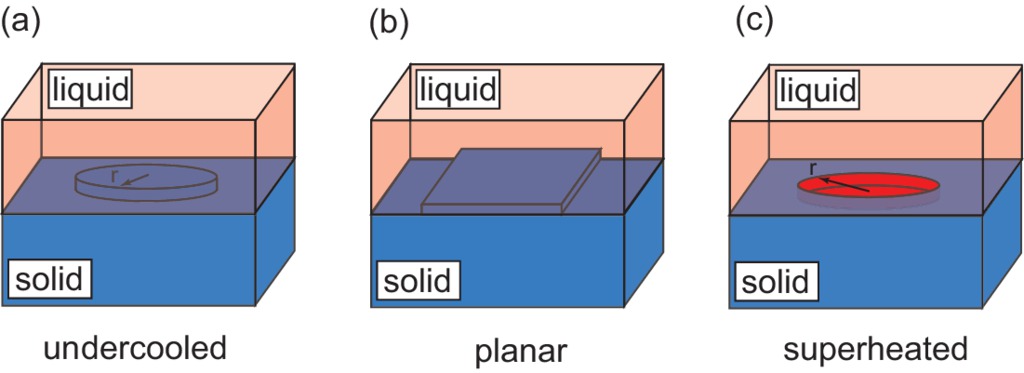
In Fig. 1 we consider three possible geometries of a faceted solid-liquid interface, where terraces of two different “heights” are present, separated by steps. In Figs 1,a and c the geometry corresponds to circular island of solid and liquid phases, respectively. Figure 1,b by contrast shows a situation where terraces of different height are separated by straight steps. When amounts of solid and liquid phases change due to melting or crystallization the length of the step boundary changes in systems with circular geometry, while it remains constant for the planar case. Thus, equilibrium conditions for planar and circular geometries should be different.
We consider in more detail the equilibrium conditions for the systems with a circular island, using the framework of classical nucleation theory (CNT).Pimpinelli ; YukioSaito Consider a circular solid island on a liquid terrace. The free energy of the system relative to a state without an island is given by
| (1) |
where is the difference between the chemical potential in the liquid and solid phases, is the atomic density per unit area of the solid plane that forms the island, and is the radius of the island. The size of the critical nucleus corresponds to a maximum of and is given by:
| (2) |
where we have used , with corresponding to the equilibrium temperature for a planar step geometry and is a heat of melting per atom.Pimpinelli ; YukioSaito According to Eq. (2) a system with a solid island of radius is in equilibrium at temperature given as:
| (3) |
where the capillary length is given as:
| (4) |
Note that, from Eqs. (3) and (4) a solid island has a coexistence temperature below the bulk melting point. By contrast a liquid island has a coexistence temperature above and corresponds to a superheated state. Finally, for the interface geometry with a planar step shown in Fig 1,b the coexistence temperature is simply , which follows from Eq. (3) by taking the limit . Clearly, in the latter case the equilibrium temperature is independent of island size. The formalism discussed above neglects curvature corrections to as well as step interactions and stress effects. However, these effects can in principle be incorporated by appropriate generalizations of the thermodynamic formalism.
The MD approach considered in this work makes use of the thermodynamic formalism described in this section as follows. By performing equilibrium MD simulations in the microcanonical ensemble (NVE), the constraint of fixed total system energy can be used to stabilize the various types of equilibrium states described above. By changing the system energy, islands of different radii can be stabilized and the corresponding system temperature derived. From the relationship between and , the step free energy can then be determined.
III Methodology of atomistic simulations
We demonstrate the approach outlined in the previous section by considering the Stillinger-Weber model of elemental Si.Stillinger85 This model represents one of the simplest classical interatomic potentials that gives rise to faceted solid-liquid interfaces.PhysRevLett.56.155 ; PhysRevB.37.4647 ; PhysRevE.78.031605 Several different values of the melting temperature have been reported for this potential, from simulations with coexisting solids and liquids separated by oriented interfaces, namely: ,buta:074703 PhysRevB.37.4647 and .MorrisSi Unfortunately, it was not possible from these studies to know whether the coexistence conditions corresponded to any of the different types of interface geometries described in Fig. 1, or to a flat terrace with no steps. We note that, in the latter case, the coexistence temperature derived in an MD simulation can be different from the true melting point, since the system can spend a significant amount of time in such a state,Li11 due to the free energy barrier required to nucleate islands of solid or liquid. During this time thermal (uniform temperature) and mechanical equilibrium between the phases can be established, but the phases are not in true equilibrium with respect to phase change fluctuations, i.e. the chemical potentials of the solid and liquid phases are not equal. To enable phase fluctuations on the time scale of MD simulations it is desirable to have preexisting steps at the interface. All equilibrium states implemented in this study satisfy this requirement.
III.1 Simulation block
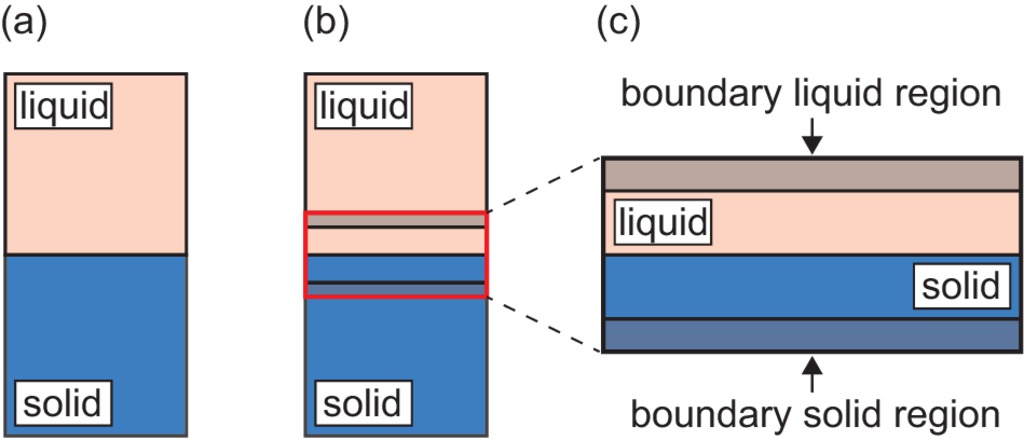
To apply the simulation approach described above, we began by creating a simulation block with diamond-cubic-structured solid and liquid phases as shown schematically in Fig. 2,a. The (111)-oriented solid-liquid interface was perpendicular to the direction of the block. The and directions were parallel to crystallographic directions and of the solid phase, respectively. The phases were equilibrated for several nanoseconds in a microcanonical (NVE) ensemble. In the resulting equilibrated state the dimensions of each phase were approximately cubic. In the next step, we selected a region containing the solid-liquid interface as well as regions of homogeneous solid and liquid phases as shown in Fig. 2,b. Atoms inside the top and bottom layers were designated as boundary regions. The thickness of each boundary layer was 10 Å.
This procedure was used to create several simulation blocks with different sizes. The number of atoms in the resulting systems ranged from 25196 to 226744. The dimensions and parallel to the interface ranged from to nm. The dimension normal to the interface nm was the same in all blocks. Periodic boundary conditions were applied in the and directions. In the directions the boundary conditions were not periodic. The positions of atoms inside the solid boundary region were fixed during the simulations. The top boundary region of liquid atoms moved as a rigid body during the simulations to ensure zero pressure inside the liquid phase below the boundary region.
Such boundary conditions were chosen for two reasons. First, to apply the formalism described in the previous section it is necessary to model only one solid-liquid interface, which is impossible with periodic boundary conditions in the direction. Second, the rigid body boundary condition was chosen over the open liquid surface to isolate the solid-liquid interface from the effect of surface capillary waves and density variations. Thus, the rigid slab of liquid (and solid) mimics an infinitely large homogeneous phase. Due to the use of relatively small lengths in the values of the step energies computed below could be affected by finite-size effects, because we are constraining the phonon spectrum in the crystal and the density oscillations in the liquid near the solid-liquid interface. We emphasize however that the primary purpose of the present work is to demonstrate the adiabatic-trapping methodology for computing step free energies. Finite size effects could be straightforwardly investigated in future studies focused on precise values for specific systems.
III.2 MD simulations
Molecular dynamics simulations were performed using the Large-scale Atomic/Molecular Massively Parallel Simulator (LAMMPS) software package.Plimpton19951 Thermal expansion of solid Si at K was computed from a simulation in an NPT ensemble with zero pressure. Constant temperature and pressure in the simulation were imposed using a Nosé-Hoover thermostatMelchionna93 and an Anderson barostat,Andersen1980 respectively.
Molecular Dynamic simulations of the solid-liquid interface were performed in a microcanonical ensemble (NVE) for times up to 50 ns after 5ns equilibration stage, using a time step of fs. During the simulations and dimensions of the simulation block were kept fixed, with the lattice parameter in the solid part of the block equal to the stress free lattice parameter at K.
During the simulations snapshots of the system were saved every 0.5 ns. The snapshots contained positions of atoms, energies and stresses and were used for post processing. The equilibrium temperature of the simulation was calculated from an average of the kinetic energy over the production stage.
III.2.1 Trapping procedure
In canonical simulations (NVT) solid/liquid islands on liquid/solid terraces are usually not in equilibrium with the rest of the system: subcritical islands shrink, whereas supercritical islands grow to completely cover the terrace. Critical islands correspond to a state of unstable equilibrium. To compute sizes of critical nuclei we employed a trapping procedure used previously in a study of heterogeneous nucleation at grain boundaries.Frolov11a In a finite system and a restricted ensemble (NVE) equilibrium between the island and the rest of the system can be stabilized due to the constraint of constant energy. To achieve a state of a stable equilibrium, fluctuations in the size of the island must produce sufficient changes in temperature of the system. As a consequence the dimension of the simulation block cannot be too large. Also lateral dimensions of the island have to be comparable to and dimensions of the simulation block. For the reasons above, for each size of the simulation block a structure with an island of a size within a certain range had to be carefully prepared. If the size of an island was too small, it could completely disappear by a fluctuation during a 50 ns long simulation. Additionally, a very large island could hit the boundary conditions and change its morphology from circular to planar, thus changing the nature of the equilibrium state.
To prepare a simulation block with a suitable size of an island, the radius of the solid/liquid island on the terrace can be modified by injecting/removing heat into a system. This was achieved by modifying velocities of atoms in the input file and equilibrating the system during a several nanosecond run in the NVE ensemble. We prepared simulation blocks with solid/liquid islands embedded inside the liquid/solid terrace as well as blocks with solid and liquid terraces separated by a planar step boundary. The former states correspond to curved equilibrium with equilibrium temperature depending on the size of the islands, while the later case corresponds to planar equilibrium with temperature independent of the sizes of the terraces.
III.2.2 Data analysis
To analyze the structure of the interface and calculate the sizes of islands it was necessary to identify atoms belonging to solid or liquid phases. This was done using a structural order parameter employed in the previous studies of the Stillinger-Weber Si system.buta:074703 ; PhysRevE.78.031605 ; PhysRevE.80.050601 The calculated order parameter takes values close to 1 inside solid phase and 0 inside liquid phase. A threshold value of the order parameter was calculated as an average of the values inside solid and liquid phases. Atoms with the value of the order parameter higher than this threshold value were identified as solid, while all other atoms were identified as liquid.
The structure of the solid-liquid interface was analyzed by identifying isolated solid/liquid islands on the liquid/solid terrace. For each atom belonging to solid/liquid phase a list of the nearest neighboring atoms of the same phase were constructed. Then a random walk through neighboring atoms was implemented in the following way. First, a random atom of a given phase was selected and assigned a cluster number. Second, its neighbor belonging to the same phase was randomly selected and assigned the same cluster number. Thus, repeating the procedure all atoms belonging to one cluster can be identified. The procedure was previously employed to identify clusters in a binary liquid.Frolov10prl The largest island identified represents the nucleus, while all other islands are fluctuations containing only a few atoms. These small islands are present in the structure of the terrace at a given temperature.PhysRevE.78.031605
Our cluster analysis of the interface allows us to calculate the center of mass of the largest island on the terrace. To compute an average size and shape of the island we average the atomic density of the instantaneous islands relative to instantaneous centers of mass. Once the average atomic density is computed, the radius of an island is calculated as a distance from the center of mass to the point where the average density value is equal half of the density of solid (111) layer.
IV Results
IV.1 Interface Geometries
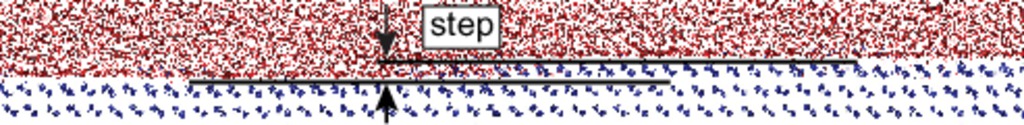
Fig. 3 shows a cross-sectional view of a region of a solid-liquid interface containing a step separating two terraces of different heights. Atoms belonging to the liquid phase are colored in red, while solid atoms appear in blue. The crystallographic direction in the solid phase is normal to the plane of the figure. The top solid plane is incomplete and forms a step boundary with the liquid terrace. The height of the step is equal to the bilayer spacing of the diamond-cubic structure along the direction.
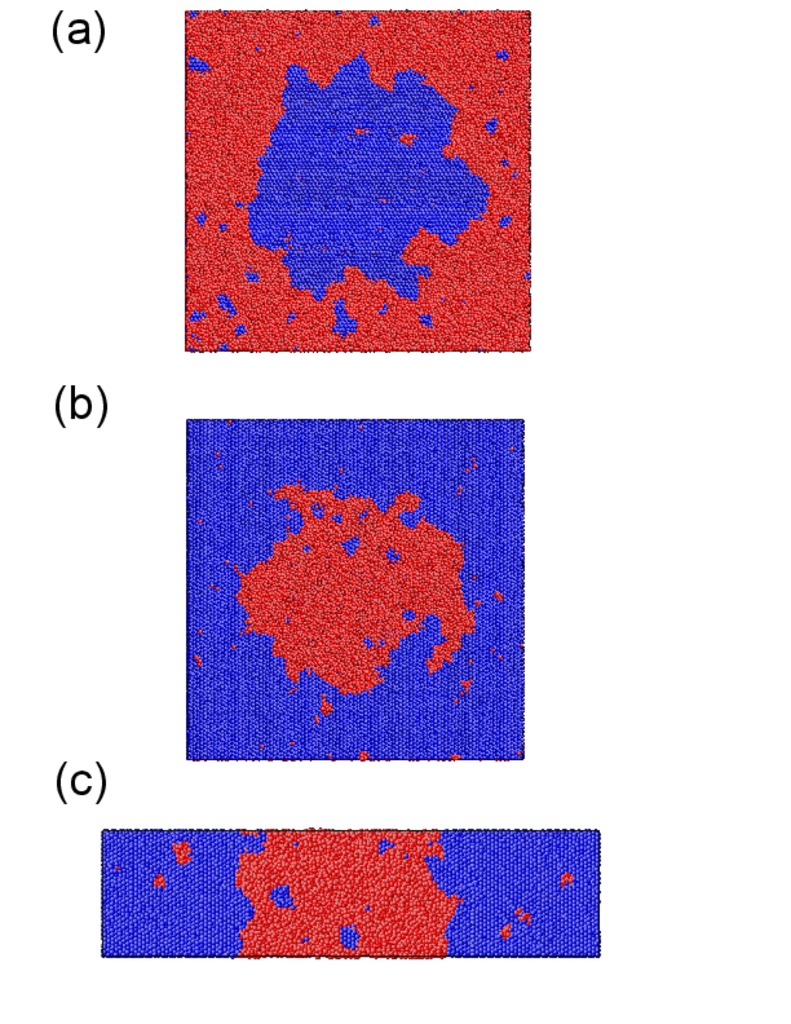
Fig. 4 shows plan views of snapshots from the equilibrium configurations of faceted (111) solid-liquid interfaces with different island geometries. Figs 4,a and b represent curved equilibrium states of a solid island on a liquid terrace, and liquid island on a solid terrace, respectively. Both simulation blocks have the same size with lateral dimensions of nm. These snapshots illustrate that the instantaneous structure of the step is extremely rough, with the shape of the island being quite complicated and characterized by “overhangs” and large deviations from a perfect circular geometry. The equilibrium temperatures calculated for these solid and liquid islands were K and K, respectively. Thus, for the same size of the simulation block the calculated equilibrium temperature was not the same due to the difference in geometry of the atomic layer at the solid-liquid interface.
Fig. 4 c shows a plan-view snapshot illustrating the equilibrium state of the interface with a planar geometry of the steps at the calculated temperature K. The dimension normal to the solid-liquid interface was the same as in all other blocks studied. The lateral dimensions were nm2 parallel to the and axis respectively. The simulation block contains two step boundaries. This geometry with one dimension of the simulation block smaller than the other is more advantages for simulations of planar-step equilibrium. It ensures that the liquid or solid part of the interface layer does not transform into an isolated island with circular boundaries during a long simulation. Simulations with planar step geometries were also performed for systems with lateral periodic dimensions of nm2 and nm2. Identical equilibrium temperatures were calculated for these blocks within the statistical accuracy of the simulations, as discussed in further detail below.
IV.1.1 Wurtzite Formation
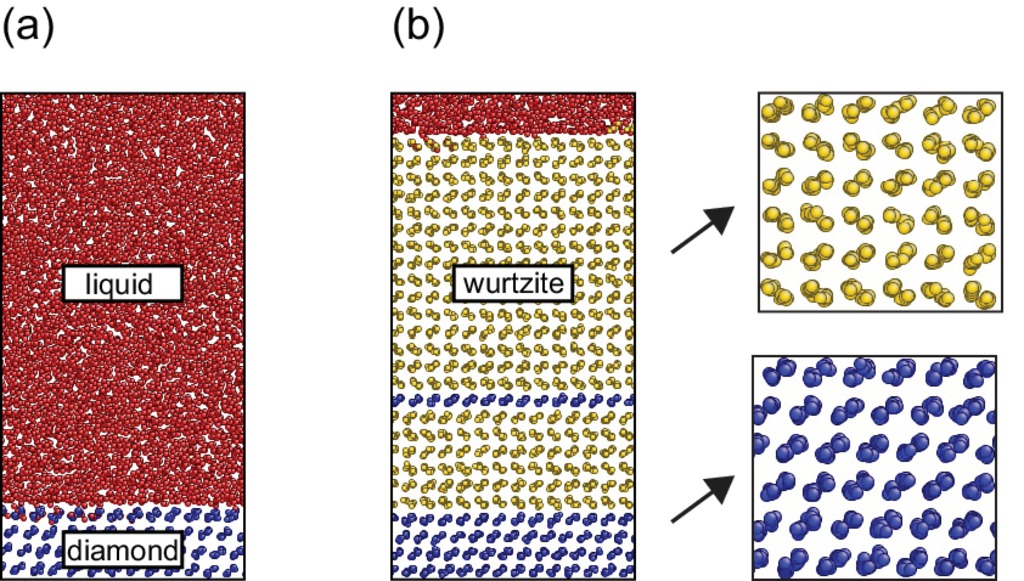
In the simulations with solid circular islands in a liquid terrace we observed nucleation of new islands showing a registry with the underlying solid layer corresponding to the wurtzite, rather than the diamond cubic structure. These new “wurtzite” islands were observed to grow and consume the preexisting “diamond” islands. After this transformation the islands were observed to remain in the wurtzite state. Previous MD simulations of solidification with oriented solid-liquid interfacesPhysRevB.37.4647 and of isolated solid nucleiBeaucage05 reported that the Stillinger-Weber Si potential solidifies in a random mixture of stacking sequences. These simulations modeled large undercoolings, and the observations could be a consequence of rapid solidification kinetics. To investigate this issue further, we performed a separate simulation of solidification at 1670 K (~12K undercooling) in the NPzT ensemble, featuring fully periodic boundary conditions with fixed area parallel to the interface and dynamic periodic lengths normal to the interface to ensure zero normal stress. The simulation block had dimensions nm3, with two (111) solid-liquid interfaces normal to the direction. Figs. 5,a and b show the initial state of the simulation block with the solid phase in the diamond structure and the simulation block after 110 ns long simulation, respectively. The liquid phase crystallized into wurtzite phase. Only one out of 32 newly grown (111) layers was observed to have the diamond-cubic stacking sequence.
The observation of the nucleation and growth of the wurtzite structure during simulations at low undercoolings is likely an artifact of the Stillinger-Weber potential. Specifically, due to its short cutoff distance the potential gives identical zero-temperature energies for the diamond and wurtzite structures.Beaucage05 The wurtzite phase may appear during solidification for two reasons. First, it may be more stable than the diamond phase at high temperatures, which means that it would have a higher melting point. Second, the liquid may crystallize into wurtzite due to purely kinetic effects. For example, if the step free energy of a wurtzite island is lower than that of a diamond island, a monolayer of wurtzite will nucleate first. At high undercoolings nucleation barriers for diamond and wurtzite structures become nearly zero and the nucleated structure is determined by random fluctuations. As a result, it is understandable that at large undercoolings random sequence of these two phases can be observed.PhysRevB.37.4647 The melting point of the wurtzite phase was calculated using simulation blocks with planar geometries for the steps and was found to be K, which is nearly identical with that of the diamond phase. Therefore, the second scenario, involving kinetic stabilization of the wurtzite phase, is more consistent with our simulation results.
IV.2 Island Radius versus Temperature and Step Free Energy
Because of the diamond to wurtzite transformation we were unable to calculate the relationship between island radius () and temperature () for diamond-cubic solid islands on the liquid terrace. Accurate equilibrium temperature calculations require tens of nano-seconds of sampling time and we were unable to accumulate the necessary statistics before transformations to the wurtzite structure occurred. In the simulations with liquid islands on solid terrace, nucleation of wurtzite islands is unfavorable because the temperature of the simulation is higher then the meting point of the wurtzite phase. As a result we were able to model liquid islands for any desired period of time to compute the relationship between and .
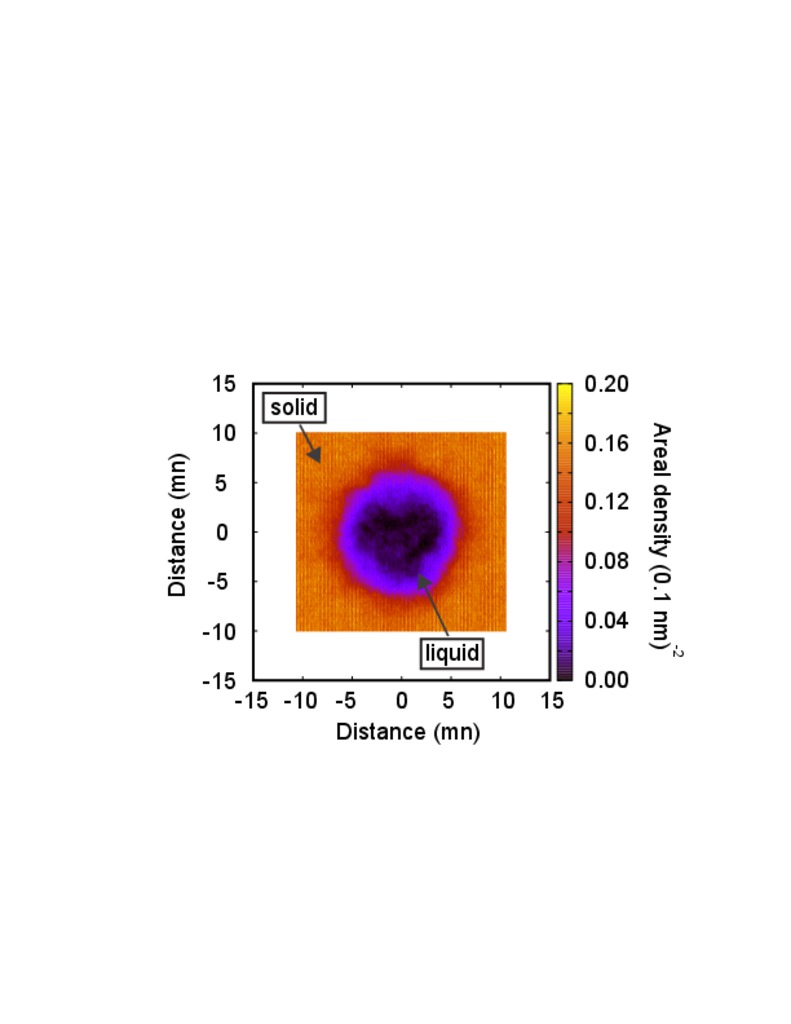
Fig. 6 demonstrates an average equilibrium shape of a liquid island on solid terrace at K. The shading in the image corresponds to the average density of solid atoms, as indicated in the legend. The solid-atom density inside the island is nearly zero, while it is close to the areal density of a (111) solid plane away from the island. The thickness of the transition region where the density changes between these limiting values is about 5 nm, which is comparable with the radius of the island in Fig. 6. While the instantaneous shapes of the island are very complicated (c.f., Fig. 4 a and b) the average shape shown in Fig. 6 appears to be almost perfectly circular. Roughness of the step as well as instantaneous deviations from the circular shape and size fluctuations all contribute to the broadening of this region. While the first two processes are most likely to be the dominant ones, the third process is always present and strongly affected by the size of the block and the island.
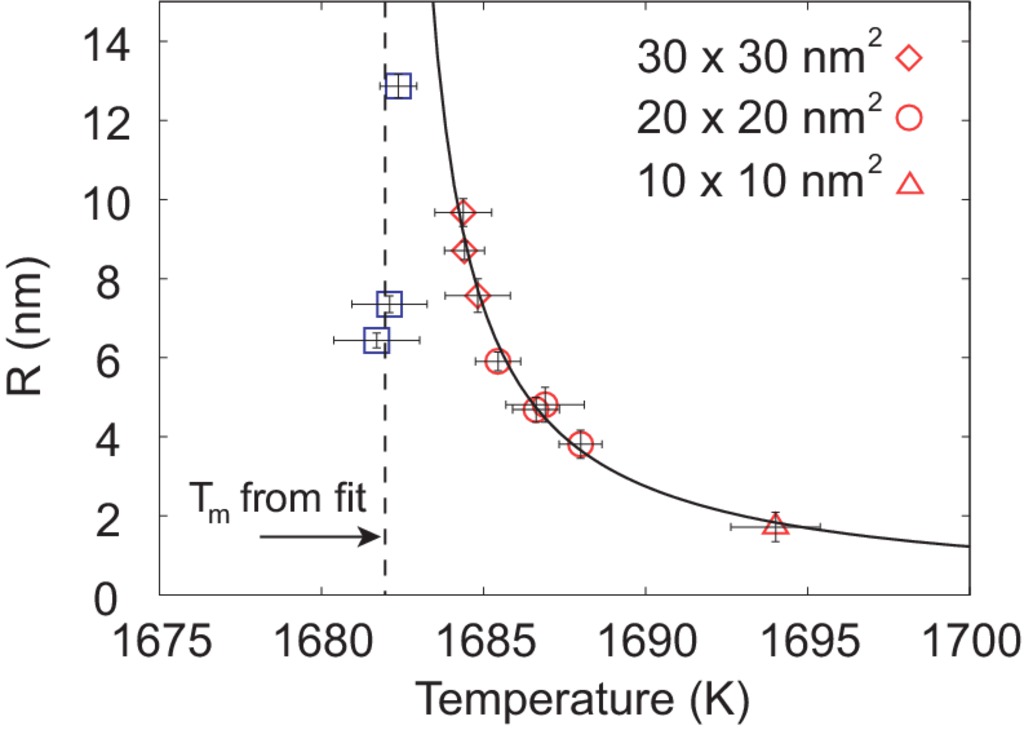
Fig. 7 summarizes calculations of the equilibrium island radius and corresponding equilibrium temperatures. The discrete points on the figure correspond to individual MD simulations. Squares correspond to simulations having steps with planar geometry (e.g., Fig. 4,c), while other symbols represent simulations of isolated liquid islands on a solid terrace (e.g., the geometry shown in Figs. 4,b and 6). The continuous lines on the plot were obtained by fitting the curved equilibrium data points with Eq. (2) using and as fitting parameters. The data points with planar step geometry were not included in the fitting. The excellent agreement between the fit and the discrete data points allows us to conclude that equilibrium island radius is inversely proportional to . The melting point obtained from the fit was K, which is identical within statistical uncertainties with the equilibrium melting temperature calculated directly from MD simulations with planar step geometries: K, computed as an average over the three independent simulations with different sizes.
Using the data for latent heat of melting for Stillinger-Weber Si, kJ/mole ( J/atom),MorrisSi the areal atomic density of the (111) plane m-2, and the value of the melting point given in the previous paragraph, we calculate from the fit shown in Fig. 7 a value for the step free energy of J/m, where the error bar was determined from the fitting. Dividing this value by the (111) interplanar distance Å, we obtain a value for the so-called perimeter free energyMullins2000 of J/m 2. The perimeter free energy has units of energy per unit area and can be compared with solid-liquid interface free energy.
The solid-liquid interface free energies for Stillinger-Weber Si calculated using the cleaving techniqueApte08 for (100), (111) and (110) orientations are , and J/m2 respectively. These values are approximately an order of magnitude larger than the perimeter free energy quoted above. Similarly, multiplying the interface free energy by the thickness of one (111) monolayer would give an estimate for of J/m, which is an order of magnitude larger than the step free energy calculated by MD in the present work.
V Discussion and conclusions
In this work we presented a method for MD calculations of the free energies of steps of faceted solid-liquid interfaces. The approach makes use of simulations in which the faceted interface contains islands with curved steps of differing radii. For a range of island radii the coexistence temperature is derived from equilibrium MD simulations and the resulting relationship between and is used to back out .
The approach was demonstrated in an application to (111) faceted interfaces in the Stillinger-Weber model of elemental Si. We simulated interfaces with planar geometries of the steps as well as shapes of islands that were circular on average. In the later case, there were two different states, corresponding to a solid island in a liquid terrace, or a liquid island in a solid terrace. We demonstrated that the calculated equilibrium temperature depends on structure of the interface. When the step separating solid and liquid parts of the interface is planar, the calculated equilibrium temperature K was found to be remarkably consistent and independent of the size of the islands. In the case of equilibrium with a circular island geometry, the island radius was found to be inversely proportional to .
The island size dependence on equilibrium temperature allowed us to compute step free energy . The calculated step free energy is an order of magnitude smaller than the product of interface free energy and thickness of a (111) monolayer. The difference between the two quantities is not surprising. When a faceted interface undergoes a roughening transition, the step free energy becomes zero, while solid-liquid interface free energy generally remains finite. Therefore, these two properties are not directly related. Large island shape fluctuations observed in MD and the roughness of the step structures correlate with small value of the step free energy, and indicates that the interface may not be far from a roughening transition.
A relatively wide range of equilibrium temperatures have been reported in the literature for coexistence simulations with (111) oriented interface. Our simulations provide an insight why, in general, this should be the case. The equilibrium temperatures calculated in this work ranged from 1682 K to 1695 K, depending on the exact nature of the interface geometry. This range would actually be twice large, if we include the undercooled branch where quantitative analysis of the data was not possible due to the formation of layers with wurtzite stacking. The current results thus illustrate that variations of equilibrium temperature within 26 K range are possible when simulating solid-liquid systems separated by the faceted (111) interface. During solid-liquid coexistence simulations with (111) interfaces with large bulk phases, the interface geometry may transition by fluctuations between undercooled, planar or superheated states. The interface can also adopt a geometry when the interface layer is complete (state with no step) and spend a significant amount of time trapped in this metastable state. As a result, depending on the initial conditions, amounts of phases and time of calculations, the resulting average temperature may deviate significantly from the true melting temperature. This study shows that for a consistent calculation of using the coexistence approach, for systems with faceted interfaces, an interface with a planar geometry of a step is desirable.
The approach of modeling of plane and curved equilibrium islands to extract values of step free energies can be extended to multicomponent systems. In the later case MD simulations in an NVT ensemble or constant composition Monte CarloStukowski2012 simulations are more appropriate. The stability of the island is maintained by constant average composition in the system, rather than a constant energy constraint. Performing a series of isothermal calculations at different temperatures, one could recover the dependence of the step free energy on composition/temperature. This dependence is an important ingredient in understanding and mesoscale modeling of layer-by-layer growth in the context of important technological processes such as nanowire growth by the vapor-liquid-solid mechanism. For example, in applications of such an approach to Si in contact with a eutectic Au-Si melt, the equilibrium temperatures probed in the simulations would be significantly lower than melting point of elemental Si. It is possible, that the step structure will not be as rough as than observed in the present simulation. Specifically, it is possible that the steps would become significantly straighter, such that the islands would develop “polygonal” shapes, using the terminology from Ref. ChernovMRS . Investigation of equilibrium shape of such islands and their evolution during growth would be of fundamental interest.
Finally, this work points to an important shortcoming of the Stillinger-Weber potential in modeling crystal growth in Si. Due to the small radius of interaction, the potential does not differentiate between the diamond and the wurtzite structures, and the energies of these structures are identical at zero temperature.Beaucage05 In the present simulations we observed that at low undercoolings the liquid crystallizes into the wurtzite structure, and interfacial islands with diamond stacking are unstable with respect to growth of islands with wurtzite stacking. The appearance of the wurtzite phase is often observed during nano-wire growthPhysRevLett.99.146101 and can be due to a difference in step free energies. It is possible that at different undercoolings the liquid would crystallize into phases are that are metastable in the bulk for kinetic reasons. To explore this issue further for growth of Si crystals would be of great interest, but for such purposes it would be desirable to employ a potential that better describes the relative energetics of the competing diamond and wurtzite phases.
Acknowledgements.
This research was supported by the US National Science Foundation under Grant No. DMR-1105409. Use was made of computational resources provided under the Extreme Science and Engineering Discovery Environment (XSEDE), which is supported by National Science Foundation grant number OCI-1053575. T.F. was also funded by the Miller Institute.References
- (1) M. Asta, C. Beckermann, A. Karma, W. Kurz, R. Napolitano, M. Plapp, G. Purdy, M. Rappaz, and R. Trivedi, Acta Mater. 57, 941 (2009).
- (2) J. Hoyt, M. Asta, and A. Karma, Materials Science and Engineering: R: Reports 41, 121 (2003).
- (3) A. Chernov, Journal of Crystal Growth 264, 499 (2004), Proceedings of the Symposium - Progress in Crystal Growth.
- (4) K. Jackson, Growth and Perfection of Growth and Perfection of Crystals, chapter Interface structure, pages 319–323, Chapman and Hill, London, 1958.
- (5) R. S. Wagner and W. C. Ellis, Applied Physics Letters 4, 89 (1964).
- (6) C.-Y. Wen, J. Tersoff, K. Hillerich, M. C. Reuter, J. H. Park, S. Kodambaka, E. A. Stach, and F. M. Ross, Phys. Rev. Lett. 107, 025503 (2011).
- (7) A. A. Golovin, S. H. Davis, and P. W. Voorhees, Journal of Applied Physics 104, 074301 (2008).
- (8) A. Chernov, J. Yoreo, L. Rashkovich, and P. Vekilov, MRS Bulletin 29, 927 (2004).
- (9) Y. Mishin, M. Asta, and J. Li, Acta Materialia 58, 1117 (2010).
- (10) J. Q. Broughton and G. H. Gilmer, J. Chem. Phys. 84, 5759 (1986).
- (11) R. L. Davidchack and B. B. Laird, Phys. Rev. Lett. 85, 4751 (2000).
- (12) J. J. Hoyt, M. Asta, and A. Karma, Phys. Rev. Lett. 86, 5530 (2001).
- (13) A. Härtel, M. Oettel, R. E. Rozas, S. U. Egelhaaf, J. Horbach, and H. Löwen, Phys. Rev. Lett. 108, 226101 (2012).
- (14) Rozas, R. E. and Horbach, J., EPL 93, 26006 (2011).
- (15) T. Frolov and Y. Mishin, The Journal of Chemical Physics 131, 054702 (2009).
- (16) T. Frolov and Y. Mishin, Phys. Rev. B 82, 174114 (2010).
- (17) T. Frolov and Y. Mishin, Phys. Rev. Lett. 106, 155702 (2011).
- (18) J. R. Morris, Phys. Rev. B 66, 144104 (2002).
- (19) R. L. Davidchack, J. R. Morris, and B. B. Laird, The Journal of Chemical Physics 125, 094710 (2006).
- (20) X. M. Bai and M. Li, J. Chem. Phys. 123, 151102 (2005).
- (21) X. M. Bai and M. Li, J. Chem. Phys. 124, 124707 (2006).
- (22) V. G. Baidakov, A. O. Tipeev, K. S. Bobrov, and G. V. Ionov, J. Chem. Phys. 132, 234505 (2010).
- (23) S. Angioletti-Uberti, M. Ceriotti, P. D. Lee, and M. W. Finnis, Phys. Rev. B 81, 125416 (2010).
- (24) S. Angioletti-Uberti, Journal of Physics: Condensed Matter 23, 435008 (2011).
- (25) J. Monk, Y. Yang, M. I. Mendelev, M. Asta, J. J. Hoyt, and D. Y. Sun, Modelling and Simulation in Materials Science and Engineering 18, 015004 (2010).
- (26) J. Hoyt, M. Asta, and A. Karma, Interface Science 10, 181 (2002).
- (27) D. Buta, M. Asta, and J. J. Hoyt, Phys. Rev. E 78, 031605 (2008).
- (28) T. Haxhimali, D. Buta, M. Asta, P. W. Voorhees, and J. J. Hoyt, Phys. Rev. E 80, 050601 (2009).
- (29) D. Buta, M. Asta, and J. J. Hoyt, The Journal of Chemical Physics 127, 074703 (2007).
- (30) C. Henager and J. R. Morris, Phys. Rev. B 80, 245309 (2009).
- (31) J. P. Palafox-Hernandez, B. B. Laird, and M. Asta, Acta Materialia 59, 3137 (2011).
- (32) Y. Yang, D. L. Olmsted, M. Asta, and B. B. Laird, Acta Materialia 60, 4960 (2012).
- (33) K. M. Beatty and K. A. Jackson, Journal of Crystal Growth 211, 13 (2000).
- (34) F. H. Stillinger and T. A. Weber, Phys. Rev. B 31, 5262 (1985).
- (35) A. Pimpinelli and J. Villain, Physics of Crystal Growth, Cambridge Univ Pr, 1999.
- (36) Y. Saito, Statistical Physics Of Crystal Growth, World Scientific Pub Co Inc, 1996.
- (37) U. Landman, W. D. Luedtke, R. N. Barnett, C. L. Cleveland, M. W. Ribarsky, E. Arnold, S. Ramesh, H. Baumgart, A. Martinez, and B. Khan, Phys. Rev. Lett. 56, 155 (1986).
- (38) W. D. Luedtke, U. Landman, M. W. Ribarsky, R. N. Barnett, and C. L. Cleveland, Phys. Rev. B 37, 4647 (1988).
- (39) S. Yoo, X. C. Zeng, and J. R. Morris, The Journal of Chemical Physics 120, 1654 (2004).
- (40) A. Kushima, J. Eapen, J. Li, S. Yip, and T. Zhu, The European Physical Journal B - Condensed Matter and Complex Systems 82, 271 (2011).
- (41) S. Plimpton, Journal of Computational Physics 117, 1 (1995).
- (42) S. Melchionna, G. Ciccotti, and B. Lee Holian, Molecular Physics 78, 533 (1993).
- (43) H. C. Andersen, The Journal of Chemical Physics 72, 2384 (1980).
- (44) T. Frolov and Y. Mishin, Phys. Rev. Lett. 104, 055701 (2010).
- (45) P. Beaucage and N. Mousseau, Phys. Rev. B 71, 094102 (2005).
- (46) W. W. Mullins and G. S. Rohrer, Journal of the American Ceramic Society 83, 214 (2000).
- (47) P. A. Apte and X. C. Zeng, Applied Physics Letters 92, 221903 (2008).
- (48) B. Sadigh, P. Erhart, A. Stukowski, A. Caro, E. Martinez, and L. Zepeda-Ruiz, Phys. Rev. B 85, 184203 (2012).
- (49) F. Glas, J.-C. Harmand, and G. Patriarche, Phys. Rev. Lett. 99, 146101 (2007).
- (50) J. Li, Modelling Simul. Mater. Sci. Eng. 11, 173 (2003).