11email: wkollat@astro.physik.uni-goettingen.de
The shape of broad-line profiles in AGN
Abstract
Aims. We present a study of the broad optical/UV emission line profiles in AGN (active galactic nuclei) to get information on the dominant velocity components (turbulence, rotation, etc.) in the central broad-line region (BLR).
Methods. We introduce line broadening simulations of emission line profiles and compare these results with the largest homogeneous data set of reverberation-mapped AGN.
Results. The underlying broad-line profiles in AGN are Lorentzian profiles caused by turbulence in the line emitting region. The turbulent velocities are different for the different line emitting regions of H, H, Ly, C iii] , He ii , and Si iv . The turbulent velocities go from 400 for H up to 3,800 for Ly+N v . The dominating broadening mechanism of these profiles is broadening due to rotation. The rotation velocities causing the line profile broadening go from 500 up to 6,500 . Here we present interrelations between observed emission line widths (FWHM) and their related rotational velocities to correct for the contribution of the turbulence to the broad-line profiles.
Key Words.:
Accretion, accretion disks – Line: profiles – Galaxies: Seyfert – Galaxies: active – Quasars: emission lines1 Introduction
It is now generally accepted that a super-massive black hole in the center of active galactic nuclei (AGN) is surrounded by an accretion disk (e.g. Urry & Padovani urry95 (1995)). In the outer regionsof the accretion disk, the broad emission lines are created by photoionization. However, many details of this line emitting region are unknown, and there are many models that treat their geometry and structure (e.g. Collin-Souffrin et al. collin88 (1988), Emmering et al. emmering92 (1992), Königl & Kartje koenigl94 (1994), Murray & Chiang murray97 (1997), Elvis elvis00 (2000), Kollatschny 2003a , Ho ho08 (2008), Gaskell gaskell10 (2010), Goad et al. goad12 (2012) and references therein). This broad-line region is spatially not resolved on direct images.
Information on the structure and kinematics of this region can in principle be obtained from the broad emission line profiles. However, there is the ambiguity in the possibility that different geometries and different kinematics result in emission line profiles that have similar shapes. This problem makes it difficult to disentangle the profile contribution of individual parameters (e.g. Netzer netzer90 (1990), Sulentic et al. sulentic00 (2000), Zamfir et al. zamfir10 (2010), and references therein). The shape and the width of the emission line profiles in AGN might depend, among others parameters, on the velocity field, on the geometry of the line emitting gas, on obscuration effects, on the superposition of line emission from different regions, and on the isotropy/anisotropy of the line emission.
The velocity field might be a superposition of different components, such as Doppler motions, turbulence, shock components, in/outflow components, and rotation. Different velocity components result in different profiles, and the final profile is a convolution of different components. Doppler motions in the gravitational potential of a central black hole can result in Gaussian profiles, where the width of the lines reflects the Doppler motion of the line emitting gas (Peterson & Wandel peterson99 (1999), Fromerth & Melia fromerth00 (2000), Peterson & Wandel, peterson00 (2000)). Logarithmic profiles agree well with observations of emission line wings and can be produced by outflowing gas (e.g. Blumenthal & Mathews blumenthal75 (1975), Netzer netzer90 (1990)). The existence of Lorentzian profiles is consistent with emission from extended accretion disks (Veron-Cetty et al. veron01 (2001), Sulentic et al. sulentic02 (2002)). Goad et al. (goad12 (2012)) demonstrate that turbulent motions in the outer accretion disk produce Lorentzian profiles. Furthermore, Lorentzian profiles might be explained by shock breakouts in dense winds (Moriya & Tominaga moriya12 (2012)). In addition to these base-line profiles, both rotation and electron scattering (e.g. H in NGC 4593; Laor laor06 (2006)) can lead to broadening of the line profiles.
Osterbrock pointed out as early as osterbrock78 (1978) that a combination of turbulence with rotation agrees well with the distribution of observed line widths of Seyfert 1 galaxies known at that time. More recently, researchers have explored the possibility of an additional net infall component (Gaskell gaskell10 (2010) for a review, Hu et al. hu12 (2012); but see Sulentic et al. sulentic12 (2012)) and an additional outflow component in luminous AGNs (e.g. Wang et al. wang11 (2011)).
The contribution of the velocity components might be different from line to line, as well as from galaxy to galaxy. In their study of AGN line profiles Robinson et al. (robinson95 (1995)) demonstrated that different types of models produce similar kinds of profiles and that the profile shapes differ between the AGN populations. In addition, the optical and UV emission line profiles are similarly diverse in appearance. In an investigation of broad emission lines from the Sloan Digital Sky Survey (SDSS) Richards et al. (richards02 (2002)) point out that the explanation of their profiles is one of the most important tasks of future AGN models. Using CIV emission line profiles, Richards et al. (richards11 (2011)) show that the differences in the accretion disk wind between quasars can account for some of the diversity of broad emission line profiles.
We demonstrated in a first paper (Kollatschny & Zetzl kollatschny11 (2011), hereafter called Paper I) that there is a general trend between the full-width at half maximum (FWHM) and the line width ratio FWHM/ in the broad emission lines of AGN. Different emission lines exhibit different systematics in the FWHM/-vs-FWHM diagram. The line width FWHM reflects the rotational motion of the broad-line gas in combination with the associated turbulent motion. This turbulent velocity is different for the different emission lines.
Here we present a further study of additional broad optical and UV emission line profiles of reverberation-mapped AGN. The line profiles are parameterized by the ratio of their full-width at half maximum (FWHM) to their line dispersion .
2 Data: The line profile sample
We studied in detail the mean profiles, as well as the root-mean-square (rms) profiles of the H, He ii , and C iv lines of an AGN sample in Paper I. This set of observations is the largest homogeneous sample of variable AGN at this time, and it is based on reverberation-mapped AGN spectra (Peterson et al., peterson04 (2004)). The optical spectra were collected with different ground based telescopes while the UV spectra were taken with the IUE satellite and the Hubble Space Telescope. The sample has the advantage that all the spectra were reduced in exactly the same way and that all spectra of each galaxy were inter-calibrated with respect to each other. The original AGN sample consists of 37 objects. In some cases multiple line spectra exist for a particular galaxy based on different variability campaigns of the same galaxy.
The present study is based on this data set as well. Here we analyze all the remaining optical and UV broad-line profiles we did not consider in Paper I, i.e., the H, H, Ly, He ii , C iii] , and S iv lines.
Usually the observed broad-line profiles in AGN are more or less contaminated by additional narrow emission line components from the narrow line region. For avoiding any major ambiguity we only inspected the root-mean-square (rms) line profiles out of the sample of Peterson (peterson04 (2004)) as we did in Paper I. The rms profiles display the clean profiles of the variable broad emission lines. The narrow line components disappear in these spectra because they are constant on time scales of years. The optical and UV emission line profiles of our AGN sample are parameterized by their line widths (FWHM, and ). The relationship between FWHM and contains information on the shape of the profile. We use all those line profiles of the sample that were regarded as both reliable and less so by Peterson (peterson04 (2004)) - same as in Paper I.
All spectral data we are using in this current investigation are listed in Table 1. We present H, H, Ly, C iii] , Si iv , and He ii line widths (FWHM) and line width ratios (FWHM/) of all galaxies in the AGN sample.
| Object | Line | FWHM | FWHM/ | |
|---|---|---|---|---|
| [km s-1] | [km s-1] | |||
| PG1229+204 | H | |||
| PG0844+349 | H | |||
| PG0052+251 | H | |||
| PG0953+414 | H | |||
| PG1307+085 | H | |||
| PG2130+099 | H | |||
| PG1226+023 | H | |||
| PG0804+761: | H | |||
| PG1211+143: | H | |||
| PG0844+349 | H | |||
| PG1426+015 | H | |||
| PG1229+204 | H | |||
| PG1617+175 | H | |||
| PG1411+442 | H | |||
| PG0026+129 | H | |||
| PG0804+761 | H | |||
| PG2130+099 | H | |||
| NGC4151 | H | |||
| NGC4593 | H | |||
| NGC7469 | H | |||
| NGC3516 | H | |||
| NGC3227 | H | |||
| PG0052+251: | H | |||
| NGC4151: | H | |||
| PG1211+143: | H | |||
| PG1226+023: | H | |||
| PG1307+085: | H | |||
| Mrk279: | H | |||
| NGC5548: | H | |||
| Fairall9 | Ly | |||
| 3C390.3 | Ly | |||
| 3C390.3: | Ly | |||
| NGC5548 | C iii] | |||
| NGC5548 | C iii] | |||
| NGC7469 | Si iv | |||
| NGC3783 | Si iv | |||
| NGC5548 | Si iv | |||
| NGC5548 | Si iv | |||
| NGC7469 | He ii | |||
| NGC3783 | He ii | |||
| NGC5548 | He ii | |||
| NGC5548 | He ii | |||
3 Results
The following are the
emission line profiles resulting from various kinematical and
dynamical models
that have been discussed in the context of the BLR in AGNs:
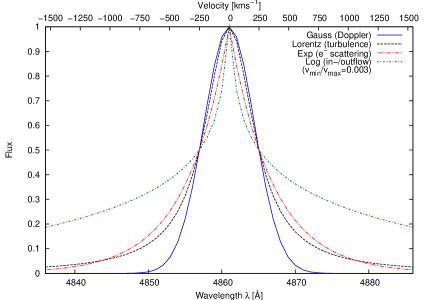
- Gaussian profiles due to Doppler motions:
FWHM/;
- Lorentzian profiles due to turbulent motions:
FWHM/);
- Exponential profiles caused by electron scattering:
FWHM/;
- Logarithmic profiles caused by in-/outflow motions:
FWHM/).
We present in Fig. 1 all these emission line profiles scaled to the same
H line width (FWHM).
The exact mathematical value of FWHM/ goes to zero for
Lorentzian profiles because of the infinitely extended wings
(see Fig. 1). However, the typical FWHM/ values we are measuring
are on the
order of one when integrating the spectral lines over a few hundred Angstroms.
Similarly the exact FWHM/ value for logarithmic profiles
cannot be calculated because the central intensity goes to infinity.
See also discussions of this ratio in
Peterson et al. (peterson04 (2004)), Collin et al. (collin06 (2006)), and
Goad et al. (goad12 (2012)).
In Fig. 2 we again show the basic logarithmic H profile for / = 0.003, as well as more line profiles generated by expanding spherical shells of radiatively-driven isotropically emitting clouds with different / values ranging from 0.01 up to 0.9999 (see also Capriotti et al. capriotti80 (1980)).
3.1 Line profile broadening simulations
We are trying to find appropriate answers to the following questions with our present investigation of AGN emission line profiles: which line profile is emitted intrinsically and what broadening mechanisms (besides the instrumental broadening) have an impact on the observed profile. Lorentzian emission line profiles and/or Gaussian profiles are the most accepted profiles that are thought to be emitted intrinsically.
We showed in Paper I that rotational line broadening is indeed the most important broadening parameter for AGN emission line profiles. We calculated the rotational line broadening by the convolution of Lorentzian or Gaussian profiles with ellipsoidal profiles. The rotational velocity is by definition the half width at zero intensity (HWZI) of an ellipsoidal profile
| (1) |
In Paper I we used a numerical code that was developed by
Hubeny et al. (hubeny94 (1994)) to compute the
line broadening due to rotation. This program
considers limb darkening as well.
In the present study we use our own routine without limb darkening
that is based on the following broadening formula:
| (2) |
(Unsoeld, unsoeld55 (1955)), where W is the intrinsic line profile without rotational broadening, A the rotational profile, and S the convolved profile.
Other intrinsic line profiles and other broadening mechanisms than rotation lead to different profile shapes. We computed these profile shapes as well and compared them with observed AGN profiles.
Figures 3 and 4 show computed Lorentzian profiles that were broadened by rotational motions. The rotation velocities range from 100 to 8,000 . For the intrinsic H Lorentzian profile we adopted a turbulent velocity of 500 (see Paper I) in the line emitting region (Fig. 3). For the intrinsic Lorentzian profile of the C iv line we adopted a turbulent velocity of the line emitting region of 3,000 (Fig. 4). We present additional line broadened profiles in Figs. 5 and 6. In Fig. 5 we made the assumption that the intrinsic H profile is a Gaussian profile (FWHM = 500 ) that is broadened by rotation as in Fig. 3. Figure 6 demonstrates the line broadening of a Lorentzian H profile owing to Doppler motions (convolution with a Gaussian profile). In all cases we made the assumption that the integrated line intensities remain constant.
3.2 Observed and modeled line width ratios FWHM/ versus line width FWHM.
In the next step we present a comparison of the observed line profile shapes in different AGN spectra with computed line profiles.
3.2.1 Rotational line broadening of Lorentzian H, He ii , C iv profiles
In Paper I (their Figs. 1-3) we showed the observed H, He ii , and C iv line width ratios FWHM/ versus their line width FWHM in AGN. These line width data were taken from the sample of Peterson et al. (peterson04 (2004)). We likewise included those measurements that were regarded as less reliable by the authors because they follow exactly the same trend.
We modeled the observations by rotationally broadened
Lorentzian profiles.
We present in Fig. 7 the observed ratios
FWHM/ vs. FWHM
for the H, He ii , and
C iv profiles
in one single plot, as well as their modeling
with our new routine.
The rotational velocities in this figure are slightly shifted towards
higher FWHM (in comparison to Paper I) because the effect of limb darkening
leads to a slightly modified rotational profile (see Fig. 168 in
Unsoeld, unsoeld55 (1955)).
The data for
these three line profiles and their corresponding models
fill different areas in this plot.
The underlying H Lorentzian profile has a line width of
400 , the He ii has an intrinsic
line width of 900 , and the C iv line
has an intrinsic
line width of 2,900 .
These line widths are least square fits to the data in Fig. 7.
The modeled rotational velocities of the
H lines range from


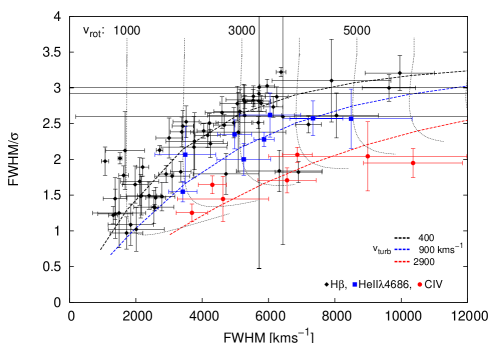


500 to 6,000 in the individual galaxies. The He ii and C iv lines exhibit higher rotational velocities of at least 1,500 .
3.2.2 Fitting the observed H line width ratios with other models
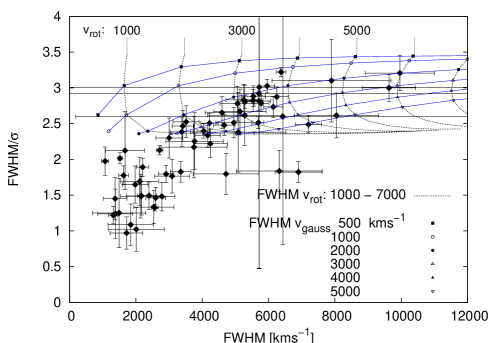
We generated further test models (Figs. 8 to 10) to adjust the observed H line width ratios by means of additional intrinsic line profiles and/or further line broadening mechanisms. Figure 8 shows the computed trend of intrinsic Gaussian profiles that are broadened by rotation. The corresponding line profiles are presented in Fig. 5. The intrinsic Gaussian profiles had line widths (FWHM) ranging from 500 to 5,000 (from top to bottom). The rotational velocities go from 500 to 7,000 . It is evident that these computed H line width ratios cannot explain the observations because these broadened Gaussian profiles always exceed FWHM/ ratio values of 2.35. Lorentzian profiles, on the other hand, can easily explain low FWHM/ ratios as seen in Fig. 7.
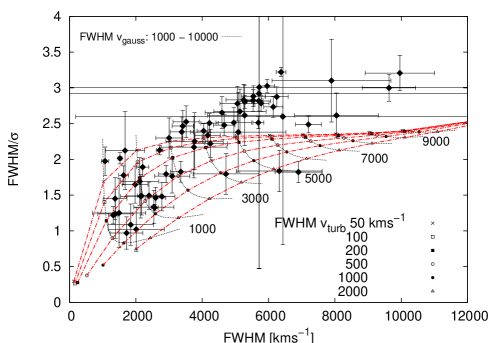
Further line broadening tests of Lorentzian profiles convolved with Gaussian profiles that have widths of 500 to 10,000 explain neither the high observed FWHM/ ratios nor the observed general trend of the FWHM/ to line width FWHM ratios (Fig. 9). The corresponding line profiles are given in Fig. 6.
Figure 10 shows the trend of both observed and modeled line width ratios FWHM/ versus FWHM for logarithmic profiles. We modeled logarithmic profiles for different / ratios (0.01 - 0.9, from bottom to top). In addition we varied the line widths from 300, 500, 700, 900, to 1100 (left to right). The corresponding line profiles are given in Fig. 2.
An exponential profile has a similar shape to a Lorentzian profile, especially in their line wings (see Fig. 1). Line broadening due to rotation of these two profile types leads to similar trends in the FWHM/ vs. FWHM figures. Exponential profiles have a fixed FWHM/ ratio of FWHM/, while this ratio goes to zero for Lorentzian profiles. All in all, the observed trend of varying line shape as a function of line width - from the narrowest to the broadest line profiles - cannot be explained by one varying parameter alone.
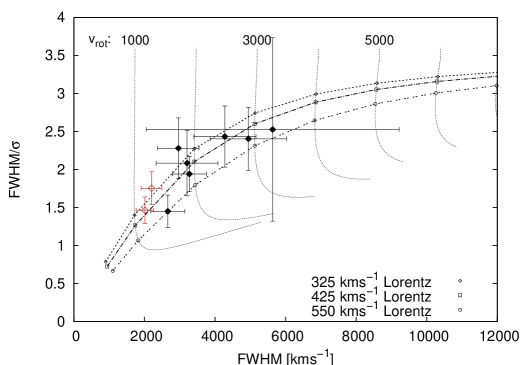
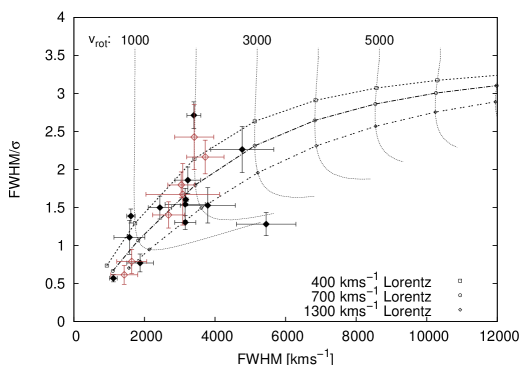
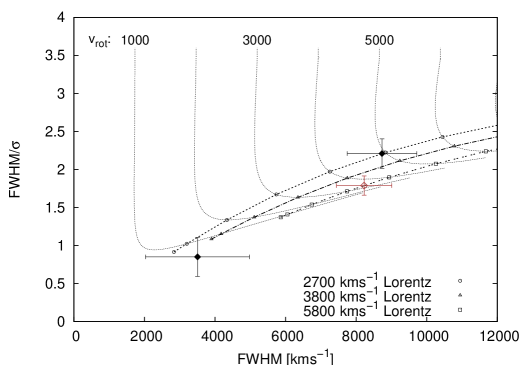
3.2.3 Rotational line broadening of Lorentzian H, H, Ly, C iii] , He ii , and Si iv profiles.
All observed rms emission line width ratios FWHM/ versus line width FWHM (from Table 1), as well as their modeling, are shown separately in Figs. 11 to 16 for the different emission lines H, H, Ly, C iii] , He ii , and Si iv . The observed data are taken from the AGN sample (see Peterson et al., peterson04 (2004)). Those measurements that were regarded as less reliable by the authors are marked by open red diamonds. These less reliable measurements follow in most cases the general trend. Besides the least square fits we show lower and upper limits to the widths of the Lorentzian profiles (in Figs. 11 to 16). These limits are calculated from the variation in the individual data points with respect to the least square fit.
There are two H measurements not following the trend: the galaxies NGC 4593 and PG 1426+015. The galaxy NGC 4593 shows a high line width ratio FWHM/ of 2.7. This might be explained with a high-inclination angle of the accretion disk (see Paper I) in this galaxy. PG 1426+015 shows a low FWHM/ line width ratio with respect to the derived line width of 5450 . The same galaxy was an outlier in the corresponding H figure (see Paper I).
Furthermore, there is one Si iv measurement (Fig. 15) that does not follow the general trend by showing a high FWHM/ line width ratio. However, the error of this line measurement in the galaxy NGC 5548 is very large. A second measurement of this line in NGC 5548 at FWHM/ = 1.755 (see Table 1) corresponds with the measurements of other galaxies.
The line width ratios FWHM/ versus line width FWHM of all these optical and UV emission lines can be modeled in a simple way by rotational line broadening of Lorentzian profiles, as presented before in Paper I for the H, He ii , and C iv lines. To each emission line belongs a dedicated turbulent velocity that can be derived from the underlying Lorentzian profile. This specific turbulent velocity of the individual lines is the same in all galaxies. The intrinsic turbulent velocities belonging to the individual emission lines are listed in Table 2.
| emission line | turbulent velocity |
|---|---|
| [km s | |
| H | |
| H | |
| H | |
| He ii | |
| C iii] | |
| Si iv | |
| He ii | |
| C iv | |
| Ly+N v |
In Paper I we considered the possible effect of an inclination of the accretion disk. An inclination leads to smaller line widths in comparison to the intrinsic line widths. Here we did not correct for this in Table 2.
4 Discussion
4.1 AGN line profiles
In early studies of emission line profiles e.g. Blumenthal & Matthews (blumenthal75 (1975)) or Capriotti et al. (capriotti80 (1980)) fitted logarithmic profiles to observed quasar emission lines. However, later on it was noticed that their logarithmic fits result in line wings that are too small in comparison to the observed profiles. In those early years only very few high-quality AGN spectra existed.
Afterwards it became apparent that the profiles of narrow-line Seyfert 1 galaxies with line widths (FWHM) of less than 2000 - 4000 are well adjusted by single Lorentzian profiles (Sulentic et al. sulentic00 (2000) and references therein, Veron et al. veron01 (2001), Marziani et al. marziani03 (2003)). These authors confirmed previous claims that observed broad Balmer line profiles are more precisely fitted by Lorentzian rather than Gaussian profiles. Gaussian profiles cannot reproduce the profiles observed in narrow-line Seyfert 1 galaxies.
Laor (laor06 (2006)) found evidence of exponential line wings in the H line of the low luminosity narrow-line Seyfert 1 galaxy NGC 4395. However, this galaxy is unique in having a broad H line width (FWHM) of 520 only. Laor (laor06 (2006)) explains this specific line profile by electron scattering in the broad-line region.
Observed H profiles in AGN with line widths (FWHM) 4,000 never can be explained by single Gaussian profiles or by a combination of Gaussian profiles. Gaussian profiles have a constant FWHM/ ratio of 2.35. In contrast, all observed H profiles showing line widths (FWHM) 4,000 exhibit lower FWHM/ ratios (see Fig. 8). A combination of Lorentzian profiles with Gaussian profiles does not match the observed trend in the FWHM/ versus line width FWHM plots (see Fig. 9). Logarithmic profiles meet the observed trend in the FWHM/ versus FWHM plots for those line profiles with line widths FWHM 6,000 (Fig. 10). However, broader profiles cannot be modeled in a simple way by varying only one parameter.
The profiles are not the same in all the quasars. Sulentic et al. (sulentic00 (2000)) call those quasars having H line widths (FWHM) 4,000 Population B quasars in contrast to Population A quasars having H line widths (FWHM) 4,000 . In a similar spirit, Collin et al. (collin06 (2006)) call those galaxies emitting line profiles narrower than Gaussian profiles ( FWHM/ 2.35) Population 1 AGN and those galaxies showing line profiles broader than Gaussian profiles Population 2 AGN (their Fig. 3). Sulentic et al. (sulentic00 (2000)) modeled the broad H line profiles (i.e. the Population B quasars) with two Gaussian profiles, a broad one and a narrower one. In no case could single Gaussian profiles match their observed broad-line wings.
We demonstrated in Paper I that the shape (i.e. the FWHM/ ratio) of the H, He ii , and C iv profiles varies systematically with their line width. There is no clear evidence for two separate quasar populations. Here we show that this applies for H, H, Ly, He ii , C iii] , and S iv lines in our sample as well. The observed profiles of all these emission lines can simply be characterized by rotational line broadening of Lorentzian profiles. To every emission line belongs one exclusive turbulent velocity of the line emitting region. The turbulent velocities go from 400 for the low-ionization lines up to 3,800 for the high-ionization lines (see Table 2). The rotational velocities go from 500 up to 6,500 .
Baskin & Laor (baskin05 (2005)) claim that narrow CIV lines are rare (2 per cent occurrence rate) compared with narrow H 2,000 (20 per cent) based on more than 80 spectra from the Boroson-Green sample. This can be understood easily in terms of the high turbulent velocities belonging to the C iv line emission region (2,900 ) in comparison to the H line region (400 ).
Line broadening due to turbulence and rotation are the main constituents for the observed broad-line profiles in AGN. However, inclined accretion disk geometries of the line emitting regions lead to smaller line widths owing to projection effects, while their FWHM/ ratio remains constant (see Paper I). Additional asymmetries in the line profiles might be caused by geometrical/optical obscuration effects, additional outflow/inflow components, anisotropic emission, superposition of line emission from different emitting region, etc. It was mentioned in Paper I that line asymmetries lead to lower FWHM/ ratios as well.
This general topic should be studied in more detail in the future. Furthermore, obscuration affects individual line profiles in a different way because the lines originate in different regions (see below).
4.2 Geometry and structure of the line emitting region
In Table 2 one can identify the clear trend for higher ionized lines to originate in those regions where higher turbulent velocities are predominant. As higher ionized lines exhibit broader emission lines in general and usually originate closer to the center (e.g. Peterson & Wandel peterson99 (1999), Kollatschny et al., kollatschny01 (2001)). This trend is consistent with a general increase in the turbulent velocity towards central regions. The broad emission lines in AGN originate at distances of less than one light day to more than 100 light days from the central ionizing source (e.g. Desroches et al. desroches06 (2006), Kaspi et al. kaspi07 (2007), Bentz et al. bentz09 (2009)).
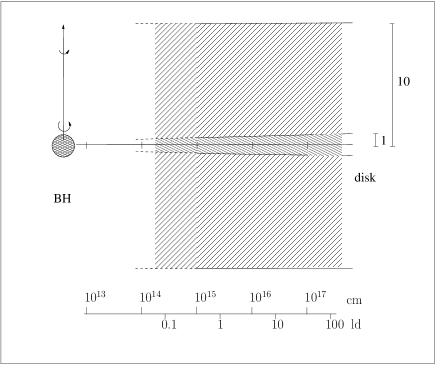
Based on the earlier theoretical studies of Pringle (pringle81 (1981), Eq. 3.16), we made the following claim about the geometry of AGN accretion disks in Paper I. The ratio of the accretion disk height H with respect to their radius R is proportional to the turbulence velocity in the accretion disk with respect to the rotational velocity
| (3) |
The unknown viscosity parameter is assumed to be constant. We did not consider magnetic fields in this picture and made the obvious assumption that the turbulence velocity is less than the sound of speed in the disk:
| (4) | ||||
| (5) |
where is close to the usual parameter.
The rotational velocities - belonging to the individual emission lines - vary by a factor of more than ten, while the turbulent velocities that are connected with the individual emission lines remain constant. This can be seen in Fig. 7, as well as in Figs. 11 to 16. In this accretion disk model and accepting our results breaking the velocity degeneracies one would conclude that slow-rotating AGN host a thick accretion disk that is ten times thicker than fast-rotating AGN. A schematic picture of thick and thin accretion disks is shown in Fig. 17. The radius of the central black hole () in Fig. 17 corresponds to a Schwarzschild mass of .
Other details regarding the physical conditions in the line emitting region seem to be even more complex: It has been noticed by means of reverberation measurements that the He ii and He ii lines in AGN spectra originate at different distances from the center (e.g. Peterson et al., peterson04 (2004)), although they hold the same ionization degree. Diverse models do not reproduce this observational fact (e.g. Bottorff bottorff02 (2002)). Now we independently confirm the former finding that these lines originate in different physical regions based on the distinct turbulent velocities we deduced for the two helium II line emission regions. This is important considering that the He ii /He ii ratio has sometimes been used as a reddening indicator for the broad-line region (e.g. Snijders et al. snijders86 (1986), Ferguson et al. ferguson95 (1995)).
The eigenvector studies of Boroson & Green (boroson92 (1992)) demonstrated a strong correlation between the emission line width, optical FeII emission, and soft X-ray photon index in AGN (Eigenvector 1). The line width is connected with the geometry or rather, to be more specific, with the thickness of the accretion disk (see above). Therefore, the observed strength of the spectral FeII emission and the X-ray photon index might be affected by geometry effects as well.
4.3 Correction factors for calculating central black hole masses
The central black hole mass in AGN can be derived from the broad emission line widths under the assumption that the gas dynamics are dominated by the central massive object:
| (6) |
The characteristic distances of the line-emitting regions from the central ionizing source can be derived by means of spectroscopic variability campaigns. The distance can be calculated from the cross-correlation function of emission line intensity variations with respect to the ionizing continuum intensity variations (e.g. Koratkar & Gaskell koratkar91 (1991), Kollatschny & Dietrich kollatschny97 (1997)). The characteristic velocity of the emission line region can be estimated from the FWHM of the rms profile or from the line dispersion (e.g. Peterson et al. peterson04 (2004)). The scale factor f depends among others on the geometry and structure of the line emitting region, as well as on their inclination. Scale factors for rms spectra have numerical values from 0.5 up to 6.2 (e.g. Collin et al. collin06 (2006)), depending on the assumptions about geometry and structure of the line emitting region. Only very few cases are known where the black hole mass could be estimated independently by, e.g., gravitational redshift measurements (Kollatschny 2003b ) to get additional information on the scale factor f or rather the inclination angle.
Variability campaigns are very expensive with respect to their observing time. Kaspi et al. (kaspi05 (2005)) verify a relationship between AGN luminosity and Balmer-line-averaged BLR size based on variability campaigns. This scaling relation can be used to obtain black hole masses based on single epoch spectra alone. The velocity of the line emitting region can be estimated on the basis of the width of the Balmer emission lines. This method was extended to other emission lines, especially to the C iv line of distant high-redshift AGN.
Central black hole masses were generally found to be bigger for AGN showing broad H profiles (Pop. B), as well as broad C iv profiles than for those AGN that exhibit narrow H profiles (Pop. A) (Marziani et al. marziani03 (2003), Peterson et al., peterson04 (2004), Vestergaard vestergaard04 (2004), Zamfir et al. zamfir10 (2010)).
The broader emission lines usually originate closer towards the center as has been noted before (e.g. Peterson et al. peterson04 (2004), Kollatschny 2003a ). The turbulence grows towards the inner zones as well. Therefore the black hole mass estimates, based on the line widths, are more heavily biased in broad emission line objects caused by the additional turbulence broadening than in the narrower emission line objects.
We consider here nearby AGN where we have good black hole mass estimations from reverberation mapping. Shen et al. (shen08 (2008)) have investigated biases in virial black hole masses based on SDSS spectra. Wang et al. (wang11 (2011)) discuss the influence of radiation-driven outflows on CIV emission line profiles in high-redshift and high-luminosity AGNs. In the case of such outflows, the CIV emission lines should become broader because of the additional line broadening component of the outflow. If these CIV profiles of high-redshift and high-luminosity AGNs show the same widths as those of nearby AGNs, then the contribution of the rotation on the line width must be even lower. In that case the black hole mass estimation that is only based on the rotation velocity must be scaled down even more.
Vestergaard (vestergaard04 (2004)) derived black hole masses of nearby quasars based on their H line widths, as well as black hole masses of high-redshift quasars based on their C iv line widths.


On average, she found bigger black hole masses - by a factor five to ten - for the younger high-redshift quasars based on their C iv line widths in comparison to the old nearby quasars based on their H line widths. In an additional paper, Vestergaard & Peterson (vestergaard06 (2006)) published different scaling relations for nearby and distant AGN black hole masses based on their H, as well as C iv line widths. However, Netzer at el. (netzer07 (2007)) note that using the C iv line width for estimating black hole masses gives considerably different results and a larger scatter than using the H line. We demonstrated in Paper I that black hole mass estimates based on the line width of the C iv line are overestimated by a factor of five to ten in comparison to those black hole masses based on the width of the H line.
On the basis of our observed and modeled line width ratios in Figs. 7, 11 - 16, we present in Fig. 18 the relation between the observed FWHM of the emission line profiles and the related rotational velocity . This relation is shown for underlying turbulence profiles with ranging from 400 to 3,800 . In Fig. 19 we present the correction factor towards the rotational velocity of the broad-line clouds to calculate the central black hole masses of AGNs based on the observed line widths.
Computed black hole masses go with the square of the rotational velocity (see Eq. 6). Therefore, the corrected intrinsic black hole masses should be lower by a factor of two to more than ten with respect to the calculated black hole masses that have not been corrected for the turbulent velocity contribution. This correction factor is different for the different emission lines (depending on the underlying turbulent velocity of the individual lines) and also depends on the additional rotational velocity broadening. There is not an exclusive correction factor for black hole mass estimates based on the C iv or H line widths as proposed by Vestergaard & Peterson (vestergaard06 (2006)) in their mass scaling relations. Furthermore, black hole masses of distant AGN based on the C iv line widths have been overestimated in comparison to nearby AGN where the mass estimate is based on the H line. It is important to consider this effect for our general understanding of the evolutionary history of black hole masses in AGN.
5 Conclusion
We investigated the profile shapes of the UV/optical broad
emission lines in AGN in detail.
The two basic components causing
the line profile are Lorentzian profiles and rotational broadening.
An intrinsic turbulent velocity belongs
to each specific AGN emission line, which
causes different line widths (FWHM) of the
particular Lorentzian profiles.
The turbulent velocities go from 400 for H up to
3,800 for Ly+N v .
The rotation velocities causing the line profile broadening
go from 500 up to
6,500 . There are not two separated
classes of broad-line AGN
(narrow line and broad-line objects), but instead a continuous transition
from narrow to broad-line objects.
The accretion disk thickness in AGN can be derived from the ratio of the
turbulent velocity with respect to the
rotational velocity . Slow-rotating AGN
have an accretion disk that is ten times thicker than fast-rotating AGN.
We find clear evidence that
the He ii and
He ii lines originate in different physical regions
in AGNs, although they hold the same ionization degree.
This finding is based on the distinct turbulent velocities
we deduce for the two helium II line emission regions.
Black hole mass corrections resulting from turbulent
velocity considerations are nontrivial and are larger for
C iv -based
measurements than H, and both are a function of the observed FWHM.
In the literature
usually the widths of the broad emission lines are used to
compute the central black hole masses in AGN. However, one has to consider
the contribution by the turbulence
to get the corrected intrinsic rotational
velocities. This investigation presented
the individual correction factors towards the different emission lines
for getting the intrinsic
rotational velocities of
the line emitting region from
the observed FWHMs.
The corrected black hole masses are
lower than the uncorrected black hole masses
by a factor of two to more than ten,
depending on the emission lines, as well as on the rotational
velocities.
Especially those masses of the distant AGN
have been grossly overestimated
where the masses have
been estimated on the basis of the C iv line widths.
Acknowledgements.
This work has been supported by the Niedersachsen-Israel Research Cooperation Program ZN2318 and DFG grant Ko 857/32-1.References
- (1) Baskin, A. & Laor, A. 2005, MNRAS, 356, 1029
- (2) Bentz, M. C. et al. 2009, ApJ, 705, 199
- (3) Blumenthal, G., R. & Mathews, W. G. 1975, ApJ, 198, 517
- (4) Boroson, T. & Green, R. 1992 ApJSuppl, 80, 109
- (5) Bottorff, M., C. et al. 2002, ApJ, 581, 921
- (6) Capriotti, E., Foltz, C. & Byard, P. 1980 ApJ, 241, 903
- (7) Collin-Souffrin, S., Dyson, J. E., McDowell, J. C. & Perry, J. J. 1988, MNRAS, 232, 539
- (8) Collin, S., Kawaguchi, T., Peterson, B. M., Vestergaard, M. 2006, A&A, 456, 75
- (9) Desroches, L.-B. et al. 2006, ApJ, 650, 88
- (10) Elvis, M. 2000, ApJ, 545, 63
- (11) Emmering, R.T., Blandford, R.D., & Shlosman, I. 1992, ApJ, 385, 460
- (12) Ferguson, J. W., Ferland, G. J. & Pradhan, A. K. 1995, ApJ 438, L55
- (13) Fromerth, M. J. & Melia, F. 2000, ApJ 533, 172
- (14) Gaskell, C. M. 2010, ASP Conf. Ser.. 427, 68
- (15) Goad, M. R., Korista, K. T. & Ruff, A. J. 2012, MNRAS, 426, 3086
- (16) Ho, L. 2008, ARAA, 45, 475
- (17) Hu, C. et al. 2012, ApJ, in press (arXiv:1210.4187v1)
- (18) Hubeny, I., Lanz,T. & Jeffrey, C.S. 1994, in Newsletter of Astronomical Spectra No.20., ed. C.S. Jeffrey, St. Andrews Univ.
- (19) Kaspi, S. et al. 2005, ApJ, 629, 61
- (20) Kaspi, S. et al. 2007, ApJ, 533, 631
- (21) Königl, A., & Kartje, J.E. 1994, ApJ, 434, 446
- (22) Kollatschny, W. et al. 2001, A&A, 379, 125
- (23) Kollatschny, W. 2003a, A&A, 407, 461
- (24) Kollatschny, W. 2003b, A&A, 412, L61
- (25) Kollatschny, W.,& Dietrich, M. 1997, A&A, 323, 5
- (26) Kollatschny, W. & Zetzl, M. 2011, Nature, 470, 366 (Paper I)
- (27) Koratkar, A. & Gaskell, M. 1991, ApJ 370, L61
- (28) Laor, A. 2006, ApJ, 643, 112
- (29) Marziani, P. et al. 2003, MNRAS, 345, 1133
- (30) Moriya, T.J. & Tominaga, N. 2012, arXiv:1110.3807v2
- (31) Murray, N., & Chiang, J. 1997, ApJ, 474, 91
- (32) Netzer, H. 1990, 20 Saas-Fee Advanced Course of the Swiss Society for Astrophysics and Astronomy: Active Galactic Nuclei (Berlin: Springer), 57
- (33) Netzer, H. et al. 2007, ApJ, 671, 1256
- (34) Osterbrock, D. E. 1978, Proceedings of the National Academy of Sciences, 75, 540
- (35) Peterson, B. M. & Wandel, A. 1999, ApJ, 521, L95
- (36) Peterson, B. M. & Wandel, A. 2000, ApJ, 540, L13
- (37) Peterson, B. M. et al. 2004, ApJ, 613, 682
- (38) Pringle, J. E. 1981, ARAA, 19, 137
- (39) Richards, G. T. et al. 2002, AJ, 124, 1
- (40) Richards, G. T. et al. 2011, AJ, 141, 167
- (41) Robinson, A. 1995, MNRAS, 272, 647
- (42) Shen, Y. et al. 2008, ApJ, 680, 169
- (43) Snijders, M. H. J., Netzer, H. & Boksenberg, A. 1986, MNRAS, 222, 549
- (44) Sulentic, J. W., Marziani, P. & Dultzin-Hacyan, D. 2000, Annual Review of Astronomy and Astrophysics. 38, 521
- (45) Sulentic, J. W. et al. 2002, ApJ, 566, L71
- (46) Sulentic, J. W., Marziani, P., Zamfir, S. & Meadows, Z.A. 2012, ApJ, 752, L7
- (47) Unsoeld, A. 1955, in ’Physics of stellar atmospheres’, Springer publisher
- (48) Veron-Cetty, M.-P., Veron, P., Goncalves, A. C., 2001, A&A, 372, 730
- (49) Vestergaard, M. 2004, ApJ, 601, 676
- (50) Vestergaard, M. & Peterson, B. M. 2006, ApJ, 641, 689
- (51) Urry, C. M. & Padovani, P. 1995, PASP 107, 803
- (52) Wang, H. et al. 2011, ApJ, 738, 85
- (53) Zamfir, S., Sulentic, J. W., Marziani, P. & Dultzin, D. 2010, MNRAS, 403, 1759