X-ray and Multiwavelength Insights into the Inner Structure of High-Luminosity Disc-Like Emitters
Abstract
We present X-ray and multiwavelength studies of a sample of eight high-luminosity active galactic nuclei (AGNs) with disc-like H emission-line profiles selected from the Sloan Digital Sky Survey Data Release 7. These sources have higher redshift () than the majority of the known disc-like emitters, and they occupy a largely unexplored space in the luminosity-redshift plane. Seven sources have typical AGN X-ray spectra with power-law photon indices of –2.0; two of them show some X-ray absorption (column density – cm-2 for neutral gas). The other source, J, has only three hard X-ray photons detected and is probably heavily obscured ( cm-2). This object is also identified as a low-ionization broad absorption line (BAL) quasar based on Mg ii absorption; it is the first disc-like emitter reported that is also a BAL quasar. The IR-to-UV spectral energy distributions (SEDs) of these eight sources are similar to the mean SEDs of typical quasars with a UV “bump”, suggestive of standard accretion discs radiating with high efficiency, which differs from low-luminosity disc-like emitters. Studies of the X-ray-to-optical power-law slope parameters () indicate that there is no significant excess X-ray emission in these high-luminosity disc-like emitters. Energy budget analysis suggests that for disc-like emitters in general, the inner disc must illuminate and ionize the outer disc efficiently ( of the nuclear ionizing radiation is required on average) via direct illumination and/or scattering. Warped accretion discs are probably needed for direct illumination to work in high-luminosity objects, as their geometrically thin inner discs decrease the amount of direct illumination possible for a flat disc.
keywords:
accretion, accretion discs – galaxies: active – galaxy: nucleus – line: profiles – quasars: emission lines1 INTRODUCTION
In a subset of active galactic nuclei (AGNs) the broad, optical emission lines (most notably the Balmer lines) have profiles that can be well described by models that attribute the emission to the surface of a relativistic, Keplerian accretion disc. The most striking of the disc-like profiles are double peaked and are reminiscent of the line profiles observed in cataclysmic variables (e.g., Greenstein & Kraft 1959; Young & Schneider 1980; Young, Schneider & Shectman 1981; Marsh 1988) and attributed to their accretion discs. Double-peaked lines in AGNs have received a great deal of attention since their discovery (e.g., Stauffer, Schild & Keel 1983; Oke 1987) and have motivated the development of disc emission models to describe their profiles (e.g., Chen, Halpern & Filippenko 1989a; Chen & Halpern 1989; Rokaki, Boisson & Collin-Souffrin 1992). In these models, the emission originates in the photoionized skin of the disc at radii from a few hundred to a few thousand gravitational radii from the centre (the gravitational radius is defined as ). This region of the accretion disc has actually been suggested to be the broad-line region (BLR) in AGNs, or at least to be responsible for producing the low-ionization broad lines (see Collin-Souffrin 1987; Eracleous, Lewis & Flohic 2009; Gaskell 2009 and references therein). Although other mechanisms have been considered for the origin of double-peaked lines, emission from the outer accretion disc is the most plausible one (e.g., see arguments in Eracleous & Halpern 2003).
With an appropriate choice of model parameters, axisymmetric disc models can also describe profiles that are not obviously double peaked but instead have double shoulders that are not widely separated or flat tops (this can be accomplished by choosing a small inclination angle or a very large outer radius, for example; see Eracleous & Halpern 2001, 2003 and references therein). Moreover, the initial line-profile models have been extended by introducing non-axisymmetric perturbations to the disc emissivity (e.g., an eccentricity or a spiral arm; see Eracleous et al. 1995; Storchi-Bergmann et al. 2003 and references therein) to describe an even wider variety of profile shapes, such as those that are very asymmetric (e.g., with one dominant shoulder). Finally, the inclusion in the models of radiative-transfer effects in the disc atmosphere can result in profiles that are flat topped or even single peaked (see Murray & Chiang 1997; Flohic, Eracleous & Bogdanović 2012). Here we consider all profiles that have double peaks, shoulders, asymmetries, or other features that resemble those from disc models (regardless whether the discs in these models are axisymmetric or not) as disc like. Adopting as our working hypothesis that the outer disc accounts for much of the low-ionization BLR emission and that disc-like lines give us a direct view of this BLR, we use the lines as tools to gain insights into its structure and physical properties.
Disc-like emitters are usually identified via their H or H lines (e.g., Eracleous & Halpern, 2003; Strateva et al., 2003; Shen et al., 2011), and in a few cases, disc-like Mg ii lines111The Mg ii line is actually a doublet at and , and it is treated as a single line throughout this paper. have been observed (e.g., Strateva et al., 2003; Eracleous et al., 2004; Luo et al., 2009). The disc-like lines are among the broadest optical emission lines known in AGNs, with full widths at half maximum (FWHM) sometimes exceeding 15 000 km s-1 (e.g., Strateva et al., 2008). The fraction of disc-like emitters among the general population of AGNs is , determined based on a survey of low-redshift () AGNs (Strateva et al., 2003)222Only a fraction of the line profiles identified by Strateva et al. (2003) are clearly double peaked. The others have double or asymmetric shoulders or flat tops which are very suggestive of emission from an accretion disc. As demonstrated by those authors, the line asymmetries can explained well by disc models. selected from the Sloan Digital Sky Survey (SDSS; York et al. 2000); the fraction among radio-loud AGNs is probably higher by a factor of a few (Eracleous & Halpern, 1994, 2003). Most known disc-like emitters are located at , with the highest-redshift one, J, having been discovered serendipitously in the Extended Chandra Deep Field-South at (Luo et al., 2009).
After almost 30 years since their discovery, there are still two fundamental open questions regarding the nature of disc-like emitters. The first one is the energy budget problem. In many disc-like emitters, the gravitational power available locally in the line-emitting region is insufficient to power the observed lines, and it has been suggested that the outer disc is photoionized by external illumination. The illumination mechanism, however, is not clear. For the initial sample of low-luminosity disc-like emitters, a central X-ray emitting elevated structure was proposed to illuminate the outer disc (e.g., Chen et al., 1989a). However, a significant number of high-luminosity disc-like emitters have been discovered recently, which are not expected to possess such an elevated structure (e.g., Strateva et al., 2008). A scattering medium above the disc (e.g., an outflowing wind) can also redirect continuum photons from the centre to the outer disc, as has been discussed in Dumont & Collin-Souffrin (1990b). Cao & Wang (2006) made a somewhat different suggestion that a jet is the scattering medium. It is thus interesting to test whether there is any excess X-ray emission from high-luminosity disc-like emitters that acts as the power source, or alternatively, whether the radiation from the centre is transported to the outer disc via scattering.
The other open question regards the difference between disc-like emitters and more typical AGNs. If the BLR is associated with the accretion disc, why do the disc-like broad lines appear in only of AGNs? Under certain accretion-disc conditions, such as a nearly face-on disc (e.g., Corbin, 1995) or a disc-emission region with a large ratio of the outer to inner radius (e.g., Dumont & Collin-Souffrin 1990b; Jackson, Perez & Penston 1991), the disc emission lines could appear single peaked. However, these alone are probably not sufficient to solve the problem (see Eracleous et al. 2009 for a review). One promising model that addresses this problem involves radiative transfer in an accelerating disc wind: a line from the disc that would have a disc-like profile in the absence of a disc wind can appear single peaked because of the non-axisymmetric emissivity pattern produced by the radiative transfer (Murray & Chiang, 1997). This disc-wind model suggests that disc-like emitters with luminosities close to the Eddington limit (likely high-luminosity AGNs) should be rare as the radiatively driven winds are likely denser and would have prevented the formation of disc-like lines.
Understanding the nature of disc-like emitters is especially valuable for painting a general picture of the inner structure of AGNs: the detailed inner components of AGNs, including the accretion disc, disc wind, BLR, and scattering medium, are closely related to the appearance of disc-like emission lines. High-luminosity disc-like emitters appear to be one key to constrain the possible models that can answer the unresolved questions. Moreover, disc-like emitters have not been studied in detail at higher redshifts (), when the Universe was nearly half of its age and possible cosmic evolution over Gyrs could have altered their general properties. We present in this paper X-ray and multiwavelength studies of a sample of eight high-luminosity disc-like emitters that are also at relatively high redshifts (). In Section 2 we describe the selection procedure of the sample. In Section 3 we present the line-emitting region parameters for these sources derived from line-profile fitting. We study the X-ray and multiwavelength properties in Sections 4 and 5, respectively. In Section 6 we discuss the implications of our results for the energy budget problem, and for the first time, we consider carefully a variety of mechanisms that can balance the energy budget of the line-emitting region in high-luminosity disc-like emitters. We also discuss the disc-wind model addressing the connection between disc-like emitters and more typical AGNs. We summarize in Section 7. Throughout this paper, we adopt a cosmology with km s-1 Mpc-1, , and (e.g., Komatsu et al., 2011).
2 SAMPLE SELECTION
We systematically searched for high-luminosity disc-like emitters from the SDSS Data Release 7 (DR7; Abazajian et al. 2009) quasar catalog (Schneider et al., 2010). We defined a parent sample of 3132 quasars with –0.8, erg s-1 Hz-1 (2500 Å monochromatic luminosity; Shen et al. 2011), and a minimum continuum signal-to-noise ratio (around H; unbinned) . The redshift range was chosen so that we are exploring the relatively high-redshift space () and the H line is well covered by the SDSS spectrum (). We fit the SDSS spectra using the spectral-fitting routine presented in Wu et al. (2009), which can perform continuum subtraction and multi-component Gaussian fitting of emission lines. The underlying continuum consists of three components: a power-law spectrum, the Balmer bump (between 2000 and 4000 Å), and the iron emission forest (modeled with templates from Vestergaard & Wilkes 2001 and Véron-Cetty, Joly & Véron 2004). After subtracting the continuum, we used 3–4 Gaussian components to fit the broad H line, along with 2–3 Gaussian components for each of the [O iii] 4960 and 5007 narrow lines. We visually inspected each spectrum that has its H line best fitting by at least one blueshifted and one redshifted Gaussian profile, and identified 14 secure disc-like emitters. In this high-luminosity AGN sample, we did not find any source having an H line with two well-defined and well-separated peaks as in those original double-peaked emitters studied in Eracleous & Halpern (1994). All the H line profiles of these 14 objects have broad blue and red shoulders or flat tops that suggest disc-like emission (see Section 3 below for disc-model fits to the profiles).333Of course, since we are verifying that a profile is disc like after we make an initial selection, we cannot be sure that we have selected all disc-like profiles out of a given sample. Nonetheless, the analysis presented in this study and its conclusions do not depend on selecting all disc-like profiles out of the sample that we have searched. Of these 14 sources, 12 are radio quiet (radio-loudness parameter ; see Section 5.1 below for definition) and two are radio loud ().
We selected the six most luminous radio-quiet sources among these 14 disc-like emitters and obtained Chandra snapshot observations of them in Cycle 12; we chose radio-quiet sources as their X-ray spectra are not dominated by jet-linked emission (e.g., Worrall et al., 1987; Miller, ). One other object among the 14 sources, J, has an archival Chandra observation and is thus included in this study. J was targeted by Chandra as one of the Advanced Satellite for Cosmology and Astrophysics (ASCA) SHEEP (Search for the High-Energy Extragalactic Population) survey sources (e.g., Nandra et al., 2003). Furthermore, we include in our sample J, the luminous disc-like emitter presented in Strateva et al. (2008) that has been targeted in additional Chandra and XMM-Newton observations. Therefore, our sample consists of eight high-luminosity ( erg s-1 Hz-1) and relatively high-redshift () disc-like emitters that have Chandra coverage. Their -band absolute AB magnitudes range from to ; these sources are within the top most-luminous quasars in the SDSS DR7 quasar catalog in the redshift range of 0.5–0.8. The Chandra observations of these sources are listed in Table 1; the exposure times range from 4 ks to 10 ks except for J, which has a 40 ks Chandra exposure. The redshifts for these sources are obtained from Hewett & Wild (2010), which provides the best available redshift measurements (mainly from the [O iii] lines for our objects) for SDSS quasars.
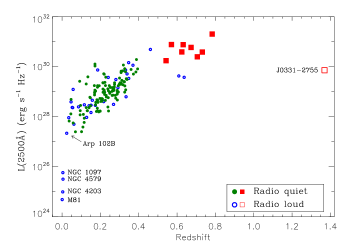
In Figure 1, we show the positions of our sample objects in the redshift versus 2500 Å monochromatic-luminosity plane (see Strateva et al. 2008 and references therein); some known disc-like emitters, including the prototypical source Arp 102B, are shown. Our eight sources are all radio quiet, and they sample a largely unexplored space in the luminosity-redshift plane. Although these objects were selected based on their disc-like H line profiles, the Mg ii line is covered by the SDSS spectrum in all cases (see details below in Section 3). We also discovered broad UV absorption features in J, which are discussed in Section 4.2 below; the other objects do not show apparent UV absorption in their spectra. The highest-redshift known disc-like emitter, J (Luo et al., 2009), has a luminosity ( erg s-1 Hz-1) comparable to our sample objects, and thus we include this source in some of our discussion (Section 6). We caution that J is radio loud, and some of its X-ray emission may originate from a jet.
3 LINE PROFILES AND DISK-MODEL FITS
The continuum-subtracted H line profiles for the eight objects are displayed in Figure 2, derived from the spectral-fitting routine described in Section 2. The FWHMs of the broad H lines, listed in Table 2, are in the range of –11000 km s-1; for comparison, the median FWHM of H lines in general AGNs with similar luminosities (from the Shen et al. 2011 SDSS DR7 catalog) is only km s-1. Since the Baldwin effect for H is not significant in typical AGNs (e.g., Dietrich et al., 2002), we did not assess it here for the disc-like emitters.
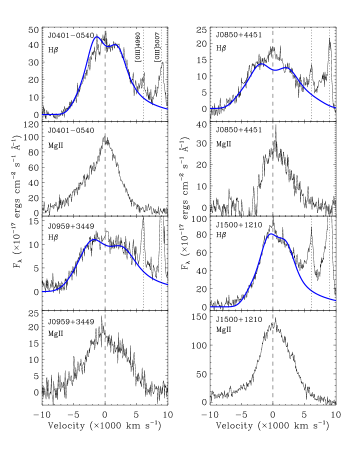
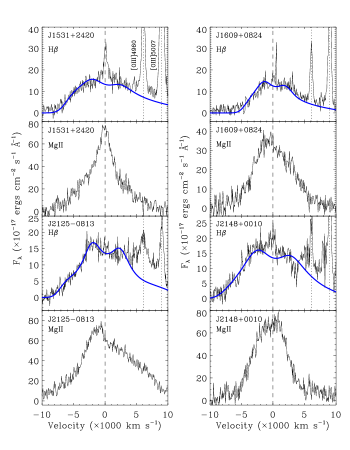
We fit the disc-like H line profiles (after continuum subtraction) with the relativistic Keplerian disc model of Chen & Halpern (1989). The model assumes that the line originates from the surface of a circular Keplerian disc; the free parameters are the inner and outer radii of the emission regions ( and in units of gravitational radii ), the disc inclination angle (), the disc emissivity power-law index ( for a simple power-law model or , , and for a broken power-law model),444A simple power-law model () was assumed first for the emissivity. If the wings of the line profile could not be well fit, we then adopted the more complex broken power-law model ( when and when ). and the broadening parameter (). The central narrow/broad line was excluded from the fit if present. The best-fitting parameters for the sample objects are reported in Table 2, and the model line profiles are superposed on the spectra in Figure 2. The parameters are within the typical ranges found for other disc-like emitters (e.g., Eracleous & Halpern, 1994, 2003; Strateva et al., 2003). These accretion discs generally have small inclination angles (, relatively face on). The inner radius of the emission region is a crucial parameter for determining the available local viscous energy (see Section 6.1); the inner radii for our sample sources range from 100–450 , and they are constrained to an accuracy of . We note that for J, the model fits well the red peak while it shows a slight excess at the blue peak. In fact, unlike the others, the observed J line profile possesses a slightly weaker blue peak than red peak, which cannot be perfectly fit by a circular disc model, and a model with a non-axisymmetric perturbation is probably required (e.g., an elliptical disc; see Eracleous et al., 1995).555For the rest of the objects, there may also be some small discrepancies between the data and model around the peaks. A perturbed-disc model could likely improve the current fits by better reproducing the relative strengths of the two peaks. However, the inner radius of the emission region largely depends on the shape of the wings, and thus this parameter determined from a circular disc model is appropriate for deriving the available local viscous energy.
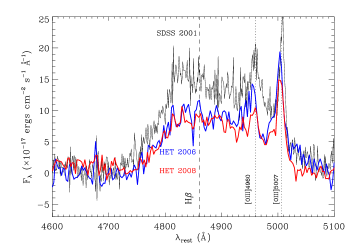
Line profile variability is typical of disc-like emitters (e.g., Gezari, Halpern & Eracleous 2007; Strateva et al. 2008; Lewis, Eracleous & Storchi-Bergmann 2010). We have obtained additional optical spectra for J with the Low-Resolution Spectrograph (Hill et al., 1998) on the Hobby-Eberly Telescope (HET; Ramsey et al. 1998) in 2006 Jun and 2008 Jun, contemporaneous of the Chandra or XMM-Newton observations. The disc-like H line profiles in these spectra are similar to that in the SDSS spectrum taken in 2001, and the corresponding disc-model parameters do not change. However, the integrated H line flux dropped by 40% in 2006 and 44% in 2008 compared to the 2001 value. A comparison of the SDSS and HET spectra of J is shown in Figure 3.
Disc-like emission profiles are usually observed in the H and H lines. Nonetheless, some cases of disc-like Mg ii lines are also known (e.g., Halpern et al., 1996; Strateva et al., 2003; Eracleous & Halpern, 2003; Eracleous et al., 2004; Eracleous et al., 2009; Luo et al., 2009). The SDSS spectra do not cover the Mg ii line for the majority of the disc-like emitters in Strateva et al. (2003) due to their low redshifts. However, the SDSS spectra of all of the quasars studied here do cover the Mg ii line, and the line profiles are displayed in Figure 2. The Mg ii line profiles in the present sample are not identical to those of the H lines, although a few objects do appear to have shoulders in their Mg ii profiles reminiscent of the shoulders of the H profiles (e.g., J, J, and J). Moreover, the widths of the Mg ii lines are often comparable to those of the H lines. In contrast, the Mg ii profiles of lower-luminosity objects (studied by Halpern et al., 1996; Eracleous & Halpern, 2003; Eracleous et al., 2004; Eracleous et al., 2009) bear a much stronger resemblance to those of the Balmer lines, including clearly disc-like shapes. There are several factors that may cause the differences of the Balmer and Mg ii profiles: (1) the Mg ii line emissivity is different from that of the Balmer lines (e.g., Dumont & Collin-Souffrin, 1990a); (2) radiative transfer may affect the Balmer and Mg ii lines differently due to different optical depths; (3) the Mg ii line wings are usually heavily contaminated by the underlying iron emission-line complexes, making the derived line profiles less certain; (4) Mg ii and Fe ii absorption complexes can contaminate the Mg ii profile and distort its shape (studied by, e.g., Halpern et al., 1996). Therefore, there is not always a clear relation between the H and Mg ii line profiles, and it is more difficult to identify and study Mg ii disc-like emitters.
4 X-RAY AND RELATED DATA ANALYSIS
4.1 X-ray Data Analysis
All of the eight disc-like emitters have been observed by Chandra with the S3 CCD of the Advanced CCD Imaging Spectrometer (ACIS; Garmire et al. 2003), as listed in Table 1. For the six Cycle 12 targets, the exposure times were chosen to yield enough counts () for basic spectral fitting in each case, under the assumption that their X-ray-to-optical power-law slopes () follow the – relation for typical radio-quiet AGNs presented in Steffen et al. (2006). We reduced and analyzed the ACIS-S3 data using mainly the Chandra Interactive Analysis of Observations (CIAO) tools.666See http://cxc.harvard.edu/ciao/ for details on CIAO. We used the chandra_repro script to reprocess the data with the latest calibration. The background light curve of each observation was inspected and background flares were removed using the deflare CIAO script, which utilizes an iterative 3 clipping algorithm. The background-flare cleaned exposure times are given in Table 1.
We created images from the cleaned event files using the standard ASCA grade set (ASCA grades 0, 2, 3, 4, and 6) for the 0.3–8.0 keV band. We then ran wavdetect (Freeman et al., 2002) on the images to search for X-ray sources, with a “ sequence” of wavelet scales (i.e., 1, , 2, , and 4 pixels) and a false-positive probability threshold of 10-6. All eight objects are detected, and their X-ray positions coincide with the SDSS optical positions ( offset; see Table 1). They all have small off-axis angles (Table 1).
We extracted source counts in three standard bands: 0.5–8.0 keV (full band), 0.5–2.0 keV (soft band), and 2.0–8.0 keV (hard band). We utilized the polygonal source-count extraction regions generated by the acis extract (AE; Broos et al. 2010) software that approximate the encircled-energy fraction (EEF) contour of the point spread function (PSF) at 1.5 keV. Background counts were extracted from a source-free annular region around each source. The source counts and the associated 1 errors (following Gehrels, 1986) are presented in Table 3. For J, there are no soft-band photons within the extraction region, and thus we calculated an upper limit on the source counts for this band using the Bayesian approach of Kraft, Burrows & Nousek (1991) for the 99% confidence level.
The X-ray spectrum of each source was extracted using the CIAO specextract script, with a source aperture of 4″ radius centered on the X-ray position. The background spectrum was extracted from an annular region with an inner radius of 6″ and an outer radius of 15″, which is free of X-ray sources in every case. We fitted the spectrum of each source using XSPEC (version 12.6.0; Arnaud 1996) except for J, which has only three counts in the source spectrum. We employed an absorbed power-law model (wabs*zpow*zwabs) which takes into account the Galactic absorption (Galactic neutral hydrogen column densities are listed in Table 3; Dickey & Lockman 1990) and possible intrinsic absorption at the redshift of the source. If intrinsic absorption was not required to produce an acceptable fit, we estimated the 90% confidence upper limit on the intrinsic column density and adopted a simple power-law model (wabs*zpow). In general, the power-law photon index and intrinsic column density were set as free parameters during the fit, and the statistic was used. However, due to the small number of source counts for J, we fixed its photon index at , a typical value for luminous radio-quiet AGNs (e.g., Reeves et al., 1997; Just et al., 2007; Scott et al., 2011), and we also adopted the statistic (cstat) in XSPEC. The fitting results and fit qualities are presented in Table 3. The quoted errors are at the 90% confidence level for one parameter of interest. For the six sources modeled with the statistic, the best-fitting results are statistically acceptable, with the null-hypothesis probability in all cases.
The X-ray photon indices determined from spectral fitting (for six objects) have a range of –2.0 (mean with a standard deviation of 0.28), typical for luminous radio-quiet quasars. Considering the established relation between hard X-ray photon index and H FWHM (e.g., Brandt, Mathur & Elvis, 1997; Reeves & Turner, 2000), we might expect a mean for our objects (they have a mean H FWHM of km s-1). Our objects thus appear plausibly consistent with this relation, although our small sample size and the apparently significant intrinsic dispersion preclude any strict comparison. Five of the eight sources show no evidence for obscuration. J shows a small amount of absorption, although with a large uncertainty, and J is moderately obscured [ cm-2]. If we adopt a simple power-law model for J and allow its photon index to be a free parameter, the resulting value is an unusually flat , also indicating likely obscuration. We note that a neutral intrinsic absorber was assumed in this fitting. The absorption column density derived here would be an underestimate if the absorbing medium is partially ionized, but we generally lack sufficient counts to constrain more complex absorption models.
We investigated short-term X-ray variability for each source by applying the Kolmogorov–Smirnov (K–S) test to the unbinned event data in the source region (e.g., Primini et al., 2011). The arrival times of events were tested against a constant count-rate model, and corrections have been made for good time intervals. None of the sources appears to be variable within the observation, with the K–S test probability in every case. Two of the eight objects, J and J, have prior ROSAT All Sky Survey (RASS) detections in 1990, allowing us to examine their long-term X-ray variability. We converted the RASS 0.1–2.4 keV count rates to the Chandra 0.5–2.0 keV count rates using the Portable, Interactive, Multi-Mission Simulator (PIMMS);777http://cxc.harvard.edu/toolkit/pimms.jsp. photon indices derived from the Chandra spectral fitting were adopted. The RASS-derived count rate (0.078 s-1) of J appears to be consistent with the Chandra observation (0.072 s-1). For J, the count rate observed by Chandra (0.056 s-1) dropped by a factor of about two over a -year time-scale compared to that expected from the RASS count rate (0.122 s-1). Additional Chandra and XMM-Newton observations of J also indicate long-term variability, as presented in Section 4.3 below.
4.2 The Broad Absorption Line Quasar J0850+4451
J has only three counts within the source aperture, preventing spectral modeling. However, these three counts are all hard X-ray photons, in the 4–5 keV range (corresponding to 6.2–7.7 keV in the rest frame), suggesting that this source is heavily obscured. To obtain a first-order estimate of the level of obscuration, we used the fakeit routine in XSPEC to simulate observed spectra assuming an absorbed power-law model with and different values. A value of cm-2 is required to generate three photons with energies above 4 keV and almost no other lower-energy photons. Given the optical luminosity () of J and the – relation for typical AGNs (see Section 5.2 for details), we expected full-band counts from this source. The observed number of counts is times smaller than expected, also suggesting heavy obscuration.
The SDSS spectrum of J shows a broad absorption line on the blue side of Mg ii with a minimum outflow velocity of km s-1 and a velocity width of km s-1, indicating that it is a low-ionization broad absorption line (LoBAL) quasar (e.g., Boroson & Meyers, 1992; Trump et al., 2006; Gibson et al., 2009). The Mg ii line is shown in Figure 4a; We fit two Gaussian profiles to the broad emission line in the continuum-subtracted spectrum, and then used one Gaussian to model the remaining absorption feature. The SDSS spectrum also shows probable broad absorption features in He i and He i , as have been observed in some other BAL quasars (e.g., Boksenberg et al. 1977; Leighly, Dietrich & Barber 2011). The He i line is shown in Figure 4b. BAL quasars are known to be X-ray weak compared with typical quasars, while LoBAL quasars are significantly X-ray weaker than even normal BAL quasars, of which the primary cause is probably strong intrinsic absorption (e.g., Green et al., 1995; Green et al., 2001; Gallagher et al., 2002, 2006; Gibson et al., 2009). The heavy X-ray obscuration suggested by the Chandra observation is consistent with the LoBAL nature of J. It is the first disc-like emitter reported that is also a BAL quasar,888Although UV absorption lines have been observed in Arp 102B (e.g., Eracleous, Halpern & Charlton, 2003), they are relatively narrow with velocity width km s-1. and thus disc-like emission lines and BALs are not exclusive phenomena.


4.3 X-ray Spectra of J21250813
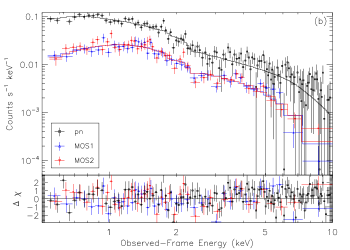
In addition to the Chandra observation, we also analyzed the XMM-Newton observation of J (observation ID: 0505410101) which was taken on 2008 Apr 24. The total exposure was 36.3 ks for the MOS detector and 37.6 ks for the pn detector. We processed the data using the standard XMM-Newton Science Analysis System (v11.0.0) routines. We reprocessed the raw data (ODFs) to generate calibrated and concatenated EPIC event lists, and then filtered these event lists for flaring background ( s-1 for MOS and s-1 for pn). The cleaned exposure times are 20.1 ks (MOS1), 21.0 ks (MOS2), and 22.7 ks (pn). For each detector, the source spectrum was extracted from a 36″-radius circular aperture centered on the source, and the background spectrum from a 60″-radius aperture in a nearby source-free region. The spectra from MOS and pn have counts in total, and we jointly fit them using XSPEC assuming an absorbed power-law model. The resulting best-fitting model is statistically acceptable (dof=1.1 and null hypothesis probability ), and it is similar to that derived from the Chandra spectrum, with no intrinsic absorption () and . The observed 2.0–8.0 keV flux from XMM-Newton is smaller than that from Chandra; this type of long-term X-ray flux variability is common among disc-like emitters (e.g., Strateva et al., 2006, 2008) and luminous AGNs in general (e.g., Gibson & Brandt, 2012).
The X-ray spectra of J from Chandra and XMM-Newton, along with the best-fitting models, are displayed in Figure 5. Based on an earlier 4 ks Chandra observation of this source in 2006 Apr, Strateva et al. (2008) suggested that there appeared to be a strong Fe xxv K emission line at 6.7 keV with a width of 0.3 keV and an equivalent width of 700 eV. However, the spectrum had only 155 counts and the possible Fe emission was not reliably constrained. Given the improved Chandra and XMM-Newton observations, we do not see any significant excess at 6.7 or 6.4 keV (4.1 or 3.9 keV in the observed frame) in the observed spectra. Compared to the Chandra spectrum in Strateva et al. (2008), the Chandra X-ray flux in our analysis dropped by , within the expected range for typical AGN variability. We refit the spectra by adding a Gaussian component at 6.7 (or 6.4) keV with a width fixed at 0.3 keV; the resulting models do not provide improved fits compared to the simple power-law models based on -tests. The 90% confidence upper limit on the equivalent width is eV for a 6.7 (or 6.4) keV line.999The derived upper limit depends on the assumed line width. In the case of a typical narrow line width of 0.02 keV (1000 km s-1), the corresponding upper limit on the equivalent width is eV. In fact, the expected narrow Fe K equivalent width for a radio-quiet AGN with a similar X-ray luminosity to J is eV, given the X-ray Baldwin effect for Fe K lines (e.g., Jiang, Wang & Wang 2006; Wu et al. 2009). Therefore, we did not detect the Fe xxv K emission in J tentatively reported in the previous study.

5 MULTIWAVELENGTH PROPERTIES
5.1 Spectral Energy Distributions
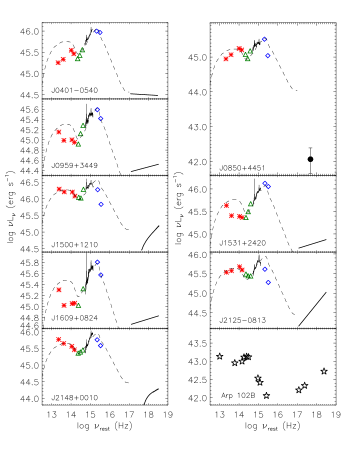
We gathered multiwavelength photometric data for our sample objects to investigate their spectral energy distributions (SEDs). We obtained infrared (IR) 3.4 m, 4.6 m, 12.0 m, and 22.0 m data from the Wide-field Infrared Survey Explorer (WISE; Wright et al. 2010), and near-infrared (NIR) -, -, and -band data from the Two Micron All Sky Survey (2MASS; Skrutskie et al. 2006). The 2MASS magnitudes in the SDSS DR7 quasar catalog were used; this catalog provides aperture photometry for additional sources detected down to 2 (see Section 5 of Schneider et al. 2010). All eight sources are detected in all the IR–NIR bands except for J in the band. We also searched for near-UV (NUV, Å) and far-UV (FUV, Å) data from the Galaxy Evolution Explorer (GALEX; Martin et al. 2005); all sources are detected. Using the above data, the SDSS spectra, and the Chandra best-fitting spectra, we constructed rest-frame SEDs for the sample objects, as shown in Figure 6. The SDSS spectra and UV data have been corrected for Galactic extinction following the dereddening approach presented in Calzetti et al. (2000). For J, we do not have an X-ray spectrum, and thus we converted the full-band net counts to the rest-frame 2 keV luminosity using PIMMS, assuming a photon index of .101010This approach overestimates the rest-frame 2 keV luminosity as well as the X-ray-to-optical power-law slope parameter discussed below (Section 5.2), as there were no soft-band photons detected. However, even the overestimated X-ray luminosity is still significantly lower than expectations for typical quasars (see Section 5.2). We note that the multi-band observations are not simultaneous, and thus the SEDs are subject to uncertainties caused by potential source variability (e.g., the optical variability of J in Section 3).
We show in Figure 6 the radio-quiet quasar SED template from Richards et al. (2006), scaled to the luminosities at rest-frame GHz (3000 Å) of our SEDs. From the NIR to the UV, the SEDs are in good agreement with the template in general. In the IR, a few objects (J, J, and J) show relatively weaker rest-frame 2–3 m emission,111111J shows weaker emission at rest-frame 8–14 m, different from the other three IR-weak objects. At these wavelengths, the IR SED may have some contribution from the star-formation activity in the host galaxy (e.g., Desai et al., 2007; Shi et al., 2007; Rafferty et al., 2011). by a factor of –1.5. The scatter is within the 1 deviation of the template SED in each case (Richards et al., 2006). These sources are luminous quasars, and thus host galaxies should have negligible contributions to the optical continuum at rest-frame 3000 Å, where the template scaling was performed; however, the relative scaling could have been affected by optical variability. The IR SED shapes of the three IR-weak sources are similar to those of the class I hot-dust-poor (HDP) AGNs defined in X-ray selected and optically-selected AGN samples (Hao et al., 2010; Hao et al., 2011), although the fractions of HDP AGNs in those samples are . HDP AGNs are likely associated with smaller covering factors of dust tori than typical AGNs, which do not obviously appear to be physically connected to the disc-like emission lines that originate from a much smaller scale disc region. To assess further the possibility of an intrinsic connection between IR weakness and disc-like emission lines, we constructed optical-to-IR SEDs for 47 disc-like emitters in the Strateva et al. (2003) sample that have a bolometric luminosity erg s-1; relatively luminous sources were chosen so that most of them would show typical quasar emission from a standard accretion disc. Among these 47 sources, only three show clear signs of a deficit of IR emission. Since the host galaxy might have a significant contribution to the rest-frame m emission when erg s-1 (e.g., Stern & Laor, 2012), we also examined the HDP AGN fraction among higher luminosity samples in Strateva et al. (2003). Among the 17 disc-like emitters with erg s-1, two () are probably HDP AGNs, and neither of the two erg s-1 objects show an IR deficit. Therefore, we cannot confirm that the IR weakness observed in three of our objects is intrinsically connected to their disc-like line profiles.
We estimated the bolometric luminosities of the sample objects by integrating the scaled SED templates and then adding the corresponding 0.5–10.0 keV X-ray luminosities. The X-ray luminosities were derived from the XSPEC models corrected for Galactic absorption or from PIMMS (for J). The X-ray-to-bolometric ratios are small, being –7% for the five unobscured sources. The resulting bolometric luminosities are listed in Table 2; these luminosities have uncertainties caused by non-simultaneous observations of the SED data and potential source variability.
High-luminosity disc-like emitters appear to have different SED shapes from their low-luminosity counterparts (e.g., Strateva et al., 2008; Luo et al., 2009). We show in Figure 6 the SED of Arp 102B for comparison. The SEDs of our eight objects show a big blue bump (BBB) in the UV (), while the Arp 102B SED is more than two orders of magnitude fainter and lacks a BBB.121212The IR bump of the Arp 102B SED is probably dominated by the emission from the host galaxy. However, the argument for the absence of a BBB is based on the shape of the SED in the UV through X-ray bands. The weakness of the UV continuum cannot be attributed to reddening based on the following two considerations: (a) The reddening toward the nucleus, as judged from the relative strengths of the broad Balmer and Mg ii lines, is not high enough to extinguish the UV continuum and suppress any UV bump (Halpern et al., 1996; Eracleous & Halpern, 2003). In particular, the H/H ratio is 4.3, which is very typical of radio-loud AGNs (see Fig. 7 in Eracleous & Halpern 2003), i.e., no reddening is required by the data. (b) the absorption column density has been measured through X-ray observations and found to be cm-2 (Eracleous et al., 2003). Models for the absorbing medium by Eracleous et al. (2003) place it at a distance from the center comparable to that of the BLR and ascribe a high ionization parameter to it, which suggests that it is unlikely to be dusty. The difference may be attributed to different emission mechanisms in high- and low-luminosity sources: Arp 102B is powered by a radiatively inefficient accretion flow (RIAF; e.g., Rees et al., 1982; Narayan & Yi, 1994; Abramowicz et al., 2002; Eracleous & Halpern, 2003), while our high-luminosity objects likely have standard accretion discs that are radiating with high efficiency (e.g., Shakura & Sunyaev, 1973).
We also obtained radio flux information at 1.4 GHz for these sources. For sources detected by the Faint Images of the Radio Sky at Twenty-Centimeters (FIRST) survey (Becker, White & Helfand, 1995), the fluxes were taken from the FIRST source catalog (White et al., 1997). For sources not detected but still covered by the FIRST survey, the upper limits on the radio fluxes were set to mJy, where is the rms noise of the FIRST survey at the source position and 0.25 mJy is to account for the CLEAN bias (White et al., 1997). For the one source (J) that is not covered by the FIRST survey, we checked the NRAO VLA Sky Survey (NVSS; Condon et al. 1998) catalog and determined its flux upper limit to be 1.35 mJy, which is three times the rms noise of the NVSS. Utilizing the optical and radio data, We calculated the radio-loudness parameters, defined as (the ratio of flux densities in the rest frame; e.g., Kellermann et al., 1989). The 5 GHz and 4400 Å flux densities were converted from the observed 1.4 GHz and rest-frame 2500 Å flux densities assuming a radio power-law slope of (e.g., Falcke, Sherwood & Patnaik 1996; Barvainis et al. 2005) and an optical power-law slope of (; e.g., Vanden Berk et al. 2001). The radio-loudness parameters or the upper limits are listed in Table 4; all eight sources are radio quiet () with most having , in accordance with our sample selection in Section 2.
5.2 Distribution of the X-ray-to-Optical Power-law Slopes
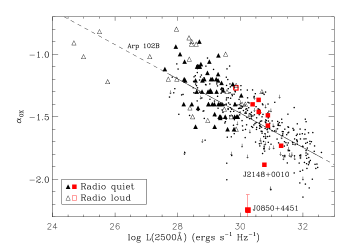
The X-ray-to-optical power-law slope parameter [] measures the X-ray brightness of a quasar relative to its optical/UV luminosity. We calculated the parameters for our sample objects and compared them to the expected values derived from the Steffen et al. (2006) – relation for radio-quiet quasars; the values and offsets are reported in Table 4. In Figure 7, we plot the locations of our sources and the Steffen et al. (2006) – relation;131313We extrapolated the Steffen et al. (2006) relation to lower luminosities than those originally used to define it. However, the values for low-luminosity AGNs will probably lie below the extrapolation as suggested by, e.g., Steffen et al. (2006) and Maoz (2007). The extrapolation was for illustrative purposes only and does not affect our analysis here. also shown are some disc-like emitters from previous studies (Eracleous & Halpern, 2003; Strateva et al., 2003; Strateva et al., 2006, 2008). Our eight sources reside at the high-luminosity end, and their parameters follow the – relation (within 1) except for J and J, which are likely X-ray weak due to the previously noted absorption (see Section 4). The X-ray luminosity of J is times smaller than that expected from its optical luminosity. The highest-redshift disc-like emitter, J, has a typical value despite its radio-loud nature.
For the overall radio-quiet disc-like emitter population, there is no sign of significantly diminished or enhanced X-ray emission observed in the – plot, and thus the disc-like line profiles are not connected to any level of excess X-ray emission. This conclusion is consistent with the finding in Strateva et al. (2006). While Strateva et al. (2008) suggested that the disc-like emitters in their sample have excess X-ray emission relative to the optical/UV emission, that result was based on only four radio-quiet objects which are exceptional disc-like emitters with the very broadest Balmer lines ( km s-1). Further investigation is needed to assess if the X-ray emission is unusually strong in the broadest disc-like Balmer line emitters or if the Strateva et al. (2008) result is simply due to small-number statistical fluctuations.
6 DISCUSSION
6.1 Energy Budget Requirements for the Line Emission
The energy budget problem is present in many disc-like emitters, as their H line luminosities are close to or even exceed the total gravitational power dissipated in the line-emitting region of the accretion disc (e.g., Chen, Halpern & Filippenko 1989b; Eracleous & Halpern 1994; Strateva et al. 2006). Following Equation 4 of Eracleous & Halpern (1994), which was derived by integrating Equation 20 of Chen et al. (1989b), we estimated the viscous power released in the line-emitting region () to be
| (1) |
An accretion efficiency of () was assumed for this equation. The inner and outer radii of the emission region are from the disc-model fit in Section 3. The derived energy budget of the disc region was then compared to the H luminosity, integrated from the best-fitting model. The and values are listed in Table 2; the to ratios have a range of 0.02–0.13 for our sample objects, with a median value of 0.05.
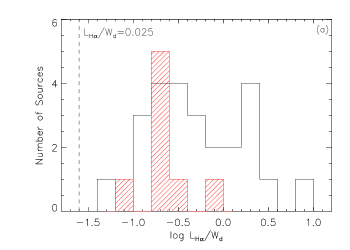
Assuming that the line emission is solely powered by the gravitational energy dissipated locally,141414Here we adopt the Shakura & Sunyaev (1973) notion of local energy dissipation, i.e., that torques in the disc convert kinetic energy to heat, which is deposited locally in the gas as thermal energy. we can derive the predicted ratio of H luminosity to total viscous power following Equations 3.3 and 3.4 of Dopita & Sutherland (1996). These authors calculate the radiative cooling via Balmer line emission of thermal plasmas for a wide range of conditions and the results are not dependent upon how the plasmas were heated.151515The thermal plasma assumption was adopted here only to assess if the disc-like line emission can be solely powered by the local gravitational energy. For a typical disc temperature of – K, the expected ratio of H luminosity to total power is about 0.003–0.005.161616The expected to ratio is estimated to be in Strateva et al. (2008). However, that ratio was derived from Williams (1980), who presents only the relative ratios of emission lines (i.e., continuum emission is not included). Therefore, 0.06 is an extremely conservative upper limit on the to ratio. The ratio would be even lower if there are radiative-transfer effects in the emission region (e.g., see Fig. 5 of Murray & Chiang, 1997). Therefore, the expected ratio of H luminosity to total power is much smaller than the observed values above (0.02–0.13), indicating that our sample objects require additional energy (likely in the form of external illumination) to power the line emission. In Figure 8a, we show the distribution of to ratios of our eight objects and 25 disc-like emitters (including Arp 102B) from Eracleous & Halpern (2003), Strateva et al. (2008), and Luo et al. (2009), where the H luminosities for our sources were converted from their H luminosities assuming a typical Balmer decrement of 5 ().171717 This Balmer decrement was derived by taking the average of values for luminous disc-like emitters in Eracleous & Halpern (2003). The standard deviation of this average is about 1. Given such a Balmer decrement, the ratio of H luminosity to disc viscous energy should not exceed 0.025 for a thermal plasma, and thus all these disc-like emitters require external illumination of the accretion disc.
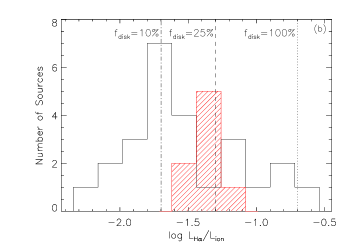
It is therefore likely that the accretion disc is photoionized and a thin “skin” emits the observed lines. The source of photoionization is considered to be the UV-to-X-ray emission produced in the inner disc/corona (e.g., Chen & Halpern, 1989). We calculated the available ionizing luminosity () by integrating the source SED blueward of 13.6 eV. For our luminous disc-like emitters, the SED shapes are similar, and the ionizing-to-bolometric luminosity ratios are . As the X-ray-to-bolometric ratios are small (see Section 5.1), the ionizing luminosity is dominated by extreme UV emission.181818The majority of the extreme UV portion of the Richards et al. (2006) template SED was, by necessity, not covered by observational data, and was instead derived by interpolating the UV and soft X-ray data. The estimated ionizing luminosity is therefore subject to some uncertainty. For low-luminosity sources, such as Arp 102B, the SED shapes are different (see Figure 6); however, the ionizing-to-bolometric luminosity ratios are also coincidentally , and the ionizing luminosity is dominated by X-ray emission. In Figure 8b, we show the distribution of to ratios for our eight objects and the 25 disc-like emitters from literature (the same sample as used in Fig. 8a). The H line luminosity produced by the photoionized disc depends on the fraction of the ionizing energy that is intercepted by the line-emitting region of the disc (we define this fraction as ) and the fraction of the input energy that can be emitted as H. For the latter, the fraction is estimated to be for a photoionized disc (Section 4.2 of Collin-Souffrin & Dumont 1989). Using the above relation, we plot in Figure 8b the expected values when , 25%, or 10%. It appears that for a significant fraction of the disc-like emitters, is required for the UV-to-X-ray emission to ionize the outer disc and produce the Balmer lines. In some cases, is probably required. The median required value is for all the sources shown in Figure 8b, and it is for our sample objects. We caution that due to various uncertainties in the estimations of the luminosities and luminosity relations, it is not feasible to calculate the precise values for individual sources, and the requirement above is only valid in a statistical sense.
For the general population of AGNs, similar energy budget analyses considering the line luminosity and available ionizing power have also placed constraints upon the covering factor of the BLR, which is estimated to be –40% (see, e.g., Maiolino et al. 2001 and references therein). In particular, Korista, Baldwin & Ferland (1998) have been able to reproduce the equivalent widths of the UV emission lines and the Baldwin effect in the context of the ”locally optimally emitting cloud” model with a covering factor of 0.5. Under the traditional picture of the BLR, where it consists of discrete “clouds” surrounding the nucleus and it is illuminated directly by the ionizing continuum, such a covering factor can be straightforwardly achieved. Additionally, the lack of Lyman continuum absorption (e.g., MacAlpine 2003 and references therein) and the high covering factor imply that the BLR does not cover the nucleus uniformly, and it has been suggested that the BLR is flattened in the plane of the disc (e.g., Maiolino et al., 2001; Gaskell, 2009, and references therein). For disc-like emitters, the BLR (at least for the low-ionization broad lines) is thought to be the skin of the outer accretion disc, and its structure has much less uncertainty/flexibility. The radius of the BLR ranges from a few hundred to a few thousand , and the vertical extent is very limited for a standard disc. Therefore, the requirement upon places strong geometric constraints on the inner structure of the AGN central engine.
The emission from the inner disc can ionize the line-emitting region of the outer disc (BLR) via direct illumination. For low-luminosity disc-like emitters (e.g., Arp 102B), the inner disc may have a vertically extended structure, such as a geometrically thick and optically thin RIAF. Chen & Halpern (1989) calculated that the outer disc can subtend a maximum solid-angle fraction of 21%, assuming that the inner disc is a spherical, optically thin illuminating source with radius . For the high-luminosity sources in our sample, the accretion disc is likely geometrically thin (see Section 5.1 for SED comparisons of high- and low-luminosity sources), and thus the outer disc should subtend a much smaller solid angle provided the disc is flat. It appears that direct illumination for a flat disc cannot provide enough energy to power the observed Balmer lines in some disc-like emitters, both high-luminosity and low-luminosity, as indicated by the required values shown in Figure 8b. A warped accretion disc induced by nuclear radiation (e.g., Maloney, Begelman & Pringle 1996; Pringle 1996) or other effects may increase the solid angle subtended by the line-emitting region of the outer disc and provide a possible solution for the energy budget problem (e.g., Wu, Wang & Dong, 2008).
Another possible mechanism for redirecting ionizing photons toward the outer disc (BLR) is scattering, where the emission from the inner disc is scattered back toward the outer disc by an ionized medium (e.g., Dumont & Collin-Souffrin, 1990b). For low-luminosity disc-like emitters, the ionizing luminosity is dominated by X-ray emission, and the scattering gas may be from a jet or outflow (Cao & Wang, 2006). For the high-luminosity sources presented here, the ionizing luminosity is dominated by UV emission, and the scattering medium must be highly ionized in order to scatter UV photons efficiently.191919The small radio-loudness parameters of our eight objects indicate that radio jets play a minor role, if any, in the scattering process. In either case, significant X-ray obscuration, probably highly ionized, would be seen if the observer’s line of sight passes through the scattering gas. Among the limited samples studied with Chandra or XMM-Newton in Strateva et al. (2006), Strateva et al. (2008), and this paper, the fraction of disc-like emitters with significant intrinsic absorption ( cm-2) is –40%, which constrains the covering factor of the scattering gas.202020Only type 1 AGNs are considered here. Therefore, the covering factor might also depend on the ratio of type 1 to type 2 AGNs. Assuming a type 1 to type 2 ratio of for high-luminosity AGNs (e.g., Reyes et al., 2008; Lawrence & Elvis, 2010) and that all type 2 AGNs have the scattering medium, the covering factor could be as high as . A neutral intrinsic absorber was generally assumed to estimate the column densities for these sources, and the column densities would be higher if the medium is highly ionized. The fraction of the total ionizing luminosity reaching the outer disc depends on the gas covering factor, the Thomson optical depth of the gas, and the scattering geometry. Assuming a covering factor of , an optical depth of (corresponding to cm-2), and a geometric factor of (0.5 seems the absolute maximum possible value given the optically thin nature of the scattering gas), the value provided by scattering is . Given the requirement shown in Figure 8b, scattering alone is probably not sufficient to provide the required illumination of the line-emitting disc. A systematic Chandra or XMM-Newton spectral survey of a sample of disc-like emitters, obtaining sufficient counts () per object, could provide further constraints on the optical depth and covering factor of any putative scattering medium.
The gravitational energy dissipated locally may also collisionally ionize some fraction of the atoms in the disc skin and contribute to solving the energy budget problem (e.g., Collin-Souffrin, 1987). Given the expected to ratio above under the assumption of an emission region solely powered by viscous energy, we estimate that of the observed H luminosity could be produced by this type of collisional ionization for our objects here. Therefore, the emission lines appear to be mainly powered by direct illumination and scattering processes. On average, ( for our high-luminosity objects here) of the nuclear ionizing radiation is utilized to photoionize the line-emitting disc, although the mechanism is still not clear. Warped accretion discs are probably needed for direct illumination to work efficiently, especially in high-luminosity objects.
6.2 Connection with the General Population of AGNs
Disc-like emitters are closely related to the more general population of AGNs with single-peaked broad lines. The general properties of disc-like emitters are similar to those of typical AGNs, except for the disc-like and generally broader emission lines. In fact, a few AGNs have shown broad Balmer lines that fluctuate between a disc-like and a single-peaked profile on time-scales of years, e.g., NGC 5548 (e.g., Peterson et al., 1999; Sergeev et al., 2007), Pictor A (e.g., Halpern & Eracleous, 1994; Sulentic et al., 1995), and Akn 120 (e.g., Alloin, Boisson & Pelat, 1988). The eight objects presented here sample the high-luminosity and relatively high-redshift parameter space, and they still possess typical AGN SEDs and X-ray spectra. Since all relatively luminous AGNs are expected to have accretion discs, and such discs are capable of producing disc-like emission lines, it is puzzling why the majority of AGNs show single-peaked lines. The parameters of the line-emitting region, such as the disc inclination angle and the ratio of the inner to outer radius, do in principle affect the appearance of the line profile and in some cases result in single-peaked lines, though these alone may not be sufficient to explain the rare occurrence of disc-like emitters (see Section 1).
One promising model is the disc-wind scenario (e.g., Murray & Chiang, 1997; Eracleous & Halpern, 2003; Chajet & Hall, 2012; Flohic et al., 2012), where radiative-transfer effects through a disc wind in and above the line-emitting region of the disc can alter the emergent profile and produce a single-peaked line. Radiatively driven disc winds have long been suggested to be a common feature of AGNs (e.g., Murray et al., 1995). Calculations by Flohic et al. (2012) and Chajet & Hall (2012) show that the appearance of the observed line depends mainly on the optical depth of the wind and the line-emitting region parameters; a large optical depth () could result in a single-peaked line profile. With this model, the transitions from a single-peaked line to a disc-like line observed in a few sources can be naturally explained by a change in the optical depth of the wind. The observed small fraction () of disc-like emitters among AGNs suggests that most AGNs have winds with relatively large optical depths. Moreover, since the wind is radiatively driven, AGNs radiating at close to the Eddington limit (likely high-luminosity AGNs) should generally have stronger winds with larger optical depths than AGNs with low Eddington ratios (low-luminosity sources; e.g., Ganguly et al. 2007). Therefore, the fraction of disc-like emitters should decline with AGN luminosity. We found 14 disc-like emitters within the 3132 luminous AGNs searched (see Section 2), corresponding to a fraction of 0.4%, although our selection may not be complete owing to the fact that we only searched for secure disc-like emitters and may have missed some possible candidates (also see Footnote 3). Nevertheless, this derived fraction is a factor of smaller than the for the lower-luminosity sample in Strateva et al. (2003), likely consistent with the basic expectation from the disc-wind model. Moreover, we have not found any profiles with widely separated peaks, reminiscent of those of low-luminosity objects such as Arp 102B. To compare the fractions of disc-like emitters among AGNs in different luminosity bins robustly, they must be identified in a uniform and systematic way for both the high-luminosity and low-luminosity samples, utilizing quantitative selection criteria. This is beyond the scope of the current paper.
The discovery of a BAL quasar, J, in our disc-like emitter sample is notable, as BAL quasars are also a sub-type of AGNs. BALs have been observed in of optically-selected quasars (e.g., Hewett & Foltz, 2003; Trump et al., 2006; Gibson et al., 2009). Similar to disc-like emitters, BAL quasars have indistinguishable IR-to-UV SEDs from non-BAL quasars (e.g., Gallagher et al., 2007), although BAL quasars usually show X-ray absorption as mentioned in Section 4.2. A popular interpretation is that BAL quasars and non-BAL quasars are the same type of object but with different viewing angles (e.g., Weymann et al., 1991; Ogle et al., 1999), or at least that orientation plays an important role in determining the presence of BAL features (e.g., DiPompeo, Brotherton & De Breuck, 2012). It is suggested that BALs are observed when our line of sight passes through the disc wind (e.g., Murray et al., 1995). Traditionally, such models have required that BAL quasars generally be viewed edge-on, with large inclination angles (). However, more recent results (DiPompeo et al. 2012 and references therein) suggest that BAL quasars can be seen over a wide range of inclination angles, with a tendency to be seen at larger inclination angles than non-BAL quasars. In the disc-wind scenario, this result constrains disc winds to flow out at different angles above the disc in different objects. The disc inclination angle of J derived by the disc-model fit in Section 3 is , the largest value of in our sample. Thus, it fits in with the result that BAL quasars tend to be seen at larger inclination angles than non-BAL quasars.
7 SUMMARY AND FUTURE WORK
The main results of this study are the following:
-
1.
We measured the X-ray and multiwavelength properties of eight high-luminosity ( erg s-1 Hz-1) and relatively high-redshift () disc-like emitters selected from SDSS DR7. These sources are located in a largely unexplored space of the luminosity-redshift plane. See Section 2.
-
2.
Our sample objects show disc-like H line profiles that can be well explained by emission from the outer region (hundreds to thousands of ) of a Keplerian accretion disc. The emission-region parameters are within the typical ranges found for other disc-like emitters. See Section 3.
-
3.
Seven sources have typical X-ray spectra with photon indices –2.0; two of them show some amount of X-ray absorption (– cm-2 when modeled using neutral gas). The other source, J, has only three keV photons observed and is probably heavily obscured ( cm-2). Based on the longer observations of J by Chandra and XMM-Newton, we did not detect the tentative Fe xxv K line emission reported by Strateva et al. (2008). See Section 4.
-
4.
We constructed IR-to-UV SEDs of the sample objects. All have typical quasar SEDs with a BBB in the UV, different from low-luminosity disc-like emitters. The emission mechanisms are probably different: low-luminosity sources are powered by RIAFs, while high-luminosity sources have standard accretion discs radiating with high efficiency. See Section 5.1.
-
5.
The X-ray-to-optical power-law slope parameters () for our sources follow the established – relation except for the two sources with significant X-ray absorption. There does not appear to be any significant excess X-ray emission for the radio-quiet disc-like emitter population overall. This high-luminosity and relatively high-redshift sample does not show any distinct features in terms of X-ray emission or multiwavelength properties. See Section 5.2.
-
6.
We analyzed the energy budget requirements for powering the emission lines. For disc-like emitters in general, external illumination is required. The inner disc should illuminate and ionize the outer disc efficiently via direct illumination and/or scattering; the median required value is , and it is for our high-luminosity objects. Scattering alone can provide an value of , insufficient to power the lines. Warped accretion discs are probably needed for direct illumination to work efficiently, especially in high-luminosity objects with geometrically thin discs. See Section 6.1.
-
7.
We discussed the disc-wind model that was proposed to explain the small fraction of disc-like emitters among the general AGN population, and we showed how our current results fit into the context of this model. See Section 6.2.
-
8.
We discovered a LoBAL quasar, J, among our disc-like emitters. This object demonstrates that disc-like emission lines and BALs are not exclusive phenomena. J has a relatively small disc inclination angle compared to traditional BAL quasars. See Sections 4.2 and 6.2.
Studies of disc-like emitters open a window to probing the inner structure of AGNs, such as the accretion disc, disc wind, and BLR. The high-luminosity and relatively high-redshift sample presented here places further constraints on the disc illumination-mechanism and the corresponding AGN components (accretion disc and scattering medium). Further spectral surveys of X-ray absorption in disc-like emitters will help to clarify the covering factor and optical depth of the scattering medium. A large and complete optical survey of disc-like emitters in different luminosity ranges, utilizing quantitative selection criteria, will determine whether the fraction of disc-like emitters decreases as luminosity increases, and thus assess the applicability of the disc-wind model. It will also be of interest to compare the detailed properties (e.g., SEDs and X-ray spectra) of AGNs with the same luminosity, similar line widths, but different broad emission-line profiles (e.g., single peaked vs. broad shoulders or flat tops), to try to find the underlying physics that determines the shape of the line profile.
We acknowledge financial support from NASA ADP grant NNX10AC99G (BL, WNB), Chandra X-ray Center grant GO1-12137X (BL, WNB), and NASA grant NNX08AW82G (WNB, ME). We thank the referee for carefully reviewing the manuscript and providing helpful comments.
Funding for the SDSS and SDSS-II has been provided by the Alfred P. Sloan Foundation, the Participating Institutions, the National Science Foundation, the U.S. Department of Energy, the National Aeronautics and Space Administration, the Japanese Monbukagakusho, the Max Planck Society, and the Higher Education Funding Council for England. The SDSS Web site is http://www.sdss.org/. The Hobby-Eberly Telescope (HET) is a joint project of the University of Texas at Austin, the Pennsylvania State University, Stanford University, Ludwig-Maximilians-Universität München, and Georg-August-Universität Göttingen. The HET is named in honor of its principal benefactors, William P. Hobby and Robert E. Eberly.
References
- Abazajian et al. (2009) Abazajian K. N., et al., 2009, ApJS, 182, 543
- Abramowicz et al. (2002) Abramowicz M. A., Igumenshchev I. V., Quataert E., Narayan R., 2002, ApJ, 565, 1101
- Alloin et al. (1988) Alloin D., Boisson C., Pelat D., 1988, A&A, 200, 17
- Arnaud (1996) Arnaud K. A., 1996, in Jacoby G. H., Barnes J., eds, Astronomical Data Analysis Software and Systems V Vol. 101 of ASP Conf. Ser., XSPEC: The First Ten Years. p. 17
- Barvainis et al. (2005) Barvainis R., Lehár J., Birkinshaw M., Falcke H., Blundell K. M., 2005, ApJ, 618, 108
- Becker et al. (1995) Becker R. H., White R. L., Helfand D. J., 1995, ApJ, 450, 559
- Boksenberg et al. (1977) Boksenberg A., Carswell R. F., Allen D. A., Fosbury R. A. E., Penston M. V., Sargent W. L. W., 1977, MNRAS, 178, 451
- Boroson & Meyers (1992) Boroson T. A., Meyers K. A., 1992, ApJ, 397, 442
- Brandt et al. (1997) Brandt W. N., Mathur S., Elvis M., 1997, MNRAS, 285, L25
- Broos et al. (2010) Broos P. S., Townsley L. K., Feigelson E. D., Getman K. V., Bauer F. E., Garmire G. P., 2010, ApJ, 714, 1582
- Calzetti et al. (2000) Calzetti D., Armus L., Bohlin R. C., Kinney A. L., Koornneef J., Storchi-Bergmann T., 2000, ApJ, 533, 682
- Cao & Wang (2006) Cao X., Wang T.-G., 2006, ApJ, 652, 112
- Chajet & Hall (2012) Chajet L. S., Hall P. B., 2012, MNRAS, submitted
- Chen & Halpern (1989) Chen K., Halpern J. P., 1989, ApJ, 344, 115
- Chen et al. (1989a) Chen K., Halpern J. P., Filippenko A. V., 1989a, ApJ, 339, 742
- Chen et al. (1989b) Chen K., Halpern J. P., Filippenko A. V., 1989b, ApJ, 339, 742
- Collin-Souffrin (1987) Collin-Souffrin S., 1987, A&A, 179, 60
- Collin-Souffrin & Dumont (1989) Collin-Souffrin S., Dumont A. M., 1989, A&A, 213, 29
- Condon et al. (1998) Condon J. J., Cotton W. D., Greisen E. W., Yin Q. F., Perley R. A., Taylor G. B., Broderick J. J., 1998, AJ, 115, 1693
- Corbin (1995) Corbin M. R., 1995, ApJ, 447, 496
- Desai et al. (2007) Desai V., et al., 2007, ApJ, 669, 810
- Dickey & Lockman (1990) Dickey J. M., Lockman F. J., 1990, ARA&A, 28, 215
- Dietrich et al. (2002) Dietrich M., Hamann F., Shields J. C., Constantin A., Vestergaard M., Chaffee F., Foltz C. B., Junkkarinen V. T., 2002, ApJ, 581, 912
- DiPompeo et al. (2012) DiPompeo M. A., Brotherton M. S., De Breuck C., 2012, ApJ, 752, 6
- Dopita & Sutherland (1996) Dopita M. A., Sutherland R. S., 1996, ApJS, 102, 161
- Dumont & Collin-Souffrin (1990a) Dumont A. M., Collin-Souffrin S., 1990a, A&A, 229, 313
- Dumont & Collin-Souffrin (1990b) Dumont A. M., Collin-Souffrin S., 1990b, A&A, 229, 302
- Eracleous & Halpern (1994) Eracleous M., Halpern J. P., 1994, ApJS, 90, 1
- Eracleous & Halpern (2001) Eracleous M., Halpern J. P., 2001, ApJ, 554, 240
- Eracleous & Halpern (2003) Eracleous M., Halpern J. P., 2003, ApJ, 599, 886
- Eracleous et al. (2003) Eracleous M., Halpern J. P., Charlton J. C., 2003, ApJ, 582, 633
- Eracleous et al. (2004) Eracleous M., Halpern J. P., Storchi-Bergmann T., Filippenko A. V., Wilson A. S., Livio M., 2004, in Storchi-Bergmann T., Ho L. C., Schmitt H. R., eds, The Interplay Among Black Holes, Stars and ISM in Galactic Nuclei Vol. 222 of IAU Symposium. p. 29
- Eracleous et al. (2009) Eracleous M., Lewis K. T., Flohic H. M. L. G., 2009, New A Rev., 53, 133
- Eracleous et al. (1995) Eracleous M., Livio M., Halpern J. P., Storchi-Bergmann T., 1995, ApJ, 438, 610
- Falcke et al. (1996) Falcke H., Sherwood W., Patnaik A. R., 1996, ApJ, 471, 106
- Flohic et al. (2012) Flohic H. M. L. G., Eracleous M., Bogdanović T., 2012, ApJ, 753, 133
- Freeman et al. (2002) Freeman P. E., Kashyap V., Rosner R., Lamb D. Q., 2002, ApJS, 138, 185
- Gallagher et al. (2002) Gallagher S. C., Brandt W. N., Chartas G., Garmire G. P., 2002, ApJ, 567, 37
- Gallagher et al. (2006) Gallagher S. C., Brandt W. N., Chartas G., Priddey R., Garmire G. P., Sambruna R. M., 2006, ApJ, 644, 709
- Gallagher et al. (2007) Gallagher S. C., Hines D. C., Blaylock M., Priddey R. S., Brandt W. N., Egami E. E., 2007, ApJ, 665, 157
- Ganguly et al. (2007) Ganguly R., Brotherton M. S., Cales S., Scoggins B., Shang Z., Vestergaard M., 2007, ApJ, 665, 990
- Garmire et al. (2003) Garmire G. P., Bautz M. W., Ford P. G., Nousek J. A., Ricker Jr. G. R., 2003, Proc. SPIE, 4851, 28
- Gaskell (2009) Gaskell C. M., 2009, New A Rev., 53, 140
- Gehrels (1986) Gehrels N., 1986, ApJ, 303, 336
- Gezari et al. (2007) Gezari S., Halpern J. P., Eracleous M., 2007, ApJS, 169, 167
- Gibson & Brandt (2012) Gibson R. R., Brandt W. N., 2012, ApJ, 746, 54
- Gibson et al. (2009) Gibson R. R., et al., 2009, ApJ, 692, 758
- Green et al. (2001) Green P. J., Aldcroft T. L., Mathur S., Wilkes B. J., Elvis M., 2001, ApJ, 558, 109
- Green et al. (1995) Green P. J., et al., 1995, ApJ, 450, 51
- Greenstein & Kraft (1959) Greenstein J. L., Kraft R. P., 1959, ApJ, 130, 99
- Halpern & Eracleous (1994) Halpern J. P., Eracleous M., 1994, ApJ, 433, L17
- Halpern et al. (1996) Halpern J. P., Eracleous M., Filippenko A. V., Chen K., 1996, ApJ, 464, 704
- Hao et al. (2011) Hao H., Elvis M., Civano F., Lawrence A., 2011, ApJ, 733, 108
- Hao et al. (2010) Hao H., et al., 2010, ApJ, 724, L59
- Hewett & Foltz (2003) Hewett P. C., Foltz C. B., 2003, AJ, 125, 1784
- Hewett & Wild (2010) Hewett P. C., Wild V., 2010, MNRAS, 405, 2302
- Hill et al. (1998) Hill G. J., Nicklas H. E., MacQueen P. J., Tejada C., Cobos Duenas F. J., Mitsch W., 1998, Proc. SPIE, 3355, 375
- Jackson et al. (1991) Jackson N., Perez E., Penston M. V., 1991, MNRAS, 249, 577
- Jiang et al. (2006) Jiang P., Wang J. X., Wang T. G., 2006, ApJ, 644, 725
- Just et al. (2007) Just D. W., Brandt W. N., Shemmer O., Steffen A. T., Schneider D. P., Chartas G., Garmire G. P., 2007, ApJ, 665, 1004
- Kellermann et al. (1989) Kellermann K. I., Sramek R., Schmidt M., Shaffer D. B., Green R., 1989, AJ, 98, 1195
- Komatsu et al. (2011) Komatsu E., et al., 2011, ApJS, 192, 18
- Korista et al. (1998) Korista K., Baldwin J., Ferland G., 1998, ApJ, 507, 24
- Kraft et al. (1991) Kraft R. P., Burrows D. N., Nousek J. A., 1991, ApJ, 374, 344
- Lawrence & Elvis (2010) Lawrence A., Elvis M., 2010, ApJ, 714, 561
- Leighly et al. (2011) Leighly K. M., Dietrich M., Barber S., 2011, ApJ, 728, 94
- Lewis & Eracleous (2006) Lewis K. T., Eracleous M., 2006, ApJ, 642, 711
- Lewis et al. (2010) Lewis K. T., Eracleous M., Storchi-Bergmann T., 2010, ApJS, 187, 416
- Luo et al. (2009) Luo B., et al., 2009, ApJ, 695, 1227
- MacAlpine (2003) MacAlpine G. M., 2003, in Reyes-Ruiz M., Vázquez-Semadeni E., eds, Revista Mexicana de Astronomia y Astrofisica Conference Series Vol. 18 of Revista Mexicana de Astronomia y Astrofisica Conference Series. p. 63
- Maiolino et al. (2001) Maiolino R., Salvati M., Marconi A., Antonucci R. R. J., 2001, A&A, 375, 25
- Maloney et al. (1996) Maloney P. R., Begelman M. C., Pringle J. E., 1996, ApJ, 472, 582
- Maoz (2007) Maoz D., 2007, MNRAS, 377, 1696
- Marsh (1988) Marsh T. R., 1988, MNRAS, 231, 1117
- Martin et al. (2005) Martin D. C., et al., 2005, ApJ, 619, L1
- (76) Miller
- Murray & Chiang (1997) Murray N., Chiang J., 1997, ApJ, 474, 91
- Murray et al. (1995) Murray N., Chiang J., Grossman S. A., Voit G. M., 1995, ApJ, 451, 498
- Nandra et al. (2003) Nandra K., Georgantopoulos I., Ptak A., Turner T. J., 2003, ApJ, 582, 615
- Narayan & Yi (1994) Narayan R., Yi I., 1994, ApJ, 428, L13
- Ogle et al. (1999) Ogle P. M., Cohen M. H., Miller J. S., Tran H. D., Goodrich R. W., Martel A. R., 1999, ApJS, 125, 1
- Oke (1987) Oke J. B., 1987, in Zensus J. A., Pearson T. J., eds, Superluminal Radio Sources Emission-line profile changes in 3C 390.3. p. 267
- Peterson et al. (1999) Peterson B. M., et al., 1999, ApJ, 510, 659
- Primini et al. (2011) Primini F. A., et al., 2011, ApJS, 194, 37
- Pringle (1996) Pringle J. E., 1996, MNRAS, 281, 357
- Rafferty et al. (2011) Rafferty D. A., Brandt W. N., Alexander D. M., Xue Y. Q., Bauer F. E., Lehmer B. D., Luo B., Papovich C., 2011, ApJ, 742, 3
- Ramsey et al. (1998) Ramsey L. W., et al., 1998, Proc. SPIE, 3352, 34
- Rees et al. (1982) Rees M. J., Begelman M. C., Blandford R. D., Phinney E. S., 1982, Nature, 295, 17
- Reeves & Turner (2000) Reeves J. N., Turner M. J. L., 2000, MNRAS, 316, 234
- Reeves et al. (1997) Reeves J. N., Turner M. J. L., Ohashi T., Kii T., 1997, MNRAS, 292, 468
- Reyes et al. (2008) Reyes R., et al., 2008, AJ, 136, 2373
- Richards et al. (2006) Richards G. T., et al., 2006, ApJS, 166, 470
- Rokaki et al. (1992) Rokaki E., Boisson C., Collin-Souffrin S., 1992, A&A, 253, 57
- Schneider et al. (2010) Schneider D. P., et al., 2010, AJ, 139, 2360
- Scott et al. (2011) Scott A. E., Stewart G. C., Mateos S., Alexander D. M., Hutton S., Ward M. J., 2011, MNRAS, 417, 992
- Sergeev et al. (2007) Sergeev S. G., Doroshenko V. T., Dzyuba S. A., Peterson B. M., Pogge R. W., Pronik V. I., 2007, ApJ, 668, 708
- Shakura & Sunyaev (1973) Shakura N. I., Sunyaev R. A., 1973, A&A, 24, 337
- Shen et al. (2011) Shen Y., et al., 2011, ApJS, 194, 45
- Shi et al. (2007) Shi Y., et al., 2007, ApJ, 669, 841
- Skrutskie et al. (2006) Skrutskie M. F., et al., 2006, AJ, 131, 1163
- Stauffer et al. (1983) Stauffer J., Schild R., Keel W., 1983, ApJ, 270, 465
- Steffen et al. (2006) Steffen A. T., Strateva I., Brandt W. N., Alexander D. M., Koekemoer A. M., Lehmer B. D., Schneider D. P., Vignali C., 2006, AJ, 131, 2826
- Stern & Laor (2012) Stern J., Laor A., 2012, MNRAS, 423, 600
- Storchi-Bergmann et al. (2003) Storchi-Bergmann T., et al., 2003, ApJ, 598, 956
- Strateva et al. (2008) Strateva I. V., Brandt W. N., Eracleous M., Garmire G., 2008, ApJ, 687, 869
- Strateva et al. (2006) Strateva I. V., Brandt W. N., Eracleous M., Schneider D. P., Chartas G., 2006, ApJ, 651, 749
- Strateva et al. (2003) Strateva I. V., et al., 2003, AJ, 126, 1720
- Sulentic et al. (1995) Sulentic J. W., Marziani P., Zwitter T., Calvani M., 1995, ApJ, 438, 1
- Trump et al. (2006) Trump J. R., et al., 2006, ApJS, 165, 1
- Vanden Berk et al. (2001) Vanden Berk D. E., et al., 2001, AJ, 122, 549
- Véron-Cetty et al. (2004) Véron-Cetty M., Joly M., Véron P., 2004, A&A, 417, 515
- Vestergaard & Wilkes (2001) Vestergaard M., Wilkes B. J., 2001, ApJS, 134, 1
- Weymann et al. (1991) Weymann R. J., Morris S. L., Foltz C. B., Hewett P. C., 1991, ApJ, 373, 23
- White et al. (1997) White R. L., Becker R. H., Helfand D. J., Gregg M. D., 1997, ApJ, 475, 479
- Williams (1980) Williams R. E., 1980, ApJ, 235, 939
- Worrall et al. (1987) Worrall D. M., Tananbaum H., Giommi P., Zamorani G., 1987, ApJ, 313, 596
- Wright et al. (2010) Wright E. L., et al., 2010, AJ, 140, 1868
- Wu et al. (2009) Wu J., Vanden Berk D. E., Brandt W. N., Schneider D. P., Gibson R. R., Wu J., 2009, ApJ, 702, 767
- Wu et al. (2008) Wu S.-M., Wang T.-G., Dong X.-B., 2008, MNRAS, 389, 213
- York et al. (2000) York D. G., et al., 2000, AJ, 120, 1579
- Young & Schneider (1980) Young P., Schneider D. P., 1980, ApJ, 238, 955
- Young et al. (1981) Young P., Schneider D. P., Shectman S. A., 1981, ApJ, 245, 1035
| Object Name | Observation | Observation | Exp | Exp_clean | Off-axis Angle | ||
|---|---|---|---|---|---|---|---|
| (SDSS J) | (arcsec) | Date | ID | (ks) | (ks) | (arcmin) | |
| (1) | (2) | (3) | (4) | (5) | (6) | (7) | (8) |
| 0.571 | 0.1 | 2011 Aug 27 | 12803 | 5.0 | 4.3 | ||
| 0.542 | 0.2 | 2011 Dec 29 | 12807 | 7.9 | 7.4 | ||
| 0.706 | 0.1 | 2012 Jan 11 | 12806 | 11.0 | 10.4 | ||
| 0.783 | 0.3 | 2011 May 29 | 12802 | 5.0 | 4.7 | ||
| 0.632 | 0.1 | 2002 Sep 25 | 3336 | 5.2 | 5.0 | ||
| 0.732 | 0.3 | 2011 Dec 29 | 12804 | 10.0 | 9.4 | ||
| 0.625 | 0.2 | 2008 Jul 10 | 9183 | 40.2 | 36.2 | ||
| 0.673 | 0.2 | 2011 May 20 | 12805 | 9.0 | 8.5 |
Note. — Col. (1): SDSS name. The sources are listed in order of increasing right ascension. J and J have archival Chandra data, and the others are Cycle 12 targets. Col. (2): redshift from Hewett & Wild (2010). Col. (3): angular distance between optical and X-ray positions. Cols. (4) and (5): Chandra observation date and ID. Col. (6): Chandra exposure time. Col. (7): Background-flare cleaned effective exposure time in the 0.5–8.0 keV band at the source position. Col. (8): off-axis angle of the source, defined as the distance between the source and the observation aim point.
| Object Name | FWHM | |||||||||||
|---|---|---|---|---|---|---|---|---|---|---|---|---|
| (km s-1) | () | () | (deg) | () | (km s-1) | (erg s-1) | (erg s-1) | (erg s-1) | ||||
| (1) | (2) | (3) | (4) | (5) | (6) | (7) | (8) | (9) | (10) | (11) | (12) | (13) |
| J | 7200 | 120 | 3700 | 20 | 1.8 | … | … | 900 | 43.9 | 46.7 | 45.4 | 0.03 |
| J | 9300 | 450 | 7000 | 34 | 2.1 | … | … | 1000 | 43.4 | 46.1 | 44.3 | 0.13 |
| J | 9400 | 110 | 2300 | 22 | 1.8 | … | … | 1300 | 43.6 | 46.2 | 45.0 | 0.05 |
| J | 6400 | 100 | 5000 | 19 | 2.0 | 1.7 | 900 | 950 | 44.5 | 47.2 | 46.0 | 0.03 |
| J | 11100 | 110 | 3500 | 22 | 2.4 | … | … | 1000 | 43.7 | 46.7 | 45.4 | 0.02 |
| J | 7300 | 130 | 2800 | 18 | 2.3 | 0 | 1500 | 800 | 43.7 | 46.4 | 45.1 | 0.04 |
| J | 8600 | 230 | 5000 | 29 | 1.8 | … | … | 800 | 43.6 | 46.5 | 45.0 | 0.05 |
| J | 11200 | 250 | 5000 | 33 | 2.3 | … | … | 1100 | 43.8 | 46.5 | 45.0 | 0.07 |
Note. — Col. (1): abbreviated SDSS name. Col. (2): FWHM of the broad H line. Col. (3): inner radius of the disc-emission region. Col. (4): outer radius of the disc-emission region. Col. (5): disc inclination angle. Col. (6): power-law index of the disc emissivity. A simple power-law or broken power-law model was used. Col. (7): power-law index of the disc emissivity outside the break radius, when adopting a broken power-law model. Col. (8): break radius, when adopting a broken power-law model. Col. (9): broadening parameter. Col. (10): integrated luminosity of the disc-like H line. Col. (11): bolometric luminosity estimated based on the Richards et al. (2006) SED templates (see Fig. 6). Col. (12): viscous power available locally in the emission region of the accretion disc. Col. (12): ratio of the H line luminosity to the local viscous power of the disc.
| Object Name | Full Band | Soft Band | Hard Band | dof | |||
|---|---|---|---|---|---|---|---|
| (0.5–8.0 keV) | (0.5–2.0 keV) | (2.0–8.0 keV) | () | () | |||
| (1) | (2) | (3) | (4) | (5) | (6) | (7) | (8) |
| J | 6.8 | 30.0/33 | |||||
| J | 2.6 | … | |||||
| J | 1.3 | 37.4/33 | |||||
| J | 2.4 | 8.3/22 | |||||
| J | 4.1 | 50.7/46 | |||||
| J | 4.0 | 48.9/48 | |||||
| J | 5.6 | 148/157 | |||||
| J | 5.9 | 78/80 |
Note. — Col. (1): abbreviated SDSS name. Cols. (2)–(4): X-ray counts in the full, soft, and hard bands. Col. (5): Galactic neutral hydrogen column density (Dickey & Lockman, 1990). Cols. (6)–(8): best-fitting spectral model from XSPEC fitting. We adopted an absorbed power-law model (wabs*zpow*zwabs). In cases where intrinsic absorption is not required, we adopted a power-law model (wabs*zpow) and the 90% confidence upper limits on the intrinsic hydrogen column densities are given. For J21480010, the statistic (cstat) was used in XSPEC due to this source’s limited number of source counts, and we fixed the photon index at . The -statistic value divided by the number of degrees of freedom is reported in col. (8) for this source. We did not attempt to fit the spectrum of J08504451 owing to the very small number of counts.
| Object Name | Count | ||||||||
|---|---|---|---|---|---|---|---|---|---|
| Rate | (0.5–10.0 keV) | ||||||||
| (1) | (2) | (3) | (4) | (5) | (6) | (7) | (8) | (9) | (10) |
| J | 72.06 | 44.98 | 8.96 | 30.88 | |||||
| J | 0.32 | 42.43 | 2.27 | 30.24 | |||||
| J | 42.02 | 44.92 | 1.88 | 30.39 | |||||
| J | 37.77 | 45.19 | 12.30 | 31.30 | |||||
| J | 95.22 | 45.25 | 7.22 | 30.88 | |||||
| J | 74.46 | 45.22 | 2.70 | 30.58 | |||||
| J | 58.72 | 45.10 | 3.78 | 30.59 | |||||
| J | 6.02 | 44.42 | 4.90 | 30.77 |
Note. — Col. (1): abbreviated SDSS name. Col. (2): absolute -band magnitude from SDSS. Col. (3): count rate in the 0.5–8.0 keV band in units of s-1. Col. (4): flux density at rest-frame 2 keV in units of erg cm-2 s-1 Hz-1. Col. (5): logarithm of the X-ray luminosity in the rest-frame 0.5–10.0 keV band corrected for Galactic absorption. Col. (6): flux density at rest-frame 2500 Å in units of erg cm-2 s-1 Hz-1. Col. (7): logarithm of the monochromatic luminosity at rest-frame 2500 Å. Col. (8): X-ray-to-optical power-law slope, defined as . The flux density is measured per unit frequency. Col. (9): the difference between the measured and expected . . The statistical significance of this difference, , is measured in units of the rms of the expected as given in Table 5 of Steffen et al. (2006). Col. (10): radio-loudness parameter (see Section 5.1).