The Herschel DIGIT Survey of Weak-line T Tauri Stars: implications for disk evolution and dissipation⋆
Abstract
As part of the “Dust, Ice, and Gas In Time (DIGIT)” Herschel Open Time Key Program, we present Herschel photometry (at 70, 160, 250, 350 and 500 m) of 31 Weak-Line T Tauri star (WTTS) candidates in order to investigate the evolutionary status of their circumstellar disks. Thirteen stars in our sample had circumstellar disks previously known from infrared observations at shorter wavelengths, while eighteen of them had no previous evidence for a disk. We detect a total of 15 disks as all previously known disks are detected at one or more Herschel wavelengths and two additional disks are identified for the first time. The spectral energy distributions (SEDs) of our targets seem to trace the dissipation of the primordial disk and the transition to the debris disk regime. Seven of the 15 disks appear to be optically thick primordial disks, including two objects with SEDs indistinguishable from those of typical Classical T Tauri stars, four objects that have significant deficit of excess emission at all IR wavelengths, and one “pre-transitional” object with a known gap in the disk. Despite their previous WTTS classification, we find that the seven targets in our sample with optically thick disks show evidence for accretion. The remaining eight disks have weaker IR excesses similar to those of optically thin debris disks. Six of them are warm and show significant 24 m Spitzer excesses, while the last two are newly identified cold debris-like disks with photospheric 24 m fluxes, but significant excess emission at longer wavelengths. The Herschel photometry also places strong constraints on the non-detections, where systems with / 5–15 and / 10-3–10-4 can be ruled out. We present preliminary models for both the optically thick and optically thin disks and discuss our results in the context of the evolution and dissipation of circumstellar disks.
1 Introduction
Circumstellar disks are an unavoidable outcome of the star-formation process and the sites where planets form. Understanding their evolution and dissipation is key for planet formation theory. Early in their evolution, most optically visible pre-main-sequence (PMS) stars are surrounded by relatively massive ( 5 MJUP) disks that are still accreting material onto the stellar surface through magnetically channeled accretion flows (Bouvier et al. 2007). These objects are spectroscopically classified, based on their strong H emission, as Classical T Tauri stars (CTTSs) or Herbig Ae/Be stars, the higher mass counterparts to CTTSs, if the stellar mass is higher than 2 M⊙. PMS stars without such evidence for ongoing magnetospheric accretion are known as weak-line T Tauri stars (WTTSs). Historically, the dividing line between these two groups was a H equivalent width (EW) of 10 Å. However, this initial boundary was mostly driven by the sensitivity limit of early objective-prism surveys (e.g., Wilking et al. 1987) and has been refined multiple times in more recent years (see Section 3.1).
Since they lack strong H emission and (typically) near-IR excess, WTTSs are less conspicuous than their accreting counterparts, but can be identified as young PMS stars from a number of youth indicators, including X-ray emission (Wichmann et al. 1996, 1997), Li I (6707 Å) absorption stronger than that of a Pleiades star of the same spectral type (Covino et al. 1997), and/or their position in the Hertzsprung–Russell diagram. Spitzer surveys of WTTSs (Padgett et al. 2006; Cieza et al. 2007; Wahhaj et al. 2011) have shown that the vast majority ( 80 ) of WTTSs in nearby molecular clouds have lost their disks and that the few WTTSs that still retain circumstellar material exhibit a wide range of properties (e.g., SED morphology, disk inner radius, Ldisk/L⋆) that bridge the gap between the CTTS and debris disk regimes. CTTSs have primordial gas-rich disks and usually show optically thick excess emission that extends all the way from the near-IR to the far-IR. Debris disks are gas poor and are characterized by optically thin IR excess emission that is mostly detectable in the far-IR and is believed to trace belts of second-generation dust produced by the collision of planetesimals (Wyatt 2008). The properties of WTTS disks overlap with those of both the CTTS and debris disk population and may trace evolutionary stages between the two. Also, (sub)millimeter observations of WTTSs show that there is a very strong correlation between the lack of accretion and a very low disk mass (Andrews Williams, 2005, 2007; Cieza et al. 2010, 2012a). WTTSs are thus ideal laboratories to study disk evolution and, in particular, their dissipation.
Circumstellar disks are complex systems that may evolve through a number of physical processes, including viscous accretion (Hartmann et al. 1998; Flock et al. 2011), grain growth and dust settling (Brauer, Dullemond & Henning 2008; Dullemond Dominik 2004), photoevaporation (Alexander et al. 2006; Gorti et al. 2009; Owen et al. 2011), and dynamical interactions with (sub)stellar companions (Artymowicz & Lubow, 1994). Planet formation through core accretion (Lissauer Stevenson, 2007) or gravitational instability (Durisen et al. 2007) is also expected to play a major role in disk evolution. Furthermore, it is increasingly clear that multiple evolutionary paths exist and that not all disks evolve in the same way or at the same rate (see Williams Cieza (2011) for a recent review on primordial circumstellar disks and their evolution). Since WTTS disks have already undergone significant evolution, their incidence and properties can provide valuable constraints on each one of the aforementioned disk processes and on the transition between the primordial and debris disk stages.
In this study, part of the “Dust, Ice, and Gas In Time (DIGIT)” Herschel Open Time Key Program, we present Herschel (Pilbratt et al. 2010) photometry (70 m to 500 m) of 31 WTTS candidates and investigate the properties and evolutionary status of their disks. In §2 we describe our sample selection, the Herschel observations, and the data reduction. In §3 we describe the models we use to constrain the properties of both optically thin and optically thick disks. In §4 we discuss the nature of each one of our disks and place our results in the broader context of disk evolution. Finally, a summary of our main results and conclusions is presented in §5.
2 Observations and Data reduction
2.1 Target Selection
We selected our sample from the literature of young stellar objects in nearby (d 200 pc) star-forming regions and young stellar associations (age 10 Myrs). The two selection criteria were a previous WTTS classification and the availability of Spitzer data (3.6 to 24 m photometry and/or Infrared Spectrograph spectra) for disk identification purposes. The WTTS classification criteria found in the literature are far from homogenous, but all are based on the equivalent width or velocity dispersion of the H line. Despite their previous WTTS classification, we find evidence for accretion in 7 of our targets (see Section 3.1 for a detailed discussion). Of our 31 targets, 8 are located in Taurus (Padgett et al. 2008), 5 in the and Chameleon associations (Sicilia-Aguilar et al. 2009; Brown et al. 2007), 4 in the TW Hydra association (TWA, Low et al. 2005), 4 in Lupus, and 10 in Ophiuchus (Evans et al. 2007). Thirteen of them had Spitzer-identified disks, while the other eighteen had no previous evidence for a disk. Twenty nine of our objects are K and M-type stars. Two of them are G-type stars. All of our targets are well-studied objects with multiple signatures of youth: they seem overluminous, show H and X-ray emission, and/or Li I absorption stronger than that of a Pleiades star of the same spectral type. They can thus be considered bona fide young stellar objects. However, their individual ages are highly uncertain. In particular, individual interlopers as old as 100 Myr can not be ruled out (Padgett et al. 2006). The most relevant stellar properties of our targets are listed in Table 1, including multiplicity information from adaptive optics imaging, aperture masking, and radial velocity observations.
2.2 Herschel photometry
We obtained far-IR and submillimeter wavelength photometry for our sample of WTTSs as part of the DIGIT Herschel Key Program using both the Photodetector Array Camera and Spectrometer (PACS, 70 and 160 m, Poglitsch et al. 2010) and the Spectral and Photometric Imaging Receiver (SPIRE, 250, 350 and 500 m, Griffin et al. 2010). The PACS observations were obtained using the Mini Scan Map mode, while the SPIRE observations were taken using the Small Scan Map mode. Most of the targets were observed with PACS at two scan angles (70 and 100 deg) for a better reduction of the 1/f noise. Due to observing time constraints in the DIGIT program, isolated objects free of significant cloud emission (e.g., TWA and Cha targets) were observed with a single PACS scan. The identification number, duration, and date of the PACS and SPIRE observations are listed in Table 2.
Both the PACS and SPIRE data were processed using HIPE (Herschel Interactive Processing Environment; Ott et al. 2010) version 7.1. We utilized a standard high-pass filtering script for PACS, appropriate for point-source observations, and a standard baseline-subtraction pipeline for SPIRE. When applicable, the two separate PACS OBSID s for a given object were processed together. The portions of scan legs where the telescope was stopped or not scanning at a uniform velocity were not used. The PACS beam sizes at 70 and 160 m are 5.5 and 11, and the data were resampled to 1 and 2 pixel images, respectively. SPIRE beam sizes at 250, 350 and 500 m are 18.1, 25.2 and 36.6, and the images were resampled to 6, 10, and 14 pixel images, respectively. In all cases, the pointing accuracy of the telescope ( 2; Eiroa et al. 2012) is significantly smaller than the beam size. As the next step in the data reduction, we ran the source-finding and PSF-fitting program c2dphot on the image produced by HIPE. The c2dphot software was used for the entire c2d Spitzer Legacy Project (Evans et al. 2003; 2009) and is based on the DOPHOT program (Schechter et al. 1993). This software uses an adjustable square box to fit sources with a (possibly) inclined plane background plus a point spread function (PSF). In the case of the Herschel data, we used a 9-pixel box. Because of this approach, the derived PSF-fit flux is relatively insensitive to the level or gradient in the background as long as the background is not highly structured on the scale of the PSF.
We first ran c2dphot in its standard mode, which finds peaks above the background and fits a PSF to the local maxima. We used the empirical PSF’s posted by the NASA Herschel Science Center111https://nhscsci.ipac.caltech.edu/sc/index.php/. The c2dphot algorithm detected (with S/N 5) fifteen of our targets at 70 m, the images of which are shown in Figure 1. Thirteen of these targets had previously known 24 m excesses. RXJ1625.2-2455b and ROXs 31 are newly identified disks. Similarly, 8 of our targets were detected at 160 m (see Figure 2). At SPIRE wavelengths, we detected only two objects: T Cha and TWA 7. T Cha was detected in all three SPIRE bands, while TWA 7 is seen only at 250 and 350 m. Their SPIRE images are shown in Figure 3. Most of the detections are consistent with point sources. Nevertheless, the 70 m images of ROXR1 13 and ROXs 47A and the 160 m images of RXJ1628.2-2405, Sz 96, ROXR1 13, ROXs 42C, and ROXs 47A seem to suffer from different levels of contamination by cloud emission because c2dphot finds “extended sources” at the location of the targets. The images of Sz 68 show an extended source or nebulosity north of the target, which does not seem to affect the 70 m detection, but completely dominates the emission at longer wavelengths. In these cases, we re-ran c2dphot in a mode that forces the program to fit a PSF at the position of the target. The use of this PSF-fitting mode should mitigate the flux contamination, but it is quite possible that we are still overestimating the far-IR fluxes of the sources listed above. To be conservative, we treat the fluxes suspected of contamination as upper limits when modeling the disks is Section 3.4.
Since the uncertainty images produced by HIPE 7.1 are not reliable, especially for PACS data, we follow Harvey et al. (2012a; 2012b) and estimate the photometric uncertainties by using c2dphot to estimate the noise at eight fixed positions around the target, but within the high-coverage area. For each one of the undetected objects, a similar grid was run to estimate upper limits from the noise at and around the location of each target. The resulting Herschel photometry and 3 upper limits for our 31 objects are listed in Table 3. In low background regions, we find 3- upper limits of the order of 3, 10, 20, 20, and 30 mJy at 70, 160, 250, 350, and 500 m, in agreement with the prediction of the Herschel Observation Planning Tool. However, these limits can be an order of magnitude higher in regions of strong background emission, especially at longer wavelengths.
2.3 High-resolution optical spectroscopy
Seven of our targets (T Cha, Sz 68, Sz 96, ROXR1 13, RXJ1628.2-2405, ROXs 42C, and ROXs 47) show significant excesses at the wavelengths sampled by Spitzer’s Infrared Array Camera (IRAC, 3.6 - 8.0 m). Since there is a very strong correlation between the presence of near-IR excess and accretion indicators (Hartigan et al.1995), these objects can be suspected to be weak accretors despite their WTTS classification.
In order to firmly establish their accretion status, we obtained Echelle spectroscopy for 6 of them using the ESPaDonS Echelle spectrograph on the 3.5-meter Canada-France-Hawaii Telescope (CFHT) at Mauna Kea Observatory in Hawaii. T Cha was excluded because it is far south and not visible from Mauna Kea. The observations were performed in service mode between June 06 and July 05, 2011 (the 2011A semester), under program 11AH96. The spectra were obtained in the standard “star+sky” mode, which delivers the complete optical spectra between 3500 Å and 10500 Å at a resolution of 68,000, or 4.4 km/s. For each object, we obtained a set of 2 spectra with exposures times ranging from 20 to 30 minutes each, depending on the brightness of the target. The data were reduced through the standard CFHT pipeline Upena, which is based on the reduction package Libre-ESpRIT222 http://www.cfht.hawaii.edu/Instruments/Spectroscopy/Espadons/Espadons_esprit.html. In the following section, we use these data to investigate the accretion properties of the 6 CFHT targets.
3 Results
3.1 Accreting weak-line T Tauri stars?
Before investigating the circumstellar properties of our objects, we review the accretion status of our targets. Nominally, CTTSs are accreting circumstellar material and WTTSs are non-accreting objects. However, since most WTTSs show H emission from chromospheric activity, establishing an exact observational boundary between WTTSs and CTTSs is problematic.
As mentioned in Section 1, the dividing line between CTTSs and WTTSs was initially set at a H equivalent width (EW) of 10 Å and was mostly driven by the sensitivity limit of early objective-prism surveys (e.g., Wilking et al. 1987). This boundary has more recently been refined to take into account different continuum levels of stars of different spectra types. Martín (1998) suggested the following boundary dependence with spectral type: 5 Å for spectral types earlier than M0, 10 Å for M0 to M2 stars, and 20 Å for later spectral types. White & Basri (2003) extended this dependence to hotter and cooler stars and suggested 3 Å for spectral types earlier than K0 and 40 Å for objects later than M5. Nevertheless, the width (, measured at 10 of the peak emission) and shape of the H profile obtained from high-resolution spectroscopy are now known to be more sensitive accretion diagnostics than H EWs derived from low-resolution data (Natta et al. 2004). Non-accreting objects show narrow ( 230-270 km/s) and symmetric line profiles of chromospheric origin, while accreting objects present broad ( 230-270 km/s) and asymmetric profiles produced by high-velocity magnetospheric accretion columns (Jayawardhana et al. 2003; White & Basri 2003). Regardless of the exact boundary used, magnetospheric accretion is highly variable (Jayawardhana et al. 2006; Nguyen et al. 2009) and can be sporadic. Thus, borderline objects can move back and forth between the CTTS and WTTS classification (e.g., Murphy et al. 2011).
Figure 4 shows the H velocity profiles of the 6 targets we have observed with the CFHT. We find evidence for weak but detectable accretion ( 270 km/s) in all of the CFHT targets except for ROXR1 13. However, ROXR1 13 has been previously shown by Jensen et al. (2009) to have a very variable H profile, ranging from pure absorption to broad emission ( 400 km/s). We also collected values from the literature for most of the other targets (see Table 1). Except for T Cha, all the literature values are consistent with chromospheric activity (V 230 km/s). Similar to ROXR1 13, T Cha is also known to have a very variable H profile suggesting sporadic accretion (Schisano et al. 2009).
3.2 Primordial disks, debris disks, and diskless stars
In Figure 5, we plot the [3.6]–[8.0] colors of our sample as a function of of the H line. We find that all the targets with 8.0 m excess show detectable levels of accretion, while none of the targets with photospheric IRAC colors do so. Accreting objects with near-IR excess can safely be considered gas-rich primordial disks. Non-accreting objects without near-, mid-, or far-IR excesses can be regarded as diskless stars within the limits of the survey. However, non-accreting objects with near-IR photospheric colors but significant mid- or far-IR excesses are more difficult to define. They are likely to be the “remnants” of primordial disks that have dissipated through accretion and photoevaporation. They contain the material that has not yet fallen into the star, formed large solid bodies, been evaporated, or been blown away by radiation pressure. Whether these objects share all of the properties of older debris disks (very gas-poor systems where the opacity is dominated by second-generation dust produced by the collision of planetesimals) remains to be established. Nevertheless, we refer to them as debris disks throughout the paper because they do show many of the key properties of debris disk systems: Ldisk/L⋆ 0.1, Mdust 1 M⊕, and lack of detectable accretion (Wyatt 2008). Non-accreting objects with Herschel excesses are hence labeled “debris disks” in Figure 5.
3.3 Full SEDs
We collected optical to (sub)millimeter photometry of all our targets from the literature (see Table 4) and constructed the full SEDs of the 15 objects with IR excesses. With the exception of RXJ1625.202455b, we also found Infrared Spectrograph (IRS) data for all of them in the Spitzer Archive. We find a huge diversity in SED morphologies in our sample. Two of the targets, Sz 68 and Sz 96, have SEDs that are indistinguishable from those of typical CTTSs (see Figure 6). Four other objects (ROXR1 13, RXJ168.2-2405, ROXs 42C, and ROXs 47A) have detectable IRAC excesses that fall well below the median SEDs of CTTSs (see Figure 7). The 6 objects in these first two groups are accreting primordial disks. We also find 6 objects (V819 Tau, RXJ0432.8+1735, REXC 3, RECX 4, TWA 7 and RXJ1603.2-3239) with photospheric IRAC fluxes but significant excesses at 24 m. These objects are non-accreting and we consider them to be “warm” debris disks (see Figure 8). There are two targets (RXJ1625.2-2455b, ROXs 31) with photospheric 24 m fluxes that have significant Herschel excesses (see Figure 9). We refer to these non-accreting objects as “cold” debris disks. Finally, there is T Cha, a pre-transition disk with strong near-IR excess, but showing a pronounced “dip” in the mid-IR that indicates the presence of a wide gap. The SED of T Cha has already been fully modeled by Olofsson et al. (2011) and Cieza et al. (2011). The photometry used to construct the SEDs corresponds to many different epochs, and young stellar objects can be highly variable in the optical and the near-IR (Herbst et al. 1982, Carpenter et al. 2001). This may explain the poor fit to the stellar photospheres in some of the objects (e.g., ROXR1 13 and ROXs 31).
3.4 SED modeling
3.4.1 Primordial disk models
As discussed in Section 3.2, all of our targets with IRAC (3.6 to 8.0 m) excesses seem to be accreting primordial disks. To model the SEDs of these objects (except for T Cha), we use the MCFOST radiative transfer code (Pinte et al. 2009). We describe the structure of the primordial disks with the following parameters: the inner and outer radii of the dust disk (Rin and Rout, respectively), the index for the surface density profile ( (r) = (r/50 AU)α ) and a dust disk scale height assuming a vertical gaussian distribution (exp[z2/2H(r)2]). The disk’s flaring is described by a power-law determining the scale height as a function of radius ( = H50(r/50 AU)β). The dust content is described by a differential power-law for the grain size distribution (d(a) d), between the minimum () and maximum () grain sizes. Dust stratification (i.e., small grains in the surface layer and large grains in the midplane) is needed to simultaneously explain the silicate features and millimeter wavelength slopes of many protoplanetary disks. Following Pinte et al. (2008), we hence adopt a parametric law to describe dust stratification, according to which scale height is a function grain size: . With this prescription, = 0 corresponds to a disk where the gas and dust are perfectly mixed (i.e., no dust stratification). For the grain composition, we use amorphous silicate grains with olivine stoichometry (Dorschner et al. 1995).
SED modeling is known to be highly degenerate without spatially resolved observations. We thus fix several of the parameters and try to constrain others. In particular, we adopt 3.5, consistent with grains in collisional equilibrium, = 3.9 mm, corresponding to 3 times the size of the longest SED point available, and = 0.1 m, a size sufficiently small to have a little effect on the SED. We also set Rout = 100 AU for single stars and = 1 as these parameters are particularly difficult to constrain without spatially resolved observations (Andrews et al. 2010). For close binary systems, by which we mean that the secondary is close enough to affect the disk, Rout is set to value smaller than the projected separation. Finally, we adopt = 0.0, except for systems where some dust stratification is needed to explain a particularly strong silicate feature, indicating that small grains dominate the regions probed by the mid-IR data (e.g., the surface layer of the disk). We are thus left with only 4 truly free parameters: , Rin, H50, and . These 4 parameters allow us to address 3 key disk evolution questions, namely 1) what are the surface densities and masses of these disks? 2) do they have inner holes? and 3) do they present evidence for dust settling (e.g., flat structures and/or dust stratification)?
The disk mass (Mdisk) is not a free parameter, but we estimate this important quantity by integrating the surface density profile of the dust over radius and assuming a gas to dust mass ratio of 100. Mdisk is very dependent on the values adopted for amax and the gas to dust mass ratio, which are highly uncertain and expected to evolve with time due to disk evolution processes such as photoevaporation, grain growth, and planet formation. We thus emphasize that the quantity constrained by our models is the total mass of dust with grain sizes from to that is located between Rin and Rout; thus, the Mdisk values derived should be taken with caution. In all cases, we fix the inclination of the disk to 60 deg. We note however that, unless the disk is very close to edge-on ( 85 deg), the inclination has no discernible effect on the emerging SED. The default parameters for our primordial disks models are listed in Table 5. As mentioned above, the default value is allowed to change, but only if needed to better fit the silicate feature. Similarly, Rout is allowed to change to a lower value, but only if the target is a close binary system.
As illustrated by our modeling work on T Cha (Cieza et al. 2011), unique disk parameters cannot be obtained from the SED alone, even if the SED is very well sampled. For each of the remaining optically thick disks, we therefore aim to find one model that fits the available data relatively well. The “best fit” models were obtained by trial and error, varying one parameter at the time in search of a minimum. For fitting purposes, the IRS spectra were binned and each bin treated as a photometry point. Upper limits were not used, except to discard models with fluxes exceeding those limits. The results thus must be considered to be highly preliminary.
However, even the preliminary models presented herein are expected to capture some of the key properties of the disks (e.g., the presence of a hole or dust settling) and can be used as the starting point for future, more detailed models. For ROXs 47A and ROXs 42C, we were unable to satisfactorily reproduce the SEDs using the parameterization discussed above. Instead, we present 2-zone disk models with different sets of parameters for the inner and outer disks (see Section 4.1.2). Similar 2-zone structures have already been invoked to simultaneously fit the SEDs and resolved submillimeter images of several other protoplanetary disks (e.g., Andrews et al. 2011; Cieza et al. 2012b; Mathews et al. 2012) and seem to be fairly common. The parameters for the best-fit models of the 6 primordial disks are listed in Table 6. For the disk parameters of the T Cha models, see Table 3 in Cieza et al. (2011).
3.4.2 Debris disk models
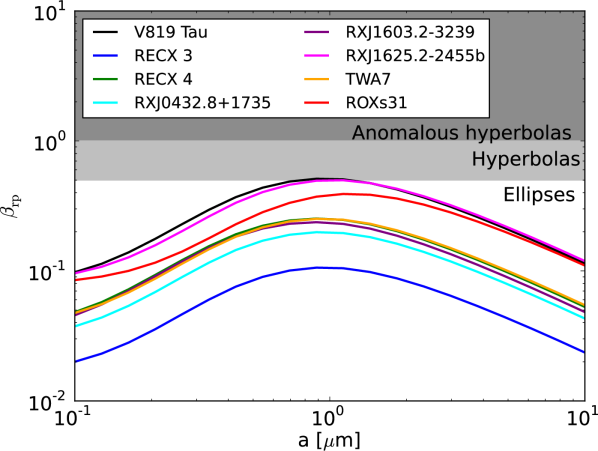
To model the objects that we have classified as cold and warm debris disks, we used the DEBRA code presented in Olofsson et al. (2012). Given the overall small signal-to-noise ratio of the Spitzer-IRS spectra, and the lack of any strong emission features associated with silicate dust grains, we used only one dust composition of astronomical silicates (optical constants from Draine 2003). We used the distribution of hollow spheres scattering theory (Min et al. 2005) to compute absorption efficiencies for sizes between m and mm. We checked that for each source, the adopted value does not violate the blow-out size. We computed the unitless ratio between radiation pressure and gravitational forces, for each star. The value as a function of grain size are shown in Figure 11. The threshold value for a rapid evacuation of dust grains is (see Krivov 2010), indicating that radiation pressure has a very limited effect on the observed debris disks in our sample. To limit the number of parameters, we fixed the surface density exponent to a value of and the grain size distribution exponent at the canonical value of (Dohnanyi 1969). The best fit to the IRS spectrum and Herschel detections is found via a Monte Carlo Markov Chain (emcee package; Foreman-Mackey et al. 2012) on the two free parameters ( and ). At each iteration, the total dust mass is scaled to best match the observed flux. As the primordial disk models described in the previous section, our debris disk models should be considered to be highly preliminary. Due to the sparse SED sampling and lack of spatially resolved data, important degeneracies remain. In particular, there is an intrinsic degeneracy between and the adopted value. Best fit parameters are reported in Table 7. Note that disk masses are given in M⊕, in contrast to units of MJUP used in Table 6.
4 Discussion
4.1 Individual Sources
In this section, we discuss the properties of each of our targets with IR excesses. We divide the sample into different categories, based on the accretion signatures and SEDs, corresponding to the five groups shown in Figures 6 to 10.
4.1.1 Border line CTTS/WTTS disks
The Lupus targets Sz 68 and Sz 96 have many properties indistinguishable from typical CTTSs. Their SEDs (see Figure 6) are close to the CTTS median, show no evidence for significant inner holes, and can be reproduced with relatively standard disk parameters (see Table 6). Both objects require some amount of dust settling in order to match their silicate features (i.e., the surface of their disks must be dominated by small grains, a few microns in size). For the Sz 68 disk, we adopt an outer radius of only 15 AU because it is a close binary system with a projected separation of only 0.13 (20 AU). Sz 68 and Sz 96 seem to be borderline objects moving back and forth across the CTTS/WTTS boundary. Hughes et al. (1994) report a very small H EW for Sz 68 (2.8 Å), while we find a large H velocity width (410 km/s). Conversely, Hughes et al. (1994) report a H EW of 11 Å for Sz 96, while accretion is barely detectable in our high-resolution spectra (H V 270 km/s, see Figure 4).
4.1.2 Evolved primordial disks
Four of our targets, RXJ1628.2-2405, ROXs 42C, ROXs 47A, and ROXR1 13 seem to still be accreting circumstellar material, but show very significant decrements of near-IR excess with respect to typical CTTSs (see Figure 7). We therefore refer to these objects as “evolved” primordial disks. We modeled RXJ1628.2-2405 as an extremely flat disk, extending from 0.8 to 100 AU, which has an scale height of 0.17 AU at a radius of 50 AU. However, we note that this extreme geometry could be an artifact of fixing the outer radius to 100 AU and a smaller disk could accommodate a larger scale height. We were unable to reproduce the SEDs of ROXs 47A and ROXs 42C using a continuous disk model because their SEDs are flat or rising at 15 m, between the 10 and 20 m silicate features. We find that models that fit well the SED shortward of 15 m significantly underestimate the observed fluxes between 20 and 160 m. On the other end, models that best match fluxes longward of 20 m do not match the observed near- to mid-IR fluxes. However, a good match to their entire SEDs can be obtained by introducing a discontinuity in the disks at 1.5-3 AU. The inner disks are very tenuous and contain 0.05 Moon masses of dust. Therefore, they could also be regarded as cavities filled with a small amount of dust grains. These models are clearly not unique, and similarly good fits can be obtained with smaller inner disks and gaps separating the inner and outer disks. In the case of ROXs 42C, we set the radius of the outer disk to 30 AU because ROXs 42C has a close companion with a projected separation of only 0.28 (35 AU). In our models, the disk masses of RXJ1628.2-2405, ROXs 47A, and ROXs 42C are 0.1-0.01 MJUP, even assuming a gas to dust mass ratio of 100. However, even in the optically thin limit, the far-IR emission is highly dependent on both the temperature and mass of the disk. This renders the mass estimates less reliable than those obtained from (sub)millimeter data.
Both the IRS spectra and the Herschel photometry of ROXR1 13 (also known as DoAr 21) are very contaminated by extended emission. Therefore, the modeling of the observed IR excess would not be very meaningful and we do not present a model. Jensen et al. (2009) obtained mid-IR sub-arcsecond images of the system and concluded that there is little material within 100 AU from the star. While a disk with a very large cavity can not be ruled out, they suggest that the observed IR excess is best explained by a small photodissociation region surrounding the star. Resolved imaging with the Atacama Large Millimeter/submillimeter Array could clarify the situation.
4.1.3 Warm debris disks
The targets V819 Tau, RXJ0432.8+1735, REXC 3, REXC 4, TWA 7, and RXJ1603.2-3239 have optically thin disks and show no evidence for accretion. They are thus consistent with gas poor debris disks. Since their IR excesses become evident in the mid-IR, we classify them as “warm” debris disks. Their SEDs are very well reproduced by our simple models (see Figure 8). They have inner radii ranging from 1 to 13 AU and outer radii in the 13 to 420 AU range. They contain 10-3 to 10-1 M⊕ of dust (see Table 7). We note that the fraction of low-mass stars with debris disks detectable via a 24 m excess is very low (4 ) in the field (Trilling et al. 2008) and that our young and “warm” debris disks are particularly interesting because they are likely to represent the initial conditions of the debris disk phenomenon. Models of planet formation through core accretion predict that the production of second-generation dust will first occur at small radii where the formation timescales for large ( 1000 km) planetesimals capable of stirring the disk are shorter (Kenyon Bromley, 2005).
4.1.4 Cold Debris disks
RXJ1625.2-2455b and ROXs 31 are the only systems in our sample without mid-IR excesses that we detected with Herschel. We classify them as “cold” debris disks. Their low incidence (2 detections versus 16 non-detections, see §4.1.6) is somewhat surprising considering that 16 of much older solar-type stars show significant 70 m excesses (Trilling et al. 2008) and might be a result of a delay in the production of large planetesimals (see section 4.2.4). Given the number of photometric points tracing the thermal emission of “cold” dust (1 and 2 data points for RXJ1625.2-2455b and ROXs 31, respectively), the modeling results are to be interpreted very cautiously. We modeled the SED of ROXs 31 with a disk extending from 40 to 360 AU Similarly, we reproduced the SED of RXJ1625.2-2455b with a disk extending from 600 to almost 900 AU (see Figure 9 and Table 7). Additional SED points and/or resolved imaging are much needed to better constrain the properties of these systems. In particular, the dimensions of the disk model for RXJ1625.2-2455b are quite extraordinary. Even though this object was detected as a point source at both 70 and 160 m, its 160 m image shows significant extended emission north-west of the source (see Figure 2), which could be affecting our photometry.
We also considered the possibility of an accidental alignment with an extragalactic source being responsible for the far-IR detections toward RXJ1625.2-2455b and ROXs 31. However, source counts at the relevant flux levels (20 mJy at 70 m and 100 mJy at 160 m) are of the order of 0.015-0.03/arcmin2 (Dole et al. 2004), rendering a chance alignment (within a FWHM distance) very unlikely (P 10-5 for any given source).
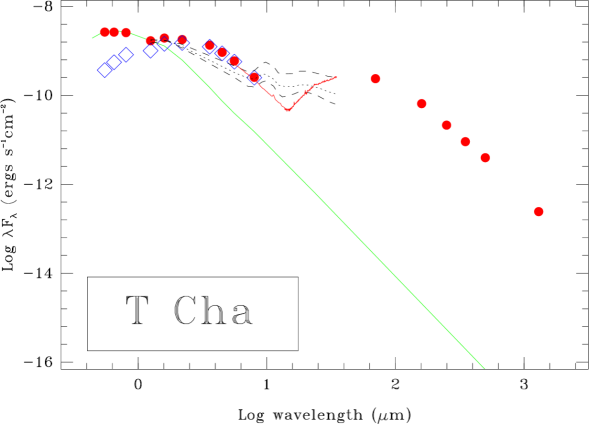
4.1.5 The T Cha pre-transition disk
T Cha is a G8 star with a very variable H profile (Schisano et al. 2009) suggesting sporadic accretion. Its SED (see Figure 10) shows a pronounced dip in the mid-IR that is characteristic of the so-called “pre-transition” disks (Espaillat et al. 2007), which have optically thin gaps separating optically thick inner and outer disk components. A detailed SED model for the T Cha disk, including the DIGIT Herschel data, has already been presented in Cieza et al. (2011). In short, the T Cha SED can be modeled with a very small inner disk extending from 0.13 to 0.17 AU and an outer disk with an inner edge located at 15 AU. The outer edge of the outer disk is not well constrained by the SED as the size and the surface sensitivity profile of the outer disk are highly degenerate values. However, T Cha shows a steep spectral slope at Herschel wavelengths, which favors models of outer disks containing little or no dust beyond 40 AU. We find that the full SED can be modeled equally well with either an outer disk that is very compact (only a few AU wide) or a much larger one (300 AU in radius) that has a very steep surface density profile due to the accumulation of material at the outer edge of the gap.
Huélamo et al. (2011) have recently reported the presence of a low-mass object candidate, possibly a young planet or a brown dwarf, within the gap of the T Cha disk. This putative object is likely to be responsible for the formation of the gap (Dobson-Robinson Salyk (2011) and could be related to the peculiar surface density profile of the outer disk if future resolved submillimeter images of the T Cha system confirm that material is accumulating at the outer edge of the gap.
4.1.6 Non-detections
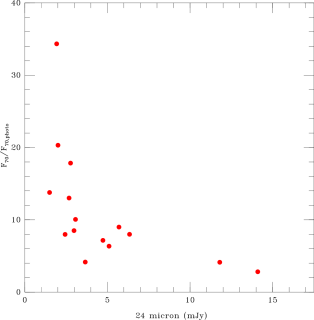
One important result from our survey is that objects with photospheric 24 m fluxes but large far-IR and submillimeter excesses are relatively rare. In our sample of 18 targets without Spitzer excesses, there are only two objects with Herschel detections, RXJ1625.2-2455b and ROXs 31. This implies that the overall disk fraction of WTTSs in nearby molecular clouds and young stellar associations is not much larger than the 20 value estimated from Spitzer observations (Cieza et al. 2007, Wahhaj et al. 2011). The vast majority of WTTSs do in fact seem to be diskless; however, the presence of a disk can only be ruled out within certain limits given by the depth and/or precision of the observations. In the case of our survey, the 70 m data are the most constraining. Therefore, as a first step to establish the limits of our survey, we plot the 70 m upper 3- limits divided by the expected photospheric value (calculated by extrapolating the observed mid-IR fluxes) as a function of the photospheric 24 m flux. As shown in Figure 12 (left panel), for most of our targets, our observations are sensitive to disks with 70 m fluxes 5-15 times higher than the stellar photospheres.
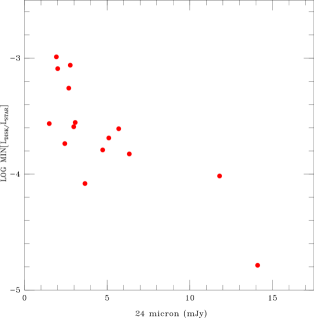
These 3- upper limits can be translated into minimum detectable disk luminosities, , by setting the emission peak at 70 m (T. Following Bryden et al. (2006), we calculate minimum disk luminosity as a function of 70 m upper limit, according to:
| (1) |
where is the expected flux of the star at 70 m. The minimum values that would be detectable in our sample are shown in Figure 12 (right panel). For most of our non-detections, disks fainter than 10-3–10-4 can not be ruled out. Given the strong temperature dependence in Equation 1, it is clear that the late types of the stars in our sample (mostly late K and M-type stars), could be a contributing factor to the high rate of non-detections.
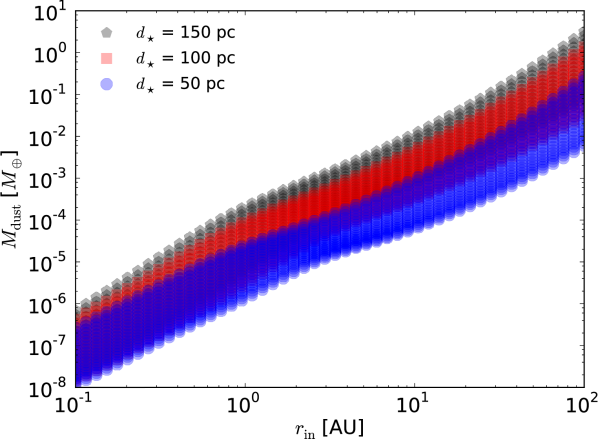
Converting the Herschel upper limits into dust mass constraints requires some modeling. Following Cieza et al. (2007; 2008b), we use the optically thin disk models discussed in Section 3.4.2 to constrain the maximum amount of dust that could remain undetected within the first 100 AU of the apparently diskless stars in our WTTS sample. Figure 13 shows the upper limits on the dust mass that can be hidden below our non-detections. We adopted the SED of the object RECX 6 ( pc), which is representative of our stellar sample (M0-type star), and ran a grid of models. We took 50 values for , logarithmically spaced between 0.1 and 100 AU. For the width of the disk () , we took 20 values, logarithmically spaced between 1.1 and 10. The 70 m flux is the most sensitive among our observations, and we adopted a 3 upper limit of 3 mJy. For each model of the grid, we scale the dust mass in order to reach this 3 flux level. We then repeated this exercise by scaling up and down the distance of RECX 6 to 150 and 50 pc, respectively, which are the maximum and minimum distances in our stellar sample (except for Sz 96 at 200 pc). The fluxes were scaled accordingly to the new distances. In Figure 13, blue circles, red squares, and black pentagons show the results of the three grids, for distances of 50, 100, and 150 pc, respectively. The spread in reflects the different values for the width of the disk.
For objects at 100 pc, we are sensitive to 10-5, 10-3, and 10-1 M⊕ of dust within 1, 10, and 100 AU from the central star. Of course, these limits only apply for dust grains with sizes between m and mm. Our models provide no constraints on the mass of solids that could be present in the form of larger bodies (i.e., planetesimals or planets) because their contribution to the opacity of the disk is negligible.
4.2 The broader context of disk evolution and dissipation
In Section 4.1, we have grouped our detected disks into several categories based on their SEDs and accretion properties. In this section, we discuss how the objects from each category might fit into the broader context of disk evolution and dissipation. As discussed in the introduction, protoplanetary disks evolve through a variety of physical processes, including viscous accretion, grain growth and dust settling, photoevaporation, and the dynamical interaction with stellar and substellar companions. The relative importance of all these processes is still not well understood, but the observational evidence and theoretical work seem to support the following emerging picture.
4.2.1 Primordial disk evolution
Early in their evolution, protoplanetary disks lose mass through accretion onto the star (Hartman et al. 1998), outflows, and photevaporation by UV photons and X-rays (Gorti et al. 2009). During this “mass depletion” stage, objects are classified as CTTSs based on their clear accretion signatures, and they maintain more or less constant IR SEDs as the entire disk remains optically thick to IR radiation. The main observational sign of evolution at this point is a rapid reduction in the (sub)millimeter fluxes with age as the mass of the disk is depleted and/or the opacity of the dust decreases due to grain growth (Rodmann et al. 2006; Lee et al. 2011) Depending on the initial conditions, the CTTS phase can last for up to 5 to 10 Myrs, but it can be much shorter ( 1 Myr) in some cases. For example, disks in close binary systems disappear more rapidly (Cieza et al. 2009; Kraus et al. 2011), and different initial core properties and evolution during the embedded phase can affect the disk evolution (Dunham Vorobyov 2012). Objects Sz 68 and Sz 96 are likely to represent late stages of the “mass depletion” stage. They still retain full disks with SEDs very close to the CTTS median, but these disks are not very massive ( 1-4 MJUP).
During the CTTS phase, dust settling steepens the slope of the mid-IR (Dullemond Dominik, 2004) and grain growth may generate inner opacity holes (Dullemond Dominik, 2005). Also, as the disk mass and accretion rate decrease, the accretion rate drops below the photoevaporation rate and the inner disk drains on a viscous timescale. The combination of grain-growth, dust settling, and/or photoevaporation can explain the properties of the disks around RXJ1628.2-2405, ROXs 47A, ROXs 42C, and (perhaps) ROXR1 13. All these evolved primordial disks have very low masses ( 0.1 MJUP) and strong evidence for inner holes and/or dust settling.
4.2.2 The primordial to debris disk transition
The formation of an inner hole through photoevaporation stops accretion and marks the rapid transition between the CTTS and the WTTS stage. At this point, the gaseous disk quickly photoevaporates from the inside out, leaving behind solid objects, which may collide with each other producing the second-generation dust seen in debris disks. The eight objects shown in Figures 8 and 9 seem to be past the stage when the inner disk has drained completely and photoevaporation prevents any further accretion onto the star. Whether their outer disks still contain any remaining gas or they are truly gas-poor debris disks is currently unknown.
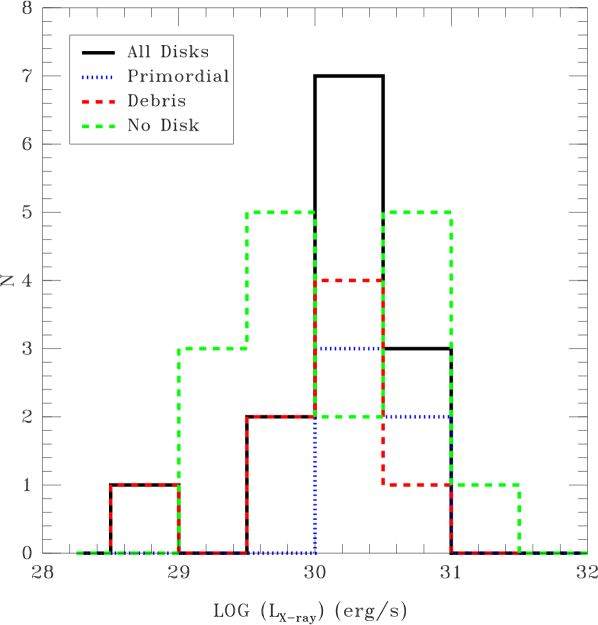
While it is clear that photoevaporation plays a central role in the final dispersal of the primordial disk and the transition to the debris disk stage, the dominant mechanism is not well established. EUV photoevaporation models (Alexander et al. 2006) predict low evaporation rates of the order of 10-10 M⊙yr-1 and should only become important once the accretion rate has fallen below this level. More recent FUV+X-ray photoevaporation models (Owen et al. 2011) predict much higher evaporation rates, which could reach levels of the order of 10-8-10-7 M⊙yr-1 and scale linearly with X-ray luminosity. Such large evaporation rates may be higher than the accretion rates of typical CTTSs and could drive the dissipation of the disk at early stages. Under such circumstances, one may expect to find an anti-correlation between X-ray luminosity and the presence of a primordial disk since the circumstellar gas should evaporate faster around the most X-ray luminous stars. Figure 14 shows that the distribution of X-ray luminosities (taken from Liebhart et al., in preparation) of our sample of WTTS divided into different categories: stars with disks, stars with primordial disks, stars with debris disks, and stars without a disk. No statistically significant difference is seen between any of the groups. This suggests that X-ray luminosity is not a dominant factor in disk evolution, possibly because the X-ray photoevaporation rates are lower than predicted by recent models or because other factors, such as the variability and evolution of the X-ray luminosity, and the mass, multiplicity, and age of the stars, are masking the signal in our small sample.
4.2.3 Alternative SED evolutionary paths
T Cha does not fit the above picture in which primordial disks remain optically thick in the IR at all radii until the entire disk suddenly dissipates from the inside out through photoevaporation. Instead, the gap in the T Cha disk is best explained by the dynamical interaction of one or more substellar objects embedded within the disk. The potential direct detection of such an object has been reported by Huélamo et al. (2011), but awaits confirmation. Recent hydrodynamical simulations of giant planets embedded in primordial disks by Dodson-Robinson & Salyk (2011) and Zhu et al. (2011) show that multiple giant planets are needed to produce gaps as wide as the one inferred for T Cha. Since pre-transition disks with obvious gaps like T Cha are very rare, they could represent special cases, where multiple massive planets may be present, rather than young solar system analogs with a single Jupiter-mass planet.
4.2.4 Non-detections, the formation of planetesimals, and dust production
The large number of debris disks known to surround stars much older than the T Tauri stars studied here suggests that planetesimal formation is efficient and common, even though the formation mechanism for such planetesimals remains uncertain (see Chiang Youdin, 2010 for a recent review). As the abundance of extrasolar giant planets known to date (Howard et al. 2012) further suggests that planetesimals must form within a Myr if core accretion is to operate within the disk gas dissipation timescale, the majority of the disks in our sample should have formed planetesimals. However, half of our targets show no excess at any wavelength. If their disks have formed planetesimals, what is limiting the debris detectability in these systems?
Models that attempt to fit the Spitzer excesses of nearby debris disks around older solar type stars can be extrapolated back to the 1-10 Myr ages of our sample for comparison with our results. For instance, Kains, Wyatt, Greaves (2011) assume a planetesimal disk in collisional equilibrium. Their model predicts Ldisk/L⋆ = 10-2 to 10-6 at an age of 1 Myr for initial solid masses 3-300 M⊕. Since the lower end of the predicted Ldisk/L⋆ distribution is below our sensitivity limits calculated in Section 4.1.6, we conclude that our Herschel observations are likely to miss many of the disks with lower initial solid masses and/or larger radii. Another possibility for the relatively low detection rate of debris disks is the existence of a quiescent phase between the dissipation of the primordial disk an the onset of the debris disk phenomenon. Models by Kenyon Bromley (2008) consider how planetesimals grow and obtain their eccentricities. In their models of planetesimals at 30–150 AU, eccentricities start out very small and reach 0.05 only at 100 Myr. As a result, significant dust production is delayed until 5-10 Myr and peaks around 10-50 Myr. We should also consider the possibility that the planetesimal disks in the systems without Herschel excesses have been removed as a consequence of giant planet formation. Raymond et al. (2012) explore the dynamical evolution of and dust production in disks that have formed multiple giant planets, planetesimals, and planetary embryos. They find that systems in which the giant planets undergo a strong dynamical instability can clear planetesimals from both the inner terrestrial planet region and the Kuiper Belt region of the disk, limiting future debris production. These systems end up with giant planets on eccentric orbits and are unlikely to have terrestrial planets. The data currently available does not distinguish between the three potential explanations for the non-detections discussed above.
4.2.5 Stellar mass, age, and multiplicity
Our small sample does not show statistically significant trends in the disk fractions or properties as a function of stellar mass, multiplicity, or membership in regions with different mean ages. The one exception is perhaps the low incidence of primordial disks among the oldest targets in our sample. Nine of our targets are in regions with estimated ages 5 Myr (TWA, Cha and Cha; Torres et al. 2008). Only one (11) of them, T Cha, harbors an accreting primordial disk. In contrast, we find 6 gas-rich primordial disks among the 22 targets (i.e., 27) from the younger 1–3 Myr regions (Ophiuchus, Lupus, and Taurus; Comeron 2008, Wilking et al. 2008, Kenyon et al. 2008). Nevertheless, these young regions also contain many debris disks and diskless stars. This is not surprising considering that disk evolution is a function of many variables besides age, including stellar mass, multiplicity, initial conditions, and environment (Williams Cieza, 2011). Disentangling the effects from each variable requires very large samples and/or further parametric constraints.
4.3 Outstanding questions
The IR SEDs of the WTTSs in our sample trace the late evolution of primordial disks and the transition to a debris disk or an apparently diskless stage. Our modeling work places constraints on the dust content and disk geometry of our targets. However, important disk evolution questions still remain unanswered. In particular, the gas content of our objects is very poorly established. The high-resolution data of the H line can unambiguously identify the presence of accretion and thus a gas-rich disk. Nevertheless, the lack of accretion signatures does not necessarily imply a gas-poor disk. Accretion rates are highly variable and can fall below detectable levels. Also, processes such as photoevaporation and the dynamical interaction of embedded objects can prevent accretion from a gas-rich disk. Furthermore, detecting accretion provides little to no information on the total amount of circumstellar gas present in the disk.
Establishing the evolution of the gas (and thereby of the gas to dust mass ratio) in protoplanetary disks is currently one of the biggest challenges in the field. The gas content is critical for the formation of not only giant planets, but also terrestrial planets because it controls the dynamics of dust grains, the building blocks of rocky objects. While most disk models assume a gas to dust mass ratio of 100 (the canonical value for the interstellar medium), it is clear that this is not a particularly safe assumption. On the one hand, gas photevaporation will tend to decrease the gas to dust mass ratio with time. On the other hand, this ratio should increase as grains grow into planetesimals and planets. At the end of the primordial disk dissipation process, many (or most) protoplanetary disks should evolve into dusty gas-poor debris disks, even if these tenuous disks are not bright enough to be detectable by current surveys (e.g., like the debris disk in our own solar system). However, the evolution of the gas to dust mass ratio could be complex rather than follow a monotonically decreasing function. Disks with gas to dust mass ratios significantly greater than 100 can thus not be ruled out (Pinte et al. 2010). To complicate things, the evolution of the gas to dust mass ratio is expected to be dependent on variables such as stellar mass and the planet formation history of any given system.
Obtaining reliable estimates for the gas content of protoplanetary disks will require observations of several gas tracers from different regions of the disk and detailed models of the disk structure. Spatially resolved observations of the continuum and multiple molecular species and isotopologues with ALMA will help tremendously in this area. Reliable estimates of the gas to dust mass ratios and disk structures of all our WTTS disks would result in a much clearer view of the disk evolution picture discussed in Section 4.2. In particular, they would help establish whether the optically thin disks in our sample are the remnants of primordial disks are true gas-poor debris disks where the opacity is dominated by second-generation dust produced by the collation of planetesimals.
5 Summary and conclusions
In this study, part of the DIGIT Herschel Key Program, we presented far-IR and submillimeter photometry of 31 WTTSs in order to investigate the properties and evolutionary status of their disks. We constructed preliminary disk models for all the objects with IR excesses. Our main conclusions can be summarized as follows:
1) WTTSs are a very diverse population in terms of SEDs. In our sample, 6 (2/31) of the targets exhibit IR excesses indistinguishable from those of CTTSs and are likely to be borderline objects moving back and forth across the observational boundary between CTTSs and WTTSs. 13 (4/31) of our WTTSs have SEDs consistent with evolved primordial disks, while 26 (8/31) of them seem to be in a debris disk stage. One target, T Cha, is a “pre-transition” disk with gap in the disk and intriguing outer disk properties. Half (16/31) of our targets lack detectable levels of near-, mid-, or far-IR excesses.
2) Objects without excess 24 m emission over that from the photosphere, but detectable Herschel excesses are rare, 11 (2/18) in our sample of objects without Spitzer excesses. This implies that the overall disk fraction of WTTSs is not much higher than 20, the value obtained by previous Spitzer surveys at 24 m. However, since our Herschel observations are not sensitive to the stellar photospheres of our targets, this conclusion is only valid for disks where / 5–15 and / 10-3–10-4.
3) Using the velocity dispersion of the H line, which is a more sensitive accretion indicator than H EWs, we find that all the 7 targets with optically thick disks are in fact weakly accreting objects (i.e., primordial disks). In contrast, none of the 8 optically thin disks show evidence for accretion, and are most likely to be debris disks. These results support the idea that the transition from the primordial to debris disk phase happens very quickly through photoevaporation. This transition occurs when most of the disk mass has been depleted and the accretion rate falls below the photovaporation rates, at which point the gaseous disk dissipates from the inside out, leaving behind large grains, planetesimals and/or planets.
4) T Cha has a relatively massive disk with a 15 AU wide gap separating optically thick inner and outer disk components. This object is an exception to the emerging picture in which most protoplanetary disks remain optically thick in the IR until the entire disk suddenly dissipates from the inside out through photoevaporation. Instead, the properties of T Cha are best explained by the formation of multiple planets massive enough to open wide, overlapping gaps in the disk.
5) Preliminary SED modeling of the optically thick disks in our sample shows significant evolution in disk properties with respect to typical CTTS disks, including reduced disk masses, evidence for extreme dust settling, and the presence of inner holes and gaps.
6) Preliminary SED modeling of the optically thin objects suggests that young debris disks around WTTSs tend to be warmer than older analogs seen in the field. This is consistent with “delayed stirring” models of the production of second-generation dust. However, two important caveats remain: WTTSs have not yet been observed in the far-IR to the same mass sensitivity limits as nearby MS stars and the debris disk /gas-poor status of young optically thin disks still needs be confirmed.
References
- Alcala et al. (1993) Alcala, J. M., Covino, E., Franchini, M., et al. 1993, A&A, 272, 225
- Alexander et al. (2006) Alexander, R. D., Clarke, C. J., & Pringle, J. E. 2006, MNRAS, 369, 229
- Andrews & Williams (2005) Andrews, S. M., & Williams, J. P. 2005, ApJ, 631, 1134
- Andrews & Williams (2007) Andrews, S. M., & Williams, J. P. 2007, ApJ, 671, 1800
- Andrews et al. (2010) Andrews, S. M., Wilner, D. J., Hughes, A. M., Qi, C., & Dullemond, C. P. 2010, ApJ, 723, 1241
- Andrews et al. (2011) Andrews, S. M., Wilner, D. J., Espaillat, C., et al. 2011, ApJ, 732, 42
- Barrado Y Navascués (2006) Barrado Y Navascués, D. 2006, A&A, 459, 511
- Bouvier & Appenzeller (1992) Bouvier, J., & Appenzeller, I. 1992, A&AS, 92, 481
- Bouvier et al. (2007) Bouvier, J., Alencar, S. H. P., Harries, T. J., Johns-Krull, C. M., & Romanova, M. M. 2007, Protostars and Planets V, 479
- Brown et al. (2007) Brown, J. M., Blake, G. A., Dullemond, C. P., et al. 2007, ApJ, 664, L107
- Bryden et al. (2006) Bryden, G., Beichman, C. A., Trilling, D. E., et al. 2006, ApJ, 636, 1098
- Carpenter et al. (2001) Carpenter, J. M., Hillenbrand, L. A., & Skrutskie, M. F. 2001, AJ, 121, 3160
- Cieza et al. (2007) Cieza, L. A, et al. 2007, ApJ, 667, 308
- Cieza et al. (2008) Cieza, L. A., Swift, J. J., Mathews, G. S., & Williams, J. P. 2008a, ApJ, 686, L115
- Cieza et al. (2008) Cieza, L. A., Cochran, W. D., & Augereau, J.-C. 2008b, ApJ, 679, 720
- Cieza et al. (2009) Cieza, L. A., Padgett, D. L., Allen, L. E., et al. 2009, ApJ, 696, L84
- Cieza et al. (2010) Cieza, L. A., et al. 2010, ApJ, 712, 925
- Cieza et al. (2011) Cieza, L. A., Olofsson, J., Harvey, P. M., et al. 2011, ApJ, 741, L25
- Cieza et al. (2012) Cieza, L. A., Schreiber, M. R., Romero, G. A., et al. 2012a, ApJ, 750, 157
- Cieza et al. (2012) Cieza, L. A., Mathews, G. S., Williams, J. P., et al. 2012, ApJ, 752, 75
- Comerón (2008) Comerón, F. 2008, Handbook of Star Forming Regions, Volume II, The Southern Sky, ed. B. Reipurth (San Francisco, CA: ASP), 295
- Correia et al. (2006) Correia, S., Zinnecker, H., Ratzka, T., & Sterzik, M. F. 2006, A&A, 459, 909
- Covino et al. (1997) Covino, E., Alcala, J. M., Allain, S., et al. 1997, A&A, 328, 187
- Dodson-Robinson & Salyk (2011) Dodson-Robinson, S. E., & Salyk, C. 2011, ApJ, 738, 131
- Dohnanyi (1969) Dohnanyi, J. S. 1969, J. Geophys. Res., 74, 2531
- Dole et al. (2004) Dole, H., Le Floc’h, E., Pérez-González, P. G., et al. 2004, ApJS, 154, 87
- Dorschner et al. (1995) Dorschner, J., Begemann, B., Henning, T., Jaeger, C., & Mutschke, H. 1995, A&A, 300, 503
- Draine (2003) Draine, B. T. 2003, ARA&A, 41, 241
- Dullemond & Dominik (2004) Dullemond, C. P., & Dominik, C. 2004, A&A, 421, 1075
- Dullemond & Dominik (2005) Dullemond, C. P., & Dominik, C. 2005, A&A, 434, 971
- Dunham & Vorobyov (2012) Dunham, M. M., & Vorobyov, E. I. 2012, ApJ, 747, 52
- Durisen et al. (2007) Durisen, R. H., Boss, A. P., Mayer, L., et al. 2007, Protostars and Planets V, 607
- Eiroa et al. (2011) Eiroa, C., Marshall, J. P., Mora, A., et al. 2011, A&A, 536, L4
- Espaillat et al. (2007) Espaillat, C., Calvet, N., D’Alessio, P., et al. 2007, ApJ, 670, L135
- Evans et al. (2003) Evans, N. J., II, Allen, L. E., Blake, G. A., et al. 2003, PASP, 115, 965
- Evans et al. (2007) Evans, N. J., & II, et al. 2007, Final Delivery of Data from the c2d Legacy Project: IRAC and MIPS, (Pasadena: SSC), avialable at http://irsa.ipac.caltech.edu/data/SPITZER/C2D/doc/c2ddeldocument.pdf
- Evans et al. (2009) Evans, N. J., II, Dunham, M. M., Jørgensen, J. K., et al. 2009, ApJS, 181, 321
- Evans et al. (2012) Evans, T. M., Ireland, M. J., Kraus, A. L., et al. 2012, ApJ, 744, 120
- Fiorucci & Munari (2003) Fiorucci, M., & Munari, U. 2003, A&A, 401, 781
- Flock et al. (2011) Flock, M., Dzyurkevich, N., Klahr, H., Turner, N. J., & Henning, T. 2011, ApJ, 735, 122
- Foreman-Mackey et al. (2012) Foreman-Mackey, D., Hogg, D. W., Lang, D., & Goodman, J. 2012, arXiv:1202.3665
- Furlan et al. (2006) Furlan, E., Hartmann, L., Calvet, N., et al. 2006, ApJS, 165, 568
- Gorti et al. (2009) Gorti, U., Dullemond, C. P., & Hollenbach, D. 2009, ApJ, 705, 1237
- Griffin et al. (2010) Griffin, M. J., Abergel, A., Abreu, A., et al. 2010, A&A, 518, L3
- Hartigan et al. (1994) Hartigan, P., Strom, K. M., & Strom, S. E. 1994, ApJ, 427, 961
- Hartigan et al. (1995) Hartigan, P., Edwards, S., & Ghandour, L. 1995, ApJ, 452, 736
- Hartmann et al. (1998) Hartmann, L., Calvet, N., Gullbring, E., & D’Alessio, P. 1998, ApJ, 495, 385
- Harvey et al. (2012) Harvey, P. M., Henning, T., Ménard, F., et al. 2012a, ApJ, 744, L1
- Harvey et al. (2012) Harvey, P. M., Henning, T., Liu, Y., et al. 2012b, ApJ, 755, 67
- Hauschildt et al. (1999) Hauschildt, P. H., Allard, F., & Baron, E. 1999, ApJ, 512, 377
- Herbig & Bell (1988) Herbig, G. H., & Bell, K. R. 1988, Third catalog of emission-line stars of the Orion population., by G.H. gerbig and K.R. Bell. Lick Observatory Bulletin #1111, Santa Cruz: Lick Observatory, Jun 1988, 90 p.
- Herbst et al. (1982) Herbst, W., Holtzman, J. A., & Phelps, B. E. 1982, AJ, 87, 1710
- Howard et al. (2012) Howard, A. W., Marcy, G. W., Bryson, S. T., et al. 2012, ApJS, 201, 15
- Hughes et al. (1994) Hughes, J., Hartigan, P., Krautter, J., & Kelemen, J. 1994, AJ, 108, 1071
- Huélamo et al. (2011) Huélamo, N., Lacour, S., Tuthill, P., et al. 2011, A&A, 528, L7
- Jayawardhana et al. (2003) Jayawardhana, R., Mohanty, S., & Basri, G. 2003, ApJ, 592, 282
- Jayawardhana et al. (2006) Jayawardhana, R., Coffey, J., Scholz, A., Brandeker, A., & van Kerkwijk, M. H. 2006, ApJ, 648, 1206
- Jensen et al. (2009) Jensen, E. L. N., Cohen, D. H., & Gagné, M. 2009, ApJ, 703, 252
- Kains et al. (2011) Kains, N., Wyatt, M. C., & Greaves, J. S. 2011, MNRAS, 414, 2486
- Kenyon & Hartmann (1995) Kenyon, S. J., & Hartmann, L. 1995, ApJS, 101, 117
- Kenyon & Bromley (2005) Kenyon, S. J., & Bromley, B. C. 2005, AJ, 130, 269
- Kenyon & Bromley (2008) Kenyon, S. J., & Bromley, B. C. 2008, ApJS, 179, 451
- Kenyon et al. (2008) Kenyon, S. J., Gómez, M., & Whitney, B. A. 2008, Handbook of Star Forming Regions, Volume I, The Northern Sky, ed. B. Reipurth (San Francisco, CA: ASP), 405
- Köhler & Petr-Gotzens (2002) Köhler, R., & Petr-Gotzens, M. G. 2002, AJ, 124, 2899
- Kraus et al. (2011) Kraus, A. L., Ireland, M. J., Martinache, F., & Hillenbrand, L. A. 2011, ApJ, 731, 8
- Kraus et al. (2012) Kraus, A. L., Ireland, M. J., Hillenbrand, L. A., & Martinache, F. 2012, ApJ, 745, 19
- Krautter et al. (1997) Krautter, J., Wichmann, R., Schmitt, J. H. M. M., et al. 1997, A&AS, 123, 329
- Krivov (2010) Krivov, A. V. 2010, Research in Astronomy and Astrophysics, 10, 383
- Lee et al. (2011) Lee, N., Williams, J. P., & Cieza, L. A. 2011, ApJ, 736, 135
- Leinert et al. (1993) Leinert, C., Zinnecker, H., Weitzel, N., et al. 1993, A&A, 278, 129
- Lissauer & Stevenson (2007) Lissauer, J. J., & Stevenson, D. J. 2007, Protostars and Planets V, 591
- Loinard et al. (2008) Loinard, L., Torres, R. M., Mioduszewski, A. J., & Rodríguez, L. F. 2008, ApJ, 675, L29
- Lommen et al. (2007) Lommen, D., Wright, C. M., Maddison, S. T., et al. 2007, A&A, 462, 211
- Low et al. (2005) Low, F. J., Smith, P. S., Werner, M., et al. 2005, ApJ, 631, 1170
- Martin et al. (1998) Martin, E. L., Montmerle, T., Gregorio-Hetem, J., & Casanova, S. 1998, MNRAS, 300, 733
- Martín & Magazzù (1999) Martín, E. L., & Magazzù, A. 1999, A&A, 342, 173
- Mathews et al. (2012) Mathews, G. S., Williams, J. P., & Ménard, F. 2012, ApJ, 753, 59
- Matthews et al. (2007) Matthews, B. C., Kalas, P. G., & Wyatt, M. C. 2007, ApJ, 663, 1103
- Melo (2003) Melo, C. H. F. 2003, A&A, 410, 269
- Min et al. (2005) Min, M., Hovenier, J. W., & de Koter, A. 2005, A&A, 432, 909
- Murphy et al. (2011) Murphy, S. J., Lawson, W. A., Bessell, M. S., & Bayliss, D. D. R. 2011, MNRAS, 411, L51
- Natta et al. (2004) Natta, A., Testi, L., Muzerolle, J., Randich, S., Comerón, F., & Persi, P. 2004, A&A, 424, 603
- Nguyen et al. (2012) Nguyen, D. C., Brandeker, A., van Kerkwijk, M. H., & Jayawardhana, R. 2012, ApJ, 745, 119
- Norton et al. (2007) Norton, A. J., Wheatley, P. J., West, R. G., et al. 2007, A&A, 467, 785
- Nuernberger et al. (1997) Nuernberger, D., Chini, R., & Zinnecker, H. 1997, A&A, 324, 1036
- Olofsson et al. (2011) Olofsson, J., Benisty, M., Augereau, J.-C., et al. 2011, A&A, 528, L6
- Olofsson et al. (2012) Olofsson, J., Juhász, A., Henning, T., et al. 2012, A&A, 542, A90
- Ott (2010) Ott, S. 2010, Astronomical Data Analysis Software and Systems XIX, 434, 139
- Owen et al. (2011) Owen, J. E., Ercolano, B., & Clarke, C. J. 2011, MNRAS, 412, 13
- Padgett et al. (2006) Padgett, D. L., Cieza, L., Stapelfeldt, K. R., et al. 2006, ApJ, 645, 128
- Padgett et al. (2008) Padgett, D., et al., 2008, Taurus Legacy Delivery Document, available at http://irsa.ipac.caltech.edu/data/SPITZER/Taurus/docs/deliverydoc2.pdf
- Pilbratt et al. (2010) Pilbratt, G. L., Riedinger, J. R., Passvogel, T., et al. 2010, A&A, 518, L1
- Pinte et al. (2008) Pinte, C., Padgett, D. L., Ménard, F., et al. 2008, A&A, 489, 633
- Pinte et al. (2009) Pinte, C., Harries, T. J., Min, M., et al. 2009, A&A, 498, 967
- Pinte et al. (2010) Pinte, C., Woitke, P., Ménard, F., et al. 2010, A&A, 518, L126
- Poglitsch et al. (2010) Poglitsch, A., Waelkens, C., Geis, N., et al. 2010, A&A, 518, L2
- Prato (2007) Prato, L. 2007, ApJ, 657, 338
- Ratzka et al. (2005) Ratzka, T., Köhler, R., & Leinert, C. 2005, A&A, 437, 611
- Raymond et al. (2011) Raymond, S. N., Armitage, P. J., Moro-Martín, A., et al. 2011, A&A, 530, A62
- Reid (2003) Reid, N. 2003, MNRAS, 342, 837
- Rodmann et al. (2006) Rodmann, J., Henning, T., Chandler, C. J., Mundy, L. G., & Wilner, D. J. 2006, A&A, 446, 211
- Schechter et al. (1993) Schechter, P. L., Mateo, M., & Saha, A. 1993, PASP, 105, 1342
- Schisano et al. (2009) Schisano, E., Covino, E., Alcalá, J. M., et al. 2009, A&A, 501, 1013
- Sicilia-Aguilar et al. (2009) Sicilia-Aguilar, A., Bouwman, J., Juhász, A., et al. 2009, ApJ, 701, 1188
- Strom et al. (1989) Strom, K. M., Strom, S. E., Edwards, S., Cabrit, S., & Skrutskie, M. F. 1989, AJ, 97, 1451
- Torres et al. (2006) Torres, C. A. O., Quast, G. R., da Silva, L., et al. 2006, A&A, 460, 695
- Torres et al. (2008) Torres, C. A. O., Quast, G. R., Melo, C. H. F., & Sterzik, M. F. 2008, Handbook of Star Forming Regions, Volume II, The Southern Sky, ed. B. Reipurth (San Francisco, CA: ASP), 757
- Trilling et al. (2008) Trilling, D. E., Bryden, G., Beichman, C. A., et al. 2008, ApJ, 674, 1086
- Wahhaj et al. (2010) Wahhaj, Z., Cieza, L., Koerner, D. W., et al. 2010, ApJ, 724, 835
- White & Basri (2003) White, R. J., & Basri, G. 2003, ApJ, 582, 1109
- Wichmann et al. (1996) Wichmann, R., Krautter, J., Schmitt, J. H. M. M., et al. 1996, A&A, 312, 439
- Wichmann et al. (1997) Wichmann, R., Krautter, J., Covino, E., et al. 1997, A&A, 320, 185
- Wilking et al. (1987) Wilking, B. A., Schwartz, R. D., & Blackwell, J. H. 1987, AJ, 94, 106
- Wilking et al. (2008) Wilking, B. A., Gagné, M., & Allen, L. E. 2008, Handbook of Star Forming Regions, Volume II, The Southern Sky, ed. B. Reipurth (San Francisco, CA: ASP), 351
- Williams & Cieza (2011) Williams, J. P., & Cieza, L. A. 2011, ARA&A, 49, 67
- Zhu et al. (2011) Zhu, Z., Nelson, R. P., Hartmann, L., Espaillat, C., & Calvet, N. 2011, ApJ, 729, 47
| ID | RA | DEC | Region | Dist | Ref11 References for distances are: 1 = Kenyon, Gomes & Whitney, 2008; 2 = Torres et al. 2008; 3 = Comeron 2008; 4 = Wilking, Gagne, & Allen, 2008. | SpT | H EW | Ref22 References for spectral types and H EW are: B92 = Bouvier Appenzeller, 1992; H88 = Herbig Bell, 1988; H94 = Hughes et al. 1994; K97 = Krautter et al. 1997; M99 = Martin Magazzu, 1999; M98 = Martin et al. 1998; R03 = Reid et al. 2003; S09 = Sicilia-Aguilar et al. 2009; SH9 = Schisano et al. 2009; T06 = Torres et al. 2006; W10 = Wahhaj etl at. 2010. | V H | Ref33 References for H velocity widths are: C12 =Cieza et al. 2012; J06 =Jayawardhana et al. 2006; J09 =Jensen et al. 2009; N12= Nguyen et al. 2012; SH9 = Schisano et al. 2009; TW = this work; W10= Wahhaj etl at. 2010. | Bin. sep.44Binary separation, SB = spectroscopic binary, no VB = no visual binary within survey limits; no SB = no spectroscopic binary within survey limits; PP = possible planet embedded in the disk. | Ref55 References for binarity are: C06 = Correia et al. (2006); E12 = Evans et al. (2012); J06 = Jayawardhana et al. (2006) K02 = Köhler & Petr-Gotzens (2002); K11 = Kraus et al. (2011); L93 = Leinert et al. (1993); L08 = Loinard et al. (2008); M03 = Melo et al. (2003); H11 = Huélamo et al. (2011); N12 = Nguyen et al. (2012); P07 = Prato (2007); R05 = Ratzka et al. (2005). |
|---|---|---|---|---|---|---|---|---|---|---|---|---|
| J2000.0 | (J2000.0) | (pc) | (Å) | (km/s) | (″) | |||||||
| V1096 Tau | 04h13m27.21s | +28d16m24.7s | Tau | 140 | 1 | M0 | 3.0 | H88 | 0.015 | K11 | ||
| Hubble 4 | 04h18m47.02s | +28d20m08.4s | Tau | 140 | 1 | K7 | 3.0 | H88 | 188 | N12 | 0.028 | K11 |
| V819 Tau | 04h19m26.27s | +28d26m14.2s | Tau | 140 | 1 | K7 | 1.7 | H88 | 180 | C12 | noVB/SB | L93,N12 |
| HD283572 | 04h21m58.86s | +28d18m06.5s | Tau | 140 | 1 | G2 | -0.63 | W10 | -187 | W10 | noVB/SB | L93,N12 |
| L1551-51 | 04h32m09.28s | +17d57m23.3s | Tau | 140 | 1 | K7 | 0.56 | W10 | 114 | W10 | noVB/SB | K11,N12 |
| V827 Tau | 04h32m14.56s | +18d20m15.0s | Tau | 140 | 1 | K7 | 1.8 | H88 | 168 | N12 | 0.093 | N12 |
| RXJ0432.8+1735 | 04h32m53.24s | +17d35m33.7s | Tau | 140 | 1 | M2 | 1.9 | M99 | 138 | W10 | noSB | N12 |
| V830 Tau | 04h33m10.04s | +24d33m43.3s | Tau | 140 | 1 | K7 | 3.0 | H88 | 121 | N12 | noVB/SB | K11,N12 |
| RECX 3 | 08h41m37.03s | -79d03m30.4s | Cha | 100 | 2 | M3 | 2.2 | S09 | 116 | J06 | noVB | K02 |
| RECX 4 | 08h42m23.77s | -79d04m03.0s | Cha | 100 | 2 | M1.5 | 2.3 | S09 | 147 | J06 | noVB | K02 |
| RECX 6 | 08h42m38.77s | -78d54m42.7s | Cha | 100 | 2 | M3 | 3.6 | S09 | 145 | J06 | noVB | K02 |
| RECX 10 | 08h44m31.90s | -78d46m31.1s | Cha | 100 | 2 | M0.5 | 1.0 | S09 | 103 | J06 | noVB | K02 |
| TWA 6 | 10h18m28.70s | -31d50m02.9s | TWA | 50 | 2 | M0 | 3.8 | T06 | noVB | E12 | ||
| TWA 7 | 10h42m30.11s | -33d40m16.2s | TWA | 50 | 2 | M2 | 4.9 | T06 | 109 | J06 | noVB | E12 |
| T Cha | 11h57m13.53s | -79d21m31.5s | Cha | 100 | 2 | G8 | 0.3-30 | SH9 | 450 | SH9 | PP | H11 |
| TWA 10 | 12h35m04.25s | -41d36m38.6s | TWA | 50 | 2 | M2 | 4.8 | T06 | 199 | J06 | noBV | E12 |
| TWA 17 | 13h20m45.39s | -46d11m37.7s | TWA | 50 | 2 | K5 | 2.5 | R03 | SB | J06 | ||
| Sz 67 | 15h40m38.27s | -34d21m36.4s | Lup I | 150 | 3 | M4 | 5.9 | H94 | ||||
| Sz 68 | 15h45m12.87s | -34d17m30.6s | Lup I | 150 | 3 | K2 | 2.8 | H94 | 410 | TW | 0.126 | C06 |
| RXJ1603.2-3239 | 16h03m11.82s | -32d39m20.2s | Lup I | 150 | 3 | K7 | 1.1 | K97 | 132 | W10 | ||
| Sz 96 | 16h08m12.64s | -39d08m33.3s | Lup III | 200 | 3 | M1.5 | 11 | H94 | 270 | TW | noSB | M03 |
| RXJ1622.6-2345 | 16h22m37.55s | -23d45m50.4s | Oph | 130 | 4 | M2.5 | 3.6 | M98 | 128 | W10 | noSB | P07 |
| RXJ1625.2-2455b | 16h25m14.69s | -24d56m07.1s | Oph | 130 | 4 | M0 | 2.9 | M98 | 206 | W10 | noSB | P07 |
| ROXs 3 | 16h25m49.64s | -24d51m31.9s | Oph | 130 | 4 | M0 | 2.8 | B92 | noVB | R05 | ||
| ROXR1 13 | 16h26m03.03s | -24d23m36.4s | Oph | 130 | 4 | K0 | 0.7 | M98 | 400 | J09 | 0.005 | L08 |
| RXJ1627.2-2410 | 16h27m11.90s | -24d10m31.1s | Oph | 130 | 4 | M0 | 4.5 | M98 | ||||
| ROXs 31 | 16h27m52.09s | -24d40m50.2s | Oph | 130 | 4 | K7 | 3.3 | B92 | 0.480 | R05 | ||
| RXJ1628.2-2405 | 16h28m16.74s | -24d05m14.2s | Oph | 130 | 4 | K5 | 3.3 | M98 | 470 | TW | noVB | R05 |
| ROXs 39 | 16h30m35.63s | -24d34m18.6s | Oph | 130 | 4 | K5 | 6.0 | B92 | noVB | R05 | ||
| ROXs 42C | 16h31m15.79s | -24d34m01.9s | Oph | 130 | 4 | K6 | 1.6 | B92 | 390 | TW | 0.277 | R05 |
| ROXs 47A | 16h32m11.80s | -24d40m21.8s | Oph | 130 | 4 | K5 | 9.2 | B92 | 430 | TW | 0.784 | R05 |
| ID | PACS OBs ID | PACS Duration | PACS Date | SPIRE OBs ID | SPIRE Duration | SPIRE Date |
|---|---|---|---|---|---|---|
| (sec) | (yyyy-mm-dd) | (sec) | (yyyy-mm-dd) | |||
| V1096 Tau | 1342204863, 1342204864 | 445, 220 | 2010-09-19 | 1342203620 | 445 | 2010-08-24 |
| Hubble 4 | 1342204865, 1342204866 | 445, 220 | 2010-09-19 | 1342203619 | 445 | 2010-08-24 |
| V819 Tau | 1342216038, 1342216039 | 445, 220 | 2011-03-14 | 1342202256 | 307 | 2010-08-08 |
| HD283572 | 1342204867, 1342204868 | 445, 445 | 2010-09-19 | 1342203618 | 445 | 2010-08-24 |
| L1551-51 | 1342228935 | 895 | 2011-09-19 | 1342203623 | 445 | 2010-08-24 |
| V827 Tau | 1342228926 | 895 | 2011-09-19 | 1342203622 | 445 | 2010-08-24 |
| RXJ0432.8+1735 | 1342215980 | 670 | 2011-03-13 | 1342203624 | 445 | 2010-08-24 |
| V830 Tau | 1342202314, 1342202315 | 445, 445 | 2010-08-09 | 1342203621 | 445 | 2010-08-24 |
| RECX 3 | 1342203296 | 670 | 2010-08-22 | 1342202213 | 445 | 2010-08-04 |
| RECX 4 | 1342202897 | 670 | 2010-08-12 | 1342203634 | 445 | 2010-08-24 |
| RECX 6 | 1342209064 | 895 | 2010-11-05 | 1342202214 | 445 | 2010-08-04 |
| RECX 10 | 1342209065 | 895 | 2010-11-05 | 1342203635 | 445 | 2010-08-24 |
| TWA 6 | 1342209479 | 895 | 2010-11-18 | 1342200127 | 445 | 2010-07-09 |
| TWA 7 | 1342212629 | 445 | 2011-01-14T | 1342200128 | 445 | 2010-07-09 |
| T Cha | 1342209063 | 670 | 2010-11-05 | 1342203636 | 721 | 2010-08-24 |
| TWA 10 | 1342202559 | 895 | 2010-08-10 | 1342202222 | 445 | 2010-08-05 |
| TWA 17 | 1342203105 | 895 | 2010-08-16 | 1342203563 | 445 | 2010-08-23 |
| Sz 67 | 1342204182, 1342204183 | 445, 445 | 2010-09-09 | 1342203565 | 445 | 2010-08-23 |
| Sz 68 | 1342202365, 1342202366 | 445, 445 | 2010-08-10 | 1342203566 | 307 | 2010-08-23 |
| RXJ1603.2-3239 | 1342204184 | 670 | 2010-09-09 | 1342203568 | 445 | 2010-08-23 |
| Sz 96 | 1342216049, 1342216050 | 220, 220 | 2011-03-14 | 1342203567 | 307 | 2010-08-23 |
| RXJ1622.6-2345 | 1342204193, 1342204194 | 445, 220 | 2010-09-09 | 1342203576 | 445 | 2010-08-23 |
| RXJ1625.2-2455b | 1342204185, 1342204186 | 445, 445 | 2010-09-09 | 1342203575 | 445 | 2010-08-23 |
| ROXs 3 | 1342215611, 1342215612 | 445, 445 | 2011-03-08 | 1342203574 | 445 | 2010-08-23 |
| ROXR1 13 | 1342216064, 1342216065 | 220, 220 | 2011-03-15 | 1342203074 | 307 | 2010-08-15 |
| RXJ1627.2-2410 | 1342204189, 1342204190 | 445, 220 | 2010-09-09 | 1342203090 | 445 | 2010-08-16 |
| ROXs 31 | 1342204187, 1342204188 | 445, 220 | 2010-09-09 | 1342203572 | 445 | 2010-08-23 |
| RXJ1628.2-2405 | 1342204280, 1342204281 | 445, 220 | 2010-09-10 | 1342203571 | 445 | 2010-08-23 |
| ROXs 39 | 1342215613, 1342215614 | 445, 445 | 2011-03-08 | 1342203073 | 445 | 2010-08-15 |
| ROXs 42C | 1342216062, 1342216063 | 220, 220 | 2011-03-15 | 1342203570 | 307 | 2010-08-23 |
| ROXs 47A | 1342216060, 1342216061 | 220, 220 | 2011-03-15 | 1342203569 | 445 | 2010-08-23 |
| ID | F70 | 70 | F160 | 160 | F250 | 250 | F350 | 350 | F500 | 500 |
|---|---|---|---|---|---|---|---|---|---|---|
| (mJy) | (mJy) | (mJy) | (mJy) | (mJy) | mJy | (mJy) | (mJy) | (mJy) | (mJy) | |
| V1096 Tau | 5.73e+00 | 5.33e+01 | 2.70e+02 | 5.10e+02 | 7.50e+02 | |||||
| Hubble 4 | 6.93e+00 | 8.72e+01 | 7.50e+02 | 1.05e+03 | 1.20e+03 | |||||
| V819 Tau | 1.54e+01 | 1.03e+00 | 2.19e+01 | 1.12e+02 | 1.80e+02 | 2.25e+02 | ||||
| HD283572 | 4.67e+00 | 1.29e+01 | 3.75e+01 | 5.25e+01 | 6.75e+01 | |||||
| L1551-51 | 2.29e+00 | 3.66e+00 | 3.00e+01 | 3.75e+01 | 5.25e+01 | |||||
| V827 Tau | 3.98e+00 | 4.55e+00 | 3.75e+01 | 6.00e+01 | 7.50e+01 | |||||
| RXJ0432.8+1735 | 1.20e+01 | 2.47e+00 | 1.42e+01 | 2.25e+01 | 2.25e+01 | 3.00e+01 | ||||
| V830 Tau | 1.79e+00 | 1.08e+01 | 7.50e+01 | 1.05e+02 | 1.20e+02 | |||||
| RECX 3 | 6.04e+00 | 1.29e+00 | 1.32e+01 | 1.80e+01 | 2.25e+01 | 3.00e+01 | ||||
| RECX 4 | 9.25e+00 | 1.32e+00 | 6.41e+00 | 2.25e+01 | 3.00e+01 | 3.00e+01 | ||||
| RECX 6 | 4.80e+00 | 1.65e+01 | 2.70e+01 | 2.70e+01 | 3.00e+01 | |||||
| RECX 10 | 2.98e+00 | 7.51e+00 | 2.25e+01 | 2.25e+01 | 2.70e+01 | |||||
| TWA 6 | 6.03e+00 | 7.67e+00 | 1.65e+01 | 1.80e+01 | 2.25e+01 | |||||
| TWA 7 | 6.88e+01 | 3.13e+00 | 4.98e+01 | 7.05e+00 | 2.75e+01 | 5.00e+00 | 2.40e+01 | 5.00e+00 | 3.00e+01 | |
| T Cha | 5.06e+03 | 2.37e+01 | 3.97e+03 | 1.90e+01 | 1.78e+03 | 2.00e+02 | 1.06e+03 | 1.20e+02 | 6.60e+02 | 7.00e+01 |
| TWA 10 | 3.81e+00 | 1.37e+01 | 2.70e+01 | 2.70e+01 | 2.25e+01 | |||||
| TWA 17 | 2.43e+00 | 9.41e+00 | 2.70e+01 | 3.00e+01 | 3.75e+01 | |||||
| Sz 67 | 4.10e+00 | 1.51e+01 | 2.70e+01 | 3.00e+01 | 3.00e+01 | |||||
| Sz 68 | 2.65e+03 | 5.08e+01 | 2.30e+03 | 6.00e+03 | 3.00e+03 | 3.00e+03 | ||||
| RXJ1603.2-3239 | 1.28e+01 | 1.08e+00 | 1.44e+01 | 2.25e+01 | 3.00e+01 | 3.00e+01 | ||||
| Sz 96 | 1.67e+02 | 2.02e+00 | 9.22e+01 | 1.64e+01 | 1.80e+02 | 3.00e+02 | 4.50e+02 | |||
| RXJ1622.6-2345 | 5.81e+00 | 2.47e+01 | 7.50e+01 | 7.50e+01 | 9.00e+01 | |||||
| RXJ1625.2-2455b | 2.04e+01 | 1.21e+00 | 8.84e+01 | 1.07e+01 | 9.00e+01 | 1.20e+02 | 1.35e+02 | |||
| ROXs 3 | 3.63e+00 | 3.98e+01 | 1.50e+02 | 1.50e+02 | 1.50e+02 | |||||
| ROXR1 13 | 2.15e+03 | 2.58e+02 | 2.31e+03 | 2.91e+02 | 1.50e+03 | 9.00e+02 | 1.00e+03 | |||
| RXJ1627.2-2410 | 7.79e+00 | 1.02e+02 | 1.50e+02 | 2.25e+02 | 2.25e+02 | |||||
| ROXs 31 | 1.57e+01 | 1.71e+00 | 1.15e+02 | 4.50e+02 | 5.25e+02 | 1.20e+03 | ||||
| RXJ1628.2-2405 | 1.03e+02 | 1.70e+00 | 1.59e+02 | 2.75e+01 | 3.00e+02 | 4.50e+02 | 4.50e+02 | |||
| ROXs 39 | 5.96e+00 | 2.05e+01 | 7.50e+01 | 9.00e+01 | 1.20e+02 | |||||
| ROXs 42C | 2.40e+02 | 3.00e+00 | 7.09e+01 | 9.70e+00 | 1.50e+02 | 1.95e+02 | 2.10e+02 | |||
| ROXs 47A | 4.63e+01 | 2.75e+00 | 1.48e+02 | 1.47e+01 | 2.40e+02 | 3.00e+02 | 3.60e+02 |
| ID | V | RC | IC | Ref11References for optical data are: A93= Alcala et al. 1993; B06 = Barrado Y Navascues, 2006; C07 = Cieza et al. 2007; K95 = Kenyon Hartmann, 1995; N07 = Norton et al. (2007); P06 = Padgett et al. 2006; S89 = Strom et al. 1989; S09 = Sicilia-Aguilar et al. 2009. | J | H | K | F3.6 | F4.5 | F5.8 | F8.0 | F24 | Ref22References for Spitzer data are: P08 = Padgett et al. (2008), (Taurus delivery document); S09 = Sicilia-Aguilar et al. 2009; B07 = Brown et al. 2007; E07 = Evans et al. 2007, (c2d Delivery document); L05 = Low et al. 2005. | Fmm | Ref33Teff,⋆ and L⋆ are fixed model parameters. They were derived from the spectral types (using the temperature scale given by Kenyon & Hartmann et al. 1995) and applying a bolometric correction (from Hartigan et al. 1994) to the extinction-corrected J-band fluxes. | |
|---|---|---|---|---|---|---|---|---|---|---|---|---|---|---|---|---|
| (mag) | (mag) | (mag) | (mag) | (mag) | (mag) | (mJy) | (mJy) | (mJy) | (mJy) | (mJy) | (mm) | (mJy) | ||||
| V1096 Tau | 12.69 | 11.90 | N07 | 8.83 | 7.79 | 7.46 | 380 | 242 | 168 | 101 | 11.8 | P08 | ||||
| Hubble 4 | 12.00 | 11.21 | N07 | 8.56 | 7.63 | 7.29 | 426 | 287 | 192 | 109 | P08 | 0.85 | 9.0 | A05 | ||
| V819 Tau | 13.20 | 12.20 | 11.11 | KH95 | 9.50 | 8.64 | 8.42 | 154 | 92.3 | 68.9 | 39.9 | 21.6 | P08 | 0.85 | 9.0 | A05 |
| HD283572 | 9.03 | 8.56 | 8.57 | KH95 | 7.41 | 7.00 | 6.86 | 535 | 338 | 229 | 127 | 14.1 | P08 | 0.85 | 9.0 | A05 |
| L1551-51 | 13.29 | 12.06 | 11.31 | S89 | 9.69 | 9.05 | 8.85 | 80.5 | 54.4 | 40.0 | 23.5 | 2.44 | E07 | 0.85 | 13 | A05 |
| V827 Tau | 12.27 | 11.39 | 11.28 | KH95 | 9.16 | 8.49 | 8.23 | 158 | 108 | 71.9 | 39.7 | 4.73 | L10 | 0.85 | 6.0 | A05 |
| RXJ0432.8+1735 | 13.66 | 12.60 | 11.32 | P06 | 10.00 | 9.23 | 9.02 | 80.5 | 45.0 | 35.4 | 22.4 | 16.9 | E07 | |||
| V830 Tau | 12.23 | 11.37 | 11.37 | KH95 | 9.32 | 8.61 | 8.42 | 94.4 | 73.4 | 53.0 | 32.4 | 3.66 | E07 | 0.85 | 6.0 | A05 |
| RECX 3 | 14.37 | 13.21 | 11.79 | S09 | 10.34 | 9.64 | 9.41 | 55.0 | 37.1 | 26.5 | 14.0 | 2.88 | S09 | |||
| RECX 4 | 12.73 | 11.80 | 10.81 | S09 | 9.53 | 8.77 | 8.61 | 117 | 74.8 | 51.5 | 28.7 | 5.80 | S09 | |||
| RECX 6 | 14.08 | 13.08 | 11.68 | S09 | 10.23 | 9.58 | 9.29 | 61.4 | 42.3 | 27.8 | 15.5 | 2.01 | S09 | |||
| RECX 10 | 12.53 | 11.67 | 10.75 | S09 | 9.65 | 8.92 | 8.73 | 103 | 64.6 | 43.7 | 25.7 | 2.98 | S09 | |||
| TWA 6 | 11.62 | 9.94 | B06 | 8.86 | 8.18 | 8.04 | 5.7 | L05 | ||||||||
| TWA 7 | 11.65 | 9.21 | B06 | 7.79 | 7.12 | 6.89 | 30.2 | L05 | 0.85 | 9.7 | M07 | |||||
| T Cha | 11.87 | 11.02 | 10.16 | A93 | 8.95 | 7.86 | 6.95 | 1490 | 1320 | 1070 | 666 | B07 | 1.30 | 105 | L07 | |
| TWA 10 | 12.96 | 10.49 | B06 | 9.12 | 8.47 | 8.18 | 5.10 | L05 | ||||||||
| TWA 17 | 12.70 | 10.78 | B06 | 9.80 | 9.18 | 9.01 | 1.50 | L05 | ||||||||
| Sz 67 | 12.85 | 11.49 | C07 | 9.99 | 9.36 | 9.12 | 79.0 | 50.0 | 35.0 | 21.2 | 2.68 | E07 | 1.30 | 66 | N97 | |
| Sz 68 | 10.36 | 9.60 | 8.86 | C07 | 7.75 | 6.86 | 6.48 | 1580 | 1420 | 1690 | 2170 | 2860 | E07 | 1.30 | 73 | L07 |
| RXJ1603.2-3239 | 12.71 | 11.90 | 11.05 | P06 | 9.97 | 9.29 | 9.12 | 66.8 | 44.29 | 34.7 | 20.9 | 9.23 | E07 | |||
| Sz 96 | 13.91 | 13.02 | 11.84 | C07 | 10.12 | 9.34 | 8.95 | 168 | 113 | 138 | 173 | 241 | E07 | 1.30 | 13 | L07 |
| RXJ1622.6-2345 | 16.04 | 14.45 | 12.98 | C07 | 11.05 | 10.06 | 9.73 | 43.7 | 32.2 | 22.1 | 13.9 | 2.77 | E07 | 0.85 | 11 | C08 |
| RXJ1625.2-2455b | 14.41 | 13.05 | 11.75 | C07 | 9.58 | 8.58 | 8.26 | 171 | 112 | 81.0 | 48.9 | 5.29 | E07 | |||
| ROXs 3 | 13.10 | 12.10 | 11.13 | C07 | 9.77 | 9.04 | 8.78 | 62.5 | 26.2 | 3.07 | E07 | 1.30 | 30 | A07 | ||
| ROXR1 13 | 14.01 | 12.38 | 10.80 | C07 | 8.09 | 6.86 | 6.22 | 1260 | 878 | 743 | 689 | 1810 | E07 | 0.85 | 18 | C08 |
| RXJ1627.2-2410 | 18.68 | 18.49 | 15.36 | C07 | 11.87 | 10.29 | 9.64 | 49.0 | 37.7 | 27.2 | 17.1 | 1.93 | E07 | |||
| ROXs 31 | 16.28 | 14.48 | 12.78 | C07 | 9.99 | 8.72 | 8.12 | 203 | 145 | 106 | 62.7 | 7.40 | E07 | 0.85 | 22 | A07 |
| RXJ1628.2-2405 | 10.98 | 9.57 | 8.86 | 134 | 129 | 109 | 90.1 | 93.4 | E07 | 0.85 | 15 | C08 | ||||
| ROXs 39 | 12.90 | 11.85 | 10.76 | C07 | 9.09 | 8.28 | 8.02 | 197 | 138 | 98 | 57.7 | 6.34 | E07 | 1.30 | 30 | A07 |
| ROXs 42C | 12.05 | 11.06 | 10.13 | C07 | 8.35 | 7.51 | 7.12 | 575 | 428 | 371 | 397 | 862 | E07 | 0.85 | 13 | C08 |
| ROXs 47A | 13.65 | 12.43 | 11.15 | C07 | 9.24 | 8.35 | 7.92 | 265 | 212 | 152 | 122 | 105 | E07 | 1.30 | 6.6 | C08 |
| Parameter | Default value11The value is allowed to change, but only if needed to better fit the silicate feature. Similarly, Rout is allowed to change to a lower value, but only if the target is a close binary system. |
|---|---|
| Surface density exponent, | 1 |
| Inclination, [deg] | 60 |
| Grain size distribution slope, p | 3.5 |
| Min grain size, amin [m ] | 0.01 |
| Max grain size, amax [m] | 3900 |
| Settling exponent, | 0 |
| Outer radius, Rout [AU] | 100 |
| Object | Rin | H50 | Mdisk22Mdisk is not formally a free parameter, but is calculated by integrating over radius and assuming a gas to dust mass ratio of 100. For convenience, we report Mdisk instead of the corresponding free parameter . See Section 3.4.1 regarding important caveats on the Mdisk parameter. | Rout | Teff,⋆33Teff,⋆ and L⋆ are fixed model parameters. They were derived from the spectral types (using the temperature scale given by Kenyon & Hartmann et al. 1995) and applying a bolometric correction (from Hartigan et al. 1994) to the extinction-corrected J-band fluxes. | L⋆ | ||
|---|---|---|---|---|---|---|---|---|
| [AU] | [AU] | [MJUP] | [AU] | [K] | [L⊙] | |||
| Sz 68 | 0.8 | 3.0 | 1.18 | 4.0 | 0.1 | 15 | 4900 | 6.7 |
| Sz 96 | 0.1 | 6.0 | 1.07 | 0.9 | 0.2 | default | 3580 | 0.9 |
| RXJ1628.2-2405 | 0.8 | 0.17 | 1.15 | 710-2 | default | default | 4350 | 0.9 |
| ROXs 42C (inner disk) | 0.09 | 1.0 | 1 | 210-4 | default | 3 | 4200 | 2.7 |
| ROXs 42C (outer disk) | 3.0 | 4.5 | 1 | 810-3 | default | 30 | 4200 | 2.7 |
| ROXs 47A (inner disk) | 0.05 | 5 | 1.1 | 210-5 | default | 1.5 | 4350 | 1.4 |
| ROXs 47A (outer disk) | 1.5 | 5 | 1.1 | 210-3 | default | default | 4350 | 1.4 |
| ROXR1 13 |
| Star | Ldisk/L⋆11calculated by integrating the stellar photosphere and disk model over frequency | Teff,⋆22Teff,⋆ and L⋆ are fixed model parameters. They were derived from the spectral types (using the temperature scale given by Kenyon & Hartmann et al. 1995) and applying a bolometric correction (from Hartigan et al. 1994) to the extinction-corrected J-band fluxes. | L⋆ | |||
| AU | AU | [K] | [L⊙] | |||
| Warm debris disks | ||||||
| V819 Tau | 1.1 | 36 | 3.8 | 10-3.7 | 4060 | 0.9 |
| RXJ0432.8+1735 | 1.2 | 13 | 1.5 | 10-3.4 | 3580 | 0.4 |
| RECX 3 | 4.3 | 200 | 4.0 | 10-4.4 | 3470 | 0.13 |
| RECX 4 | 2.5 | 100 | 8.3 | 10-4.4 | 3720 | 0.3 |
| TWA7 | 3.3 | 423 | 1.6 | 10-4.3 | 3580 | 0.3 |
| RXJ1603.2-3239 | 13 | 15 | 3.5 | 10-4.0 | 4060 | 0.5 |
| Cold debris disks | ||||||
| RXJ1625.2-2455b33Even though this object was detected as a point source at both 70 and 160 m, its 160 m image shows significant extended emission north-west of the source (see Figure 2), which could be affecting our photometry. | 600 | 886 | 12 | 10-4.7 | 3850 | 0.9 |
| ROXs 31 | 40 | 357 | 3.2 | 10-4.3 | 4060 | 1.4 |
.
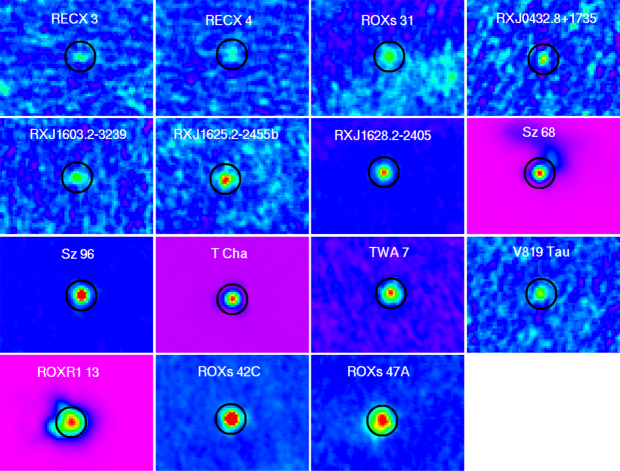
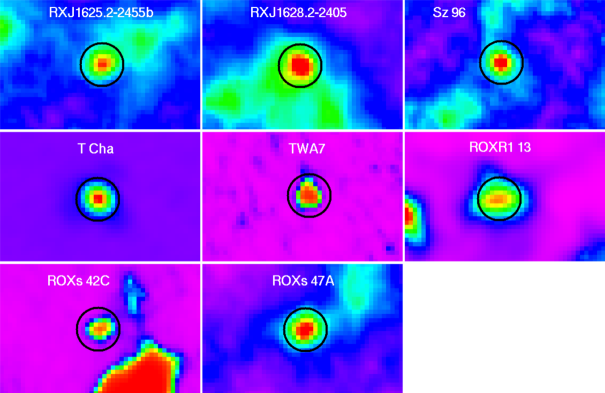
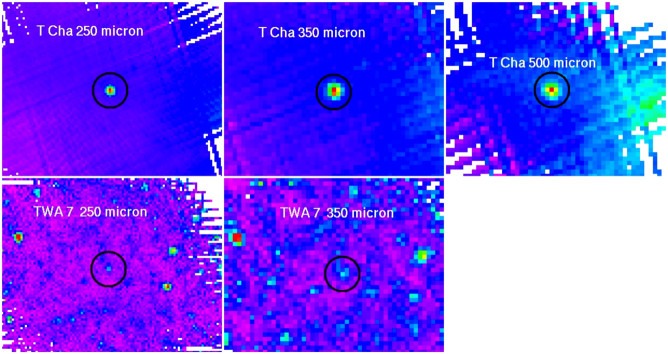

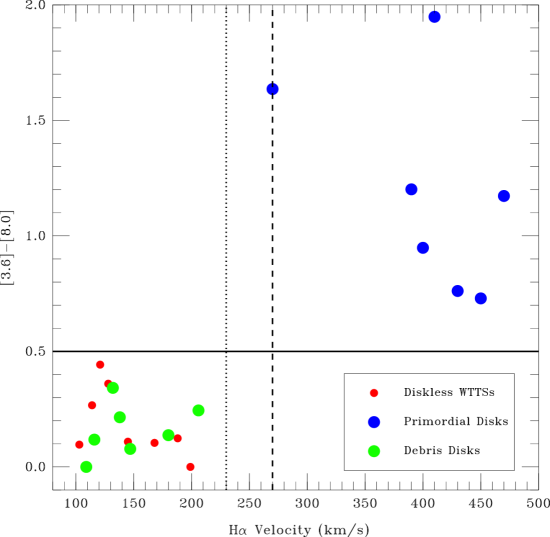
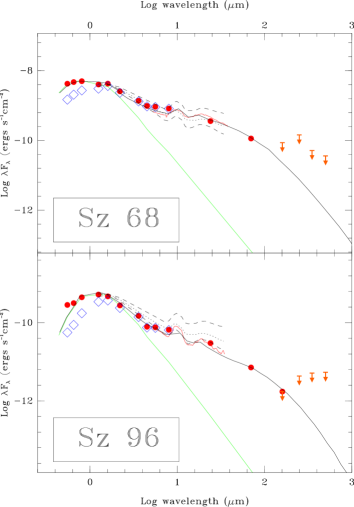
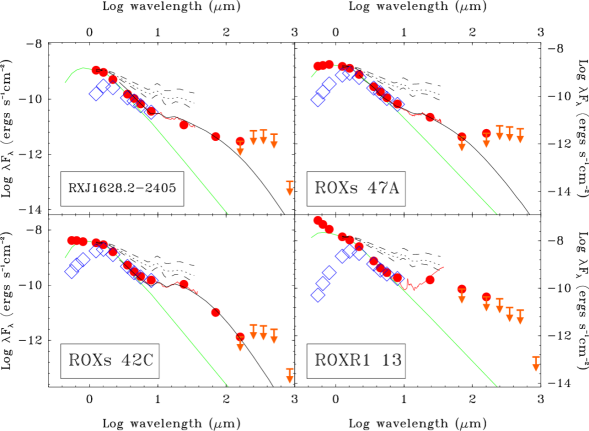
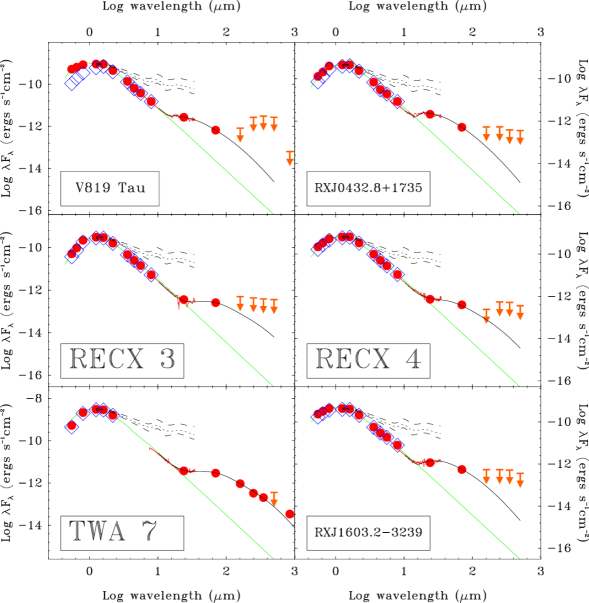
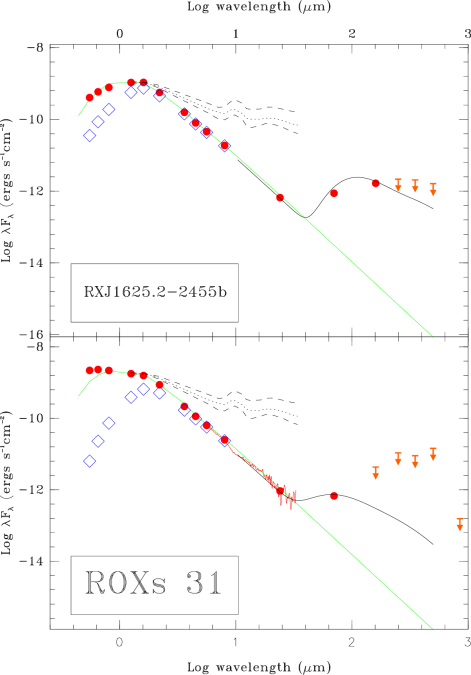
The solid black lines correspond to the models discussed in Section 4.1.4.