Variability of the Pulsed Radio Emission from the Large Magellanic Cloud Pulsar PSR J05296652
Abstract
We have studied the variability of PSR J05296652, a radio pulsar in the LMC, using observations conducted at 1390 MHz with the Parkes 64-m telescope. PSR J05296652 is detectable as a single pulse emitter, with amplitudes that classify the pulses as giant pulses. This makes PSR J05296652 the second known giant pulse emitter in the LMC, after PSR B054069. The fraction of the emitted pulses detectable from PSR J05296652 at this frequency is roughly two orders of magnitude greater than it is for either PSR B054069 or the Crab pulsar (if the latter were located in the LMC). We have measured a pulse nulling fraction of % and an intrinsic modulation index of for PSR J05296652. The modulation index is significantly larger than values previously measured for typical radio pulsars but is comparable to values reported for members of several other neutron star classes. The large modulation index, giant pulses, and large nulling fraction suggest that this pulsar is phenomenologically more similar to these other, more variable sources, despite having spin and physical characteristics that are typical of the unrecycled radio pulsar population. The large modulation index also does not appear to be consistent with the small value predicted for this pulsar by a model of polar cap emission outlined by Gil & Sendyk (2000). This conclusion depends to some extent on the assumption that PSR J05296652 is exhibiting core emission, as suggested by its simple profile morphology, narrow profile width, and previously measured profile polarization characteristics.
1 Introduction
From the time of their discovery more than 40 years ago, the detailed mechanism by which pulsars generate radio emission has remained elusive. Models have been proposed over that time to explain pulsar emission, and in principle these models can be tested with pulsar observations. One relatively recent emission model, proposed by Gil & Sendyk (2000), is an extension of the polar cap spark model of Ruderman & Sutherland (1975) in which bursts of plasma (“sparks”) are produced at the polar cap. In this model, instabilities in the plasma traveling along the magnetic field lines induce radio emission. The model postulates a densely packed region of these sparks, with a characteristic size and separation . One can determine a characteristic number of sparks (in one dimension) across the polar cap according to
| (1) |
where is the polar cap radius. In the Gil & Sendyk (2000) model, is a “complexity parameter” that can also be determined observationally by
| (2) |
where and are the pulsar’s spin period and period derivative, respectively. There are several other similar models having different scalings to determine the complexity parameter (see, e.g., Burke-Spolaor et al. (2012) for a brief summary and references to these models). Jenet & Gil (2003) provide details on how such models might be tested by comparing a pulsar’s observed intensity modulation with the variability predicted by the complexity parameter in the model. Although the Gil & Sendyk (2000) model does not make a distinction between core and conal emission from the pulsar (Rankin, 1983), a model test is most useful using pulsars with core emission, since observationally it is the most straightforward probe of the polar cap region, it is not affected by viewing geometry effects from an off-center cut through the emission region, and it is less likely to exhibit cone-based pulse drifting effects which would increase the observed modulation (Weltevrede et al., 2006a).
One measure of a pulsar’s intensity variability that can be employed in such tests is the phase-resolved modulation index, . Here is the longitude of the pulse phase, and is the ratio of the standard deviation of the observed pulse intensities to the mean pulse intensity averaged over many adjacent pulses, (Jenet & Gil, 2003; Weltevrede et al., 2006a):
| (3) |
As outlined in Jenet & Gil (2003), one would expect an anti-correlation between and owing to the likelihood that overlapping sparks in a complex emission region (large ) would wash out and tend to reduce the degree of modulation, creating more steady emission (smaller ). The phase information is important to retain since the measured modulation index near the edges of a profile peak usually increases relative to the center, in some cases because conal emission may be present. The center of the peak of the pulse profile therefore offers the best measurement of the properties of the core emission. The largest signal is also present at the profile peak, so the most precise constraint on can generally be made at that pulse phase.
The modulation index has previously been measured for a number of radio pulsars. Weltevrede et al. (2006a) observed 187 pulsars at 1400 MHz to investigate the modulation and sub-pulse drifting properties of the sample, and they produced modulation index measurements for 175 of them. More recently, Burke-Spolaor et al. (2012) reported measurements for a sample of 103 pulsars from the HTRU 1400-MHz survey (Keith et al., 2010). Jenet & Gil (2003) analyzed 2 pulsars observed near 1400 MHz and re-analyzed another 10 that were previously observed at 430 MHz (Jenet et al., 2001; Weisberg et al., 1986). The Jenet & Gil (2003) sample includes a subset of 28 pulsars analyzed by Weisberg et al. (1986) at 430 MHz. Jenet & Gil (2004) also measured for PSR B1937+21 at 1400 MHz. Other measurements of (but not phase resolved) were reported in Table 4 of Weltevrede et al. (2011) for members of several neutron star classes having different types of emission. These objects were the Crab pulsar – a classical giant pulse emitter (Staelin & Reifenstein, 1968; Argyle & Gower, 1972), the radio-emitting magnetar XTE J1810197 (Camilo et al., 2006), the rotating radio transient (RRAT) J18191458 (McLaughlin et al., 2006), and the possible RRAT-link pulsar PSR B0656+14 (Weltevrede et al., 2006b). The modulation indices reported for three of these four sources were for frequencies near 1400 MHz; PSR B0656+14 was measured at 327 MHz.
Generally, is observed to be small, with typical values between about 0.5 and 1 (Weltevrede et al., 2006a, 2011; Burke-Spolaor et al., 2012). The histogram of measured modulation indices shown in Fig. 8 of Weltevrede et al. (2006a) shows no measured with a value above 2, and only two of the 103 measurements of Burke-Spolaor et al. (2012) have . As seen in Fig. 1 of Jenet & Gil (2003) and Fig. 10 of Weltevrede et al. (2006a), the anti-correlation between and in the observed sample of pulsars is weak. This is also seen in the Burke-Spolaor et al. (2012) sample. One reason may be the inclusion of pulsars with conal emission in these larger samples; the modulation index and complexity parameter are not predicted to be as strongly correlated for conal emitters as they are for pulsars with core emission (Jenet & Gil, 2003; Burke-Spolaor et al., 2012). Another difficulty in establishing correlations is that the range of measured in the observed data set is small. One well-known exception to this is the Crab pulsar. The Crab’s modulation index is due to its well-studied giant pulses (Staelin & Reifenstein, 1968; Argyle & Gower, 1972; Lundgren et al., 1995; Weltevrede et al., 2006a; Karuppusamy et al., 2010). However, this pulsar is somewhat atypical since it is young and very energetic and is also a well-known X-ray emitter. In addition, the Crab pulsar is difficult to classify as a core or conal emitter (Rankin, 1990). The Crab may have conal emission and other complicating geometric profile features that could produce a larger measured modulation index, making its use for a simple test of the Gil & Sendyk (2000) model difficult.
However, PSR J05296652 is one pulsar that could be used for a consistency check of the Gil & Sendyk (2000) model. This is a 976-ms pulsar that was first discovered in a 600 MHz pulsar survey of the Large Magellanic Cloud (LMC), and it was the first extragalactic pulsar discovered (McCulloch et al., 1983). After its discovery, the pulsar was studied at frequencies near 600 MHz by McConnell et al. (1991) and Costa et al. (1991), and timing results for the pulsar were subsequently published by Crawford et al. (2001).
PSR J05296652 was redetected as a known pulsar in a more recent 1400 MHz Parkes survey of the Magellanic Clouds (MCs) for pulsars (Crawford et al., 2001; Manchester et al., 2006). In these redetections, it was evident that the pulsar was variable on a time-scale of minutes or less and showed possible nulling behavior, unlike any of the other MC radio pulsars detected. PSR J05296652 also had clearly detectable single radio pulses in these observations, making this pulsar phenomenologically unlike every other extragalactic radio pulsar yet discovered.111The LMC pulsar PSR B054069 also has detectable single radio pulses (Johnston & Romani, 2003), but it is not detectable as a periodic source at 1400 MHz. It is also a young, rapidly rotating X-ray emitter (Seward et al., 1984), making it different from PSR J05296652 in this respect as well. PSR J05296652 is very luminous at 1400 MHz, ranking in the top 2% of the known radio pulsar population in the ATNF pulsar catalog (Manchester et al., 2005). However, apart from its luminosity and apparent nulling behavior, the pulsar is unremarkable, with a period and period derivative that are typical of the unrecycled radio pulsar population.
Previous measurements of PSR J05296652 taken with Parkes at 600 MHz by Costa et al. (1991) showed that the pulsar has a simple, single-peaked morphology, with little pulse broadening. The width of the measured profile is % of the period at 600 MHz (Costa et al., 1991). The integrated pulse profile of PSR J05296652 at 1400 MHz is also single-peaked and uncomplicated (see our analysis below), and its width at both frequencies is consistent with the empirical relation for the pulse width at 1 GHz of presented by Rankin (1990) for core emitters, if a reasonable magnetic inclination angle is assumed (). These features are consistent with a core emission interpretation for PSR J05296652. A polarization profile at 600 MHz from Costa et al. (1991) shows significant linear polarization (%), with weaker circular polarization that changes sign symmetrically near the profile peak. This sign reversal also supports the interpretation of PSR J05296652 as a single core emitter (Rankin, 1990). In addition, the majority of known pulsars (%; Rankin 1990) that have been classified have core components. On this basis, we conclude that PSR J05296652 is likely to be exhibiting core emission, making it useful for a test of the Gil & Sendyk (2000) model.
2 Observations and Analysis
In order to investigate the pulse variability characteristics of PSR J05296652, we observed the pulsar with the Parkes 64-m radio telescope in two separate observations of length 5.0 and 3.8 hr in Feb 2008. Both observations were conducted at a center frequency of 1390 MHz using the center beam of the multibeam receiver and analog filterbank system (Staveley-Smith et al., 1996; Manchester et al., 2001). A bandwidth of 256 MHz was split into MHz channels, and each channel was 1-bit digitized and sampled every 500 s (see Table 1). The observing setup was identical to the one used in a radio pulsar search of the X-ray binary XTE J0103728 in the Small Magellanic Cloud (Crawford et al., 2009), which was part of the same observing campaign. Radio frequency interference (RFI) can be a significant problem at 1400 MHz at Parkes, and much of the data for PSR J05296652 was at least partially corrupted by RFI. We selected a portion of the first observation that was clean of RFI for the analysis. This subset consisted of 4195.5 seconds of integration, corresponding to 4299 complete pulses.
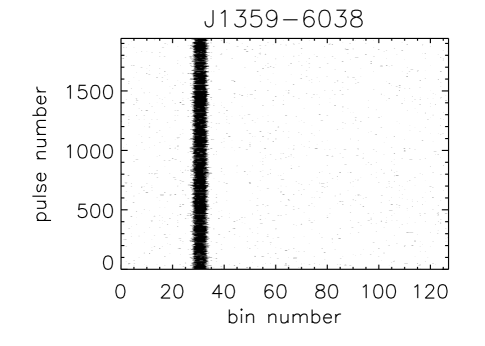
We performed the following operations on PSR J05296652 as well as on three bright test pulsars, PSRs J04374715, J05367543, and J13596038, in order to test our processing algorithms.222All three test pulsars were observed with the same Parkes observing system as PSR J05296652 (but at different epochs). In the case of PSR J13596038, a slightly different center frequency (1374 MHz) and filterbank system (consisting of MHz channels) were used (Manchester et al., 2001) (see Table 1). We dedispersed the raw channelized data for each pulsar using the catalog dispersion measure (DM) from the ATNF pulsar catalog (Manchester et al., 2005)333http://www.atnf.csiro.au/research/pulsar/psrcat/ to produce a dedispersed time series. We then created a pulse stack (e.g., Weltevrede et al. 2006a; Burke-Spolaor et al. 2012) by folding the dedispersed time series modulo the topocentric pulse period and stacking the resulting consecutive pulses. This produced a two-dimensional array consisting of pulse number vs. pulse phase bin. In each case, 128 pulse phase bins were used for the pulse stack. We determined the mean pulse profile by summing the pulses in the pulse stack while preserving pulse phase. All elements in the pulse stack were then subsequently adjusted (normalized) so that the calculated mean intensity had zero mean for the off-pulse bins and unity peak value. The mean intensity and mean intensity squared were then recomputed for each bin using this normalized pulse stack. Fig. 1 shows the normalized pulse stack for J05296652 and the three test pulsars for comparison, and Fig. 2 shows the mean intensity profile for PSR J05296652. As is the case at 600 MHz, the mean pulse profile for PSR J05296652 at 1390 MHz has a simple morphology and narrow width, with a duty cycle of 3-4 bins (corresponding to ms, or % of the pulse period). This similarity to the width measured by Costa et al. (1991) at 600 MHz indicates that the pulse does not experience significant broadening at lower frequencies and remains narrow across a range of frequencies. The phase-resolved modulation index was measured for each profile phase bin using the normalized pulse stack according to Eq. 3. An uncertainty in each modulation index value was computed using the rms values of the intensity and intensity squared within each bin and the number of points that were summed within each bin. The modulation index values were corrected to account for contributions from the interstellar medium (ISM) (this is discussed in Section 3.2), and the resulting phase-resolved modulation index for PSR J05296652 is plotted and discussed later in the paper.
Nulling fractions (NFs) were also computed for PSR J05296652 and the three test pulsars using on and off-pulse intensity histograms that were created from the pulse stacks, as outlined by Wang et al. (2007). Prior to this, however, we tested our procedure by recomputing the NF for three known nulling pulsars measured at Parkes by Wang et al. (2007) at a center frequency of 1518 MHz. These pulsars were PSRs J10495833, J15025653, and J15255417 (see their Table 1). We compared our NF values as a check for consistency. Two of the archival Parkes observations that we used for this comparison were also taken at 1518 MHz, while the third (PSR J10495833) had a center frequency of 1318 MHz. The uncertainties in our measured NFs were estimated using , where is the number of subintegrations (pulses) used. This is a slightly more conservative estimate than that used by Wang et al. (2007), where the number of null subintegrations and total number of subintegrations were used in the expression . In all three test cases we obtained values that were consistent with the Wang et al. (2007) values considering our respective uncertainties and that different data sets were used. This NF comparison is presented in Table 2. As mentioned below, the NF measured for PSR J05296652 may be influenced by the much larger distance to the pulsar than to the test pulsars, possibly making many of the pulses from PSR J05296652 unseen.
3 Results and Discussion
3.1 Giant Pulses from PSR J05296652 and the Nulling Fraction
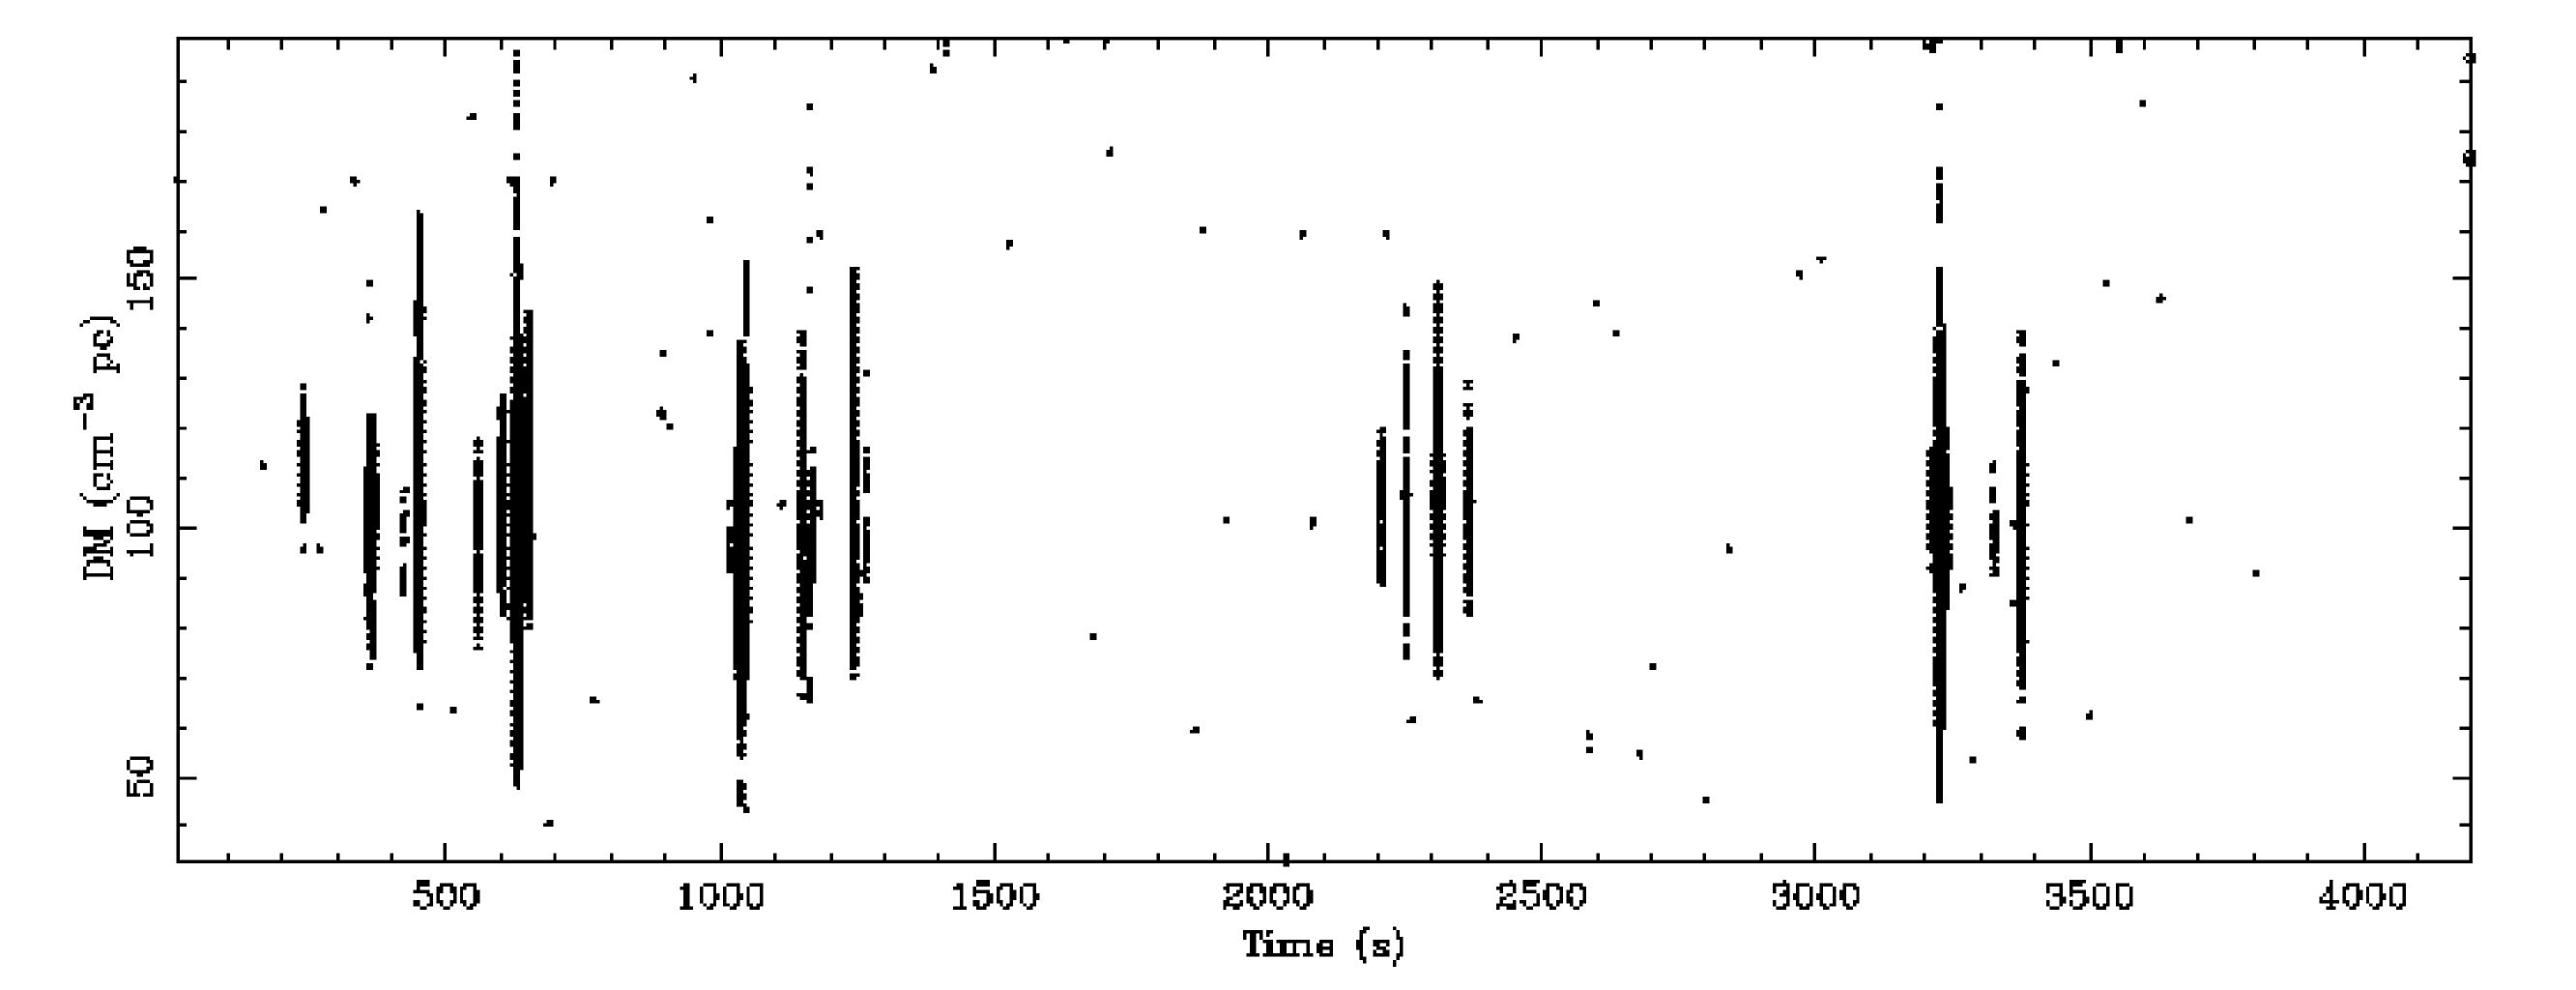
Individual pulses from PSR J05296652 were clearly detected in the 4195.5 s subset of the observation used in the analysis (Fig. 3). Three of these pulses, shown in the lower part of Fig. 3, were constructed using the dedispersed data. In these three plots, the intensity (shown on the vertical axis) was calculated by equating the rms of the dedispersed time series to the noise level as determined by the radiometer equation (see, e.g., Table 1 of Burke-Spolaor et al. 2011). The pulse flux density was calculated from the rms and the pulse signal-to-noise ratio (S/N), which ranged from 8 to 11 for these three pulses. The resulting flux densities ranged from to 575 mJy at 1400 MHz. Using the definition of the pseudoluminosity (e.g., Lorimer & Kramer 2005), , and assuming a LMC distance of kpc (Koerwer, 2009), this corresponds to 1400 MHz peak luminosities of between 1050 and 1440 Jy kpc2. All three pulses have widths of ms, corresponding to about 40 time samples, which is comparable to the width of the integrated pulse profile shown in Fig. 2. This is much larger than either the dispersion smearing within the frequency channels ( ms) or the expected pulse scattering time ( ms) from Galactic plasma at 1400 MHz, as estimated from the NE2001 electron model (Cordes & Lazio, 2002). This indicates that the pulses are not giant micropulses or very narrow single pulses like those seen for the Crab and Vela pulsars and for PSR B1937+21 (Cognard et al., 1996; Johnston et al., 2001; Johnston & Romani, 2004). The three pulses shown also occur at the same pulse phase as the peak of the integrated profile.
A comparison of pulse intensities in the sample to the average pulse intensity indicates that some pulses have intensities times the average. This can be seen in Fig. 4, which shows the pulse intensity histogram. These pulses may be considered giant pulses, which are generally defined as having amplitudes times the average (Johnston et al., 2001; Knight, 2006; Karuppusamy et al., 2011). However, it is not clear from the small number of high-intensity pulses shown in the histogram in Fig. 4 whether the giant pulses follow a power-law distribution in intensity, as expected for classical giant pulses (e.g., Argyle & Gower 1972), or possibly a lognormal distribution, as in the case of PSR B0656+14 (Weltevrede et al. 2006b; see discussion below). A fit to the data is unable to distinguish between these two cases. Future observations should provide better statistics and should be able to resolve this question. There is also no evidence of any association with a high-energy emission mechanism for PSR J05296652, which is thought to be a feature of classical giant pulses (Johnston & Romani, 2004). We checked this with a high-resolution XMM-Newton map of the region (Filipović, priv. comm.; see also Bozzetto et al. 2012) and by folding Fermi Large Area Telescope (LAT) data using the pulsar’s ephemeris to look for gamma-ray pulsations. No emission was detected from the pulsar in either case.
Another test for the presence of giant pulses is an R-parameter, defined by Johnston et al. (2001) and described by Burke-Spolaor et al. (2012). A value is determined for each profile bin by taking the difference between the maximum value and the mean value of the samples for that bin, which is then divided by the rms of the values for that bin. A subsequent comparison of the R-value for each bin with the rms of the R-values for the off-pulse bins can be used as a threshold test for the presence of sparse modulated emission, such as giant pulses. Following Burke-Spolaor et al. (2012), we use a significance threshold defined as minus the off-pulse mean of the values, divided by the standard deviation of in the off-pulse window. If this quantity is greater than 4 for any phase bin, then giant pulses are considered to be present. For three of the four on-pulse bins for PSR J05296652, was larger than 6 and nowhere else in the profile was it above 4. This supports our conclusion that giant pulses from PSR J05296652 are present and that they do not significantly lead or trail the main pulse.
As seen in Fig. 3, there are at least 15 distinct pulses that are visible by eye that were also detected in the single pulse search detection algorithm (Cordes & McLaughlin, 2003). This corresponds to one detectable pulse every min on average, though it is evident that the pulses are not evenly spaced. For comparison, we consider two young, canonical giant radio pulse emitters: the Crab pulsar and PSR B054069. Crawford et al. (2005) used the same Parkes observing system as used here (but with a different sampling rate) to observe the X-ray pulsar PSR J05376910 in the LMC at 1400 MHz (Marshall et al., 1998). They calculated that if the Crab pulsar were located in the LMC, one pulse would be expected to be detectable with this system every min. In the case of PSR B054069, which is in the LMC, one giant pulse should be detectable every min.444This expected detection rate for PSR B054069 is somewhat larger than the actual detection of only one pulse in a recent 1.4 hr test observation that had comparable sensitivity. This observation was taken as part of new multibeam pulsar survey of the LMC with Parkes. Thus, the rate of detectable pulses per unit time from PSR J05296652 with this system is almost an order of magnitude greater than the expected rates for either the Crab pulsar (if it were in the LMC) or PSR B054069. Moreover, the spin period of PSR J05296652 (976 ms) is more than an order of magnitude larger than either the Crab pulsar (33 ms) or PSR B054069 (50 ms). Therefore, the likelihood that any one pulse from PSR J05296652 would be detectable as a giant pulse with this system (or, alternatively, the fraction of emitted pulses detectable as single pulses with this system) is about two orders of magnitude greater than for either the Crab (if it were in the LMC) or PSR B054069. Unlike these two pulsars, however, PSR J05296652 is physically unremarkable, making this feature of its emission quite unusual and unexpected.
The pulse characteristics from PSR J05296652 appear to be more similar to those from PSR B0656+14 (Weltevrede et al., 2006b; Tao et al., 2012). The pulses from PSR B0656+14 follow a lognormal distribution rather than a power-law (e.g., Fig. 1 of Weltevrede et al. (2006b), which might also be the case for PSR J05296652 (see Fig. 4), they are not associated with any high-energy emission, and they are not narrow micropulses. PSR B0656+14, like PSR J05296652, also does not have a large magnetic field at the light-cylinder radius, which is a feature of known classical giant pulse emitters (Cognard et al., 1996). These features make both PSR J05296652 and PSR B0656+14 different from classical giant pulse emitters. As discussed below, the large modulation indices measured for PSRs B0656+14 and J05296652 and the proximity of both pulsars to the bulk of the unrecycled pulsar population on the period/period derivative diagram also suggest a similarity between these two sources.
We measured NFs for PSR J05296652 and our three test pulsars. These values are presented in Table 1. Both PSRs J04374715 and J13596038 have essentially no nulling near 1400 MHz (NF ). The NF for PSR J05296652 at 1390 MHz is %, indicating that either radio emission is not present for the majority of the pulse periods or that most pulses are simply too weak to be distinguishable from noise. This latter point is an important possibility given the very large distance to PSR J05296652. In all four cases the measured NFs appear qualitatively consistent with the pulse stacks shown in Fig. 1.
3.2 The Modulation Index of PSR J05296652
For the modulation index calculation, we first estimated the contribution to the modulation from the Galactic ISM for each of the pulsars, and we corrected the measured modulation indices for this to obtain the value intrinsic to each pulsar. As outlined in Jenet & Gil (2003), the measured (), intrinsic (), and ISM-produced () modulation indices are related according to:
| (4) |
| (5) |
where is the observing bandwidth, is the characteristic ISM diffractive scintillation bandwidth, and is a coefficient ranging from 0.1 to 0.2 (Cordes et al., 1990). was determined at 1400 MHz for each pulsar using the NE2001 model of Cordes & Lazio (2002) and the pulsar’s catalog DM. For PSR J05296652, we used the maximum Galactic DM contribution along its line of sight according to the NE2001 model (52 pc cm-3). The uncertainty in was calculated using a range of of 0.1 to 0.2. Following the method of Jenet & Gil (2003), the uncertainty in the intrinsic modulation index was determined by using the larger of the measurement uncertainties in and . The results are presented in Table 1.
It should be noted that in the case of PSR J05296652, does not include any contribution from propagation through the LMC, where the pulsar resides. There is no model that we can use to estimate the LMC contribution to the modulation, but observations of other known pulsars in the MCs do not show any of the extreme variability and null-like behavior that is seen for PSR J05296652 (Crawford et al., 2001; Manchester et al., 2006). We conclude from this that the contribution to the modulation from the LMC itself is likely to be minimal and does not significantly affect our results.
After correcting for the estimated Galactic ISM contribution, we derived an intrinsic modulation index value for PSR J05296652 for each profile phase bin. Fig. 5 shows the modulation indices for the on-pulse profile bins overlaid with the profile intensity. We selected the bin with the highest S/N (the profile peak) for the analysis, which also had the most precise modulation index measurement. As stated in Jenet & Gil (2003), this is the bin that is least likely to be affected by outlying conal emission components, which can introduce additional variability and can complicate the interpretation of the modulation index as a feature of the polar cap physics. This bin also had the lowest value of , as expected (see Jenet & Gil 2003), and from this we derived an intrinsic modulation index of for PSR J05296652 (Table 1). The modulation indices measured for our three test pulsars using the same method are also presented in Table 1. As expected, these values are all small () and are consistent with the range seen for most radio pulsars (see, e.g., Fig. 6).
Fig. 1 shows the pulse stack for PSR J05296652, which clearly shows its variability. As stated above, the LMC itself is likely not a major contributor to this variability. The diffraction scintillation time scale at 1400 MHz for PSR J05296652 from Galactic plasma is s (Cordes & Lazio, 2002), significantly longer than the minute time scales (or less) that seem to be present qualitatively in the pulse stack. The scintillation bandwidth is also much smaller than the observing bandwidth (see Table 1). This suggests that the variability of the emission is intrinsic to the pulsar and is consistent with the large intrinsic modulation index measured.
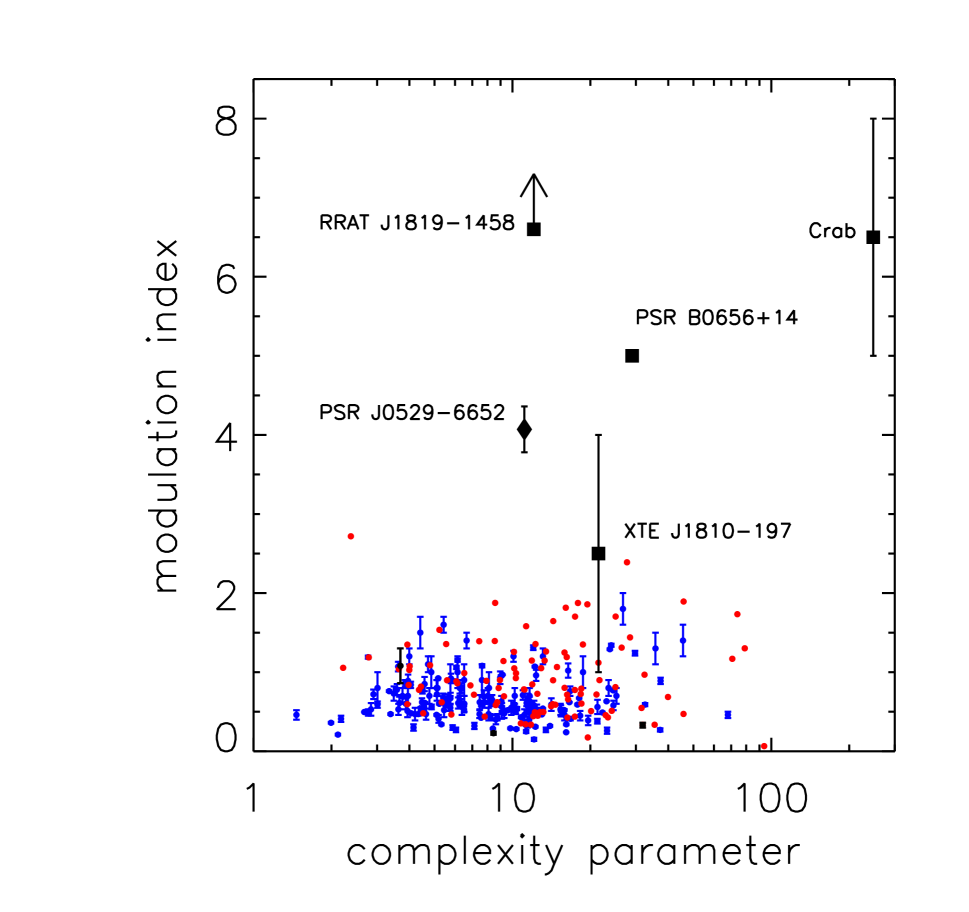
Fig. 6 shows the intrinsic modulation index vs. the complexity parameter derived using the Gil & Sendyk (2000) model for several samples of pulsars. 174 pulsars measured by Weltevrede et al. (2006a) are plotted as small blue dots (see their Table 2 and Fig. 10; note that their Crab measurement was excluded in their figure and is also not included here). In addition, 102 of the 103 pulsars measured by Burke-Spolaor et al. (2012) for which there was also a cataloged are plotted as small red dots, but no error bars are given for these values. Our three test pulsars are plotted as small black dots with error bars, and our measurement for PSR J05296652 is indicated by the large diamond (see also Table 1). All of these measurements were taken near 1400 MHz. Although PSR J05296652 has a complexity parameter and physical characteristics that are typical of the rest of the sample (and the overall radio pulsar population in general; see Fig. 7), it nevertheless has a modulation index that lies well above this sample and the sample of 12 pulsars shown in Fig. 1 of Jenet & Gil (2003). Only two of the pulsars measured in any of these samples (apart from PSR J05296652) have .
The large modulation index for PSR J05296652 is closer to the ranges and limits presented in Table 4 of Weltevrede et al. (2011) for four members of different neutron star classes (these are plotted in Fig. 6 as large squares). These four sources are the Crab pulsar (see above), the radio magnetar XTE J1810197, the RRAT J18191458, and the RRAT-like pulsar PSR B0656+14. All of the measurements of these sources were taken near 1400 MHz, except for PSR B0656+14, which was taken at 327 MHz. Like PSR J05296652, they all have modulation indices that are significantly larger than the values that have been measured for typical radio pulsars. However, with the possible exception of PSR B0656+14, none lies near the center of the unrecycled radio pulsar population on the period/period derivative diagram (Fig. 7). Thus, only PSR J05296652 (and possibly PSR B0656+14) are typical pulsars in this sense. In any case, the core-like characteristics of the emission from PSR J05296652 (suggested by its simple and narrow profile morphology and its symmetric sign change in circular polarization), plus its unremarkable spin and physical parameters (Crawford et al. 2001; see also Fig. 6), suggest that this pulsar is more useful for a test of the correlation predicted by the Gil & Sendyk (2000) emission model than these other neutron stars, all of which are physically unusual in different ways. We conclude that the large modulation index measured for PSR J05296652 is not consistent with the Gil & Sendyk (2000) emission model, which predicts a small modulation index for a relatively large complexity parameter. We note also that the radio magnetar PSR J16224950 (Levin et al., 2010) has a relatively small measured modulation index ( measured by Burke-Spolaor et al. (2012) at 1.4 GHz, and measured by Levin et al. (2012) at 3.1 GHz). This indicates that not all magnetars exhibit extreme radio modulation like XTE J1810197, just as PSR J05296652 illustrates that not all typical radio pulsars have low modulation.
4 Conclusions
We have studied the variability of PSR J05296652, a luminous radio pulsar in the LMC, using observations taken at 1390 MHz with the Parkes 64-m telescope. The pulsar emits detectable single radio pulses that can be classified as giant pulses, making this the second known pulsar in the LMC (after PSR B054069) to do so. These pulses are comparable in width to and occur at the same phase as the integrated profile peak, suggesting that they are not giant micropulses. The characteristics of the giant pulses appear to be closer to those seen from PSR B0656+14 than from classical giant pulse emitters, such as the Crab pulsar. The fraction of the pulses emitted by PSR J05296652 that are individually detectable as single pulses at this frequency is two orders of magnitude greater than either PSR B054069 or the Crab pulsar (if the latter were located in the LMC). PSR J05296652 also appears to exhibit nulling behavior, and we have measured a NF of % for the pulsar. Pulsed radio emission is either not present for the majority of pulse periods, or it is too weak in most cases to be individually detectable above the noise. Given the large distance to the pulsar, this is a possibility that must be considered. Our measured intrinsic modulation index for PSR J05296652 is , which is significantly larger than the values previously measured for typical radio pulsars with similar spin and physical characteristics. It is comparable to the larger values presented by Weltevrede et al. (2011) for several members of other neutron star source classes that are known to be radio variable. Unlike these other sources, however, PSR J05296652 has spin and physical characteristics that are typical of the unrecycled radio pulsar population. These features make this pulsar useful as a test of the Gil & Sendyk (2000) emission model, and the large modulation index measured for PSR J05296652 does not appear to be consistent with the model prediction. This conclusion depends to some degree on the assumption that PSR J05296652 is exhibiting core emission, as seems to be the case given its simple profile morphology, narrow profile width, and previously measured polarization characteristics at 600 MHz.
References
- Argyle & Gower (1972) Argyle, E., & Gower, J. F. R. 1972, ApJ, 175, L89
- Bozzetto et al. (2012) Bozzetto, L. M., Filipović, M. D., Crawford, E. J., et al. 2012, MNRAS, 420, 2588
- Burke-Spolaor et al. (2011) Burke-Spolaor, S., Bailes, M., Ekers, R., Macquart, J.-P., & Crawford, F., 2011, ApJ, 727, 18
- Burke-Spolaor et al. (2012) Burke-Spolaor, S., Johnston, S., Bailes, M., et al. 2012, MNRAS, 423, 1351
- Camilo et al. (2006) Camilo, F., et al. 2006, Nature, 442, 892
- Cognard et al. (1996) Cognard, I., Shrauner, J. A., Taylor, J. H., & Thorsett, S. E. 1996, ApJ, 457, L81
- Cordes et al. (1990) Cordes, J. M., Wolszczan, A., Dewey, R. J., Blaskiewicz, M., & Stinebring, D. R. 1990, ApJ, 349, 245
- Cordes & Lazio (2002) Cordes, J. M. & Lazio, T. J. W. 2002, astro-ph/0207156
- Cordes & McLaughlin (2003) Cordes, J. M., & McLaughlin, M. A. 2003, ApJ, 596, 1142
- Costa et al. (1991) Costa, M. E., McCulloch, P. M., & Hamilton, P. A. 1991, MNRAS, 252, 13
- Crawford et al. (2001) Crawford, F., Kaspi, V. M., Manchester, R. N., Lyne, A. G., Camilo, F., & D’Amico, N. 2001, ApJ, 553, 367
- Crawford et al. (2005) Crawford, F., McLaughlin, M., Johnston, S., Romani, R., & Sorrelgreen, E. 2005, Advances in Space Research, 35, 1181
- Crawford et al. (2009) Crawford, F., Lorimer, D. R., Devour, B. M., Takacs, B. P., & Kondratiev, V. I. 2009, ApJ, 696, 574
- Gil & Sendyk (2000) Gil, J. A., & Sendyk, M. 2000, ApJ, 541, 351
- Jenet et al. (2001) Jenet, F. A., Anderson, S. B., & Prince, T. A. 2001, ApJ, 546, 394
- Jenet & Gil (2003) Jenet, F. A., & Gil, J. 2003, ApJ, 596, L215
- Jenet & Gil (2004) Jenet, F. A., & Gil, J. 2004, ApJ, 602, L89
- Johnston et al. (2001) Johnston, S., van Straten, W., Kramer, M., & Bailes, M. 2001, ApJ, 549, L101
- Johnston & Romani (2003) Johnston, S., & Romani, R. W. 2003, ApJ, 590, L95
- Johnston & Romani (2004) Johnston, S., & Romani, R. W. 2004, Young Neutron Stars and Their Environments, 218, 315
- Karuppusamy et al. (2010) Karuppusamy, R., Stappers, B. W., & van Straten, W. 2010, A&A, 515, A36
- Karuppusamy et al. (2011) Karuppusamy, R., Stappers, B. W., & Serylak, M. 2011, A&A, 525, A55
- Keith et al. (2010) Keith, M. J., Jameson, A., van Straten, W., et al. 2010, MNRAS, 409, 619
- Knight (2006) Knight, H. S. 2006, Chinese Journal of Astronomy and Astrophysics Supplement, 6, 41
- Koerwer (2009) Koerwer, J. F. 2009, AJ, 138, 1
- Levin et al. (2010) Levin, L., Bailes, M., Bates, S., et al. 2010, ApJ, 721, L33
- Levin et al. (2012) Levin, L., Bailes, M., Bates, S. D., et al. 2012, MNRAS, 422, 2489
- Lorimer & Kramer (2005) Lorimer, D. R., & Kramer, M. 2005, Handbook of Pulsar Astronomy (Cambridge: Cambridge University Press)
- Lundgren et al. (1995) Lundgren, S. C., Cordes, J. M., Ulmer, M., et al. 1995, ApJ, 453, 433
- Manchester et al. (2001) Manchester, R. N., et al. 2001, MNRAS, 328, 17
- Manchester et al. (2005) Manchester, R. N., Hobbs, G. B., Teoh, A., & Hobbs, M. 2005, AJ, 129, 1993
- Manchester et al. (2006) Manchester, R. N., Fan, G., Lyne, A. G., Kaspi, V. M., & Crawford, F. 2006, ApJ, 649, 235
- Marshall et al. (1998) Marshall, F. E., Gotthelf, E. V., Zhang, W., Middleditch, J., & Wang, Q. D. 1998, ApJ, 499, L179
- McConnell et al. (1991) McConnell, D., McCulloch, P. M., Hamilton, P. A., Ables, J. G., Hall, P. J., Jacka, C. E., & Hunt, A. J. 1991, MNRAS, 249, 654
- McCulloch et al. (1983) McCulloch, P. M., Hamilton, P. A., Ables, J. G., & Hunt, A. J. 1983, Nature, 303, 307
- McLaughlin et al. (2006) McLaughlin, M. A., et al. 2006, Nature, 439, 817
- Rankin (1983) Rankin, J. M. 1983, ApJ, 274, 333
- Rankin (1990) Rankin, J. M. 1990, ApJ, 352, 247
- Ruderman & Sutherland (1975) Ruderman, M. A., & Sutherland, P. G. 1975, ApJ, 196, 51
- Seward et al. (1984) Seward, F. D., Harnden, F. R., & Helfand, D. J. 1984, ApJ, 287, L19
- Staelin & Reifenstein (1968) Staelin, D. H., & Reifenstein, E. C. 1968, Science, 162, 1481
- Staveley-Smith et al. (1996) Staveley-Smith, L., et al. 1996, Publications of the Astronomical Society of Australia, 13, 243
- Tao et al. (2012) Tao, G.-C., Esamdin, A., Hu, H.-D., et al. 2012, arXiv:1206.5885
- Wang et al. (2007) Wang, N., Manchester, R. N., & Johnston, S. 2007, MNRAS, 377, 1383
- Weisberg et al. (1986) Weisberg, J. M., Armstrong, B. K., Backus, P. R., Cordes, J. M., Boriakoff, V., & Ferguson, D. C. 1986, AJ, 92, 621
- Weltevrede et al. (2006a) Weltevrede, P., Edwards, R. T., & Stappers, B. W. 2006a, A&A, 445, 243
- Weltevrede et al. (2006b) Weltevrede, P., Stappers, B. W., Rankin, J. M., & Wright, G. A. E. 2006b, ApJ, 645, L149
- Weltevrede et al. (2011) Weltevrede, P., Johnston, S., & Espinoza, C. M. 2011, MNRAS, 411, 1917


| Pulsar | J05296652 | J04374715 | J05367543 | J13596038 |
|---|---|---|---|---|
| Topocentric period, (s)aaObtained or derived from the ATNF pulsar catalog (Manchester et al., 2005). | 0.97573571876 | 0.00575786 | 1.24585559629 | 0.12751295 |
| Dispersion measure, DM (pc cm-3)aaObtained or derived from the ATNF pulsar catalog (Manchester et al., 2005). | 103.2 | 2.6 | 17.5 | 293.7 |
| Number of consecutive pulses used, | 4299 | 20839 | 240 | 1943 |
| Number of profile bins | 128 | 128 | 128 | 128 |
| Center observing frequency (MHz) | 1390 | 1390 | 1390 | 1374 |
| Sampling time (s) | 500 | 80 | 250 | 500 |
| Observing bandwidth, (MHz) | 256 | 256 | 256 | 288 |
| Scintillation bandwidth, (MHz)bbEstimated from the NE2001 Galactic electron model of Cordes & Lazio (2002). | 1.51 | 318 | 22 | |
| Modulation index for the ISM, ccEstimated contribution to the modulation from propagation through the Galactic ISM. | ||||
| Measured modulation index, ddMeasured from the normalized pulse stack. The lowest value of among the on-pulse bins was chosen (see Jenet & Gil (2003) and the text for justification). | ||||
| Intrinsic modulation index, eeObtained after correction for the estimated Galactic ISM contribution. | ||||
| Measured nulling fraction (NF)ffThe uncertainty in NF was determined by , where is the number of pulses used. | % | % | % | % |
Note. — All observations were taken with the center beam of the multibeam receiver and MHz channel analog filterbank system at the Parkes telescope, except for PSR J13596038, where MHz channels were used (Manchester et al., 2001).
| Pulsar | Wang et al. (2007)aaValues from Table 1 of Wang et al. (2007). | This Work | bbNumber of subintegrations used in our NF measurements. The uncertainty in the NF was determined by . |
|---|---|---|---|
| J10495833 | % | % | 8 |
| J15025653 | % | % | 120 |
| J15255417 | % | % | 361 |
Note. — For all three pulsars, different sets of Parkes data were used for our measurements than were used by Wang et al. (2007). All of the data used in both sets of measurements had a center frequency of 1518 MHz, except for our measurement of PSR J10495833, which had a center frequency of 1318 MHz.