11email: salonso@icate-conicet.gob.ar 22institutetext: ICATE, CONICET-UNSJ, CC 49, 5400, San Juan, Argentina
33institutetext: IATE, CONICET, OAC, Universidad Nacional de Córdoba, Laprida 854, X5000BGR, Córdoba, Argentina
Effect of bars in AGN host galaxies and black hole activity
Abstract
Aims. With the aim of assessing the effects of bars on active galactic nuclei (AGN), we present an analysis of host characteristics and nuclear activity of AGN galaxies with and without bars.
Methods. We select AGN galaxies from the Sloan Digital Sky Survey Data Release 7 (SDSS-DR7), using the available emission-line fluxes. By visual inspection of SDSS images we classified the hosts of face-on AGN spiral galaxies brighter than mag16.5 into barred or unbarred. With the purpose of providing an appropriate quantification of the effects of bars, we also constructed a suitable control sample of unbarred AGN galaxies with similar redshift, magnitude, morphology, bulge sizes and local environment distributions.
Results. We find that the bar fraction, with respect to the full sample of spiral face-on AGN host galaxies, is 28.5, in good agreement with previous works. Barred AGN host galaxies show an excess of young stellar populations (as derived with the spectral index), dominated by red and colors, with respect to the control sample, suggesting that bars produce an important effect on galaxy properties of AGN hosts. Regarding the nuclear activity distribution, we find that barred AGN galaxies show a shift toward higher values with respect to AGN without bars. In addition, we also find that this trend is more significant in less massive, younger stellar population and bluer AGN host galaxies. We found that the fraction of powerful AGN increase towards more massive hosts with bluer colors and younger stellar populations residing in denser environments. However, barred host AGN systematically show a higher fraction of powerful active nuclei galaxies with respect to the control sample. We also explored the accretion rate onto the central black holes finding that barred AGN show an excess of objects with high accretion rate values with respect to unbarred AGN galaxies.
Key Words.:
galaxies: formation - galaxies: active - galaxies: spiral1 Introduction
It is widely accepted that the mechanism responsible for Active Galactic Nuclei (AGN) is based on the accretion of matter by massive black holes at the centres of galaxies (Lynden-Bell 1969; Rees 1984). Several theories have been proposed to explain the black hole feeding mechanisms needed to transport mass to the most inner region of the central engine. The major galaxy interaction (Alonso et al. 2007), minor mergers (Roos 1981, 1985; Hernquist & Mihos 1995), tidal disruption produced by galaxy harassment (Lake, Katz & Moore 1998), gas dynamic processes involving the presence of multiple black holes (Begelman, Blandford & Rees 1980) and gravitational instabilities in the disk of barred galaxies (Shlosman, Begelman & Frank 1990) can cause gas transfer to the central regions of galaxies. One must also consider that it is plausible that at any given time or for any given AGN type, more than one mechanism plays a role.
In particular, the presence of bars plays an important role in the evolution, star-formation and nuclear activity of galaxies. The relation between star-forming galaxies and bars has been the subject of several works (Balzano 1983; Devereux 1987) finding that in some cases bars seem to be an appropriate way to produce radial gas flow favoring an increasing star formation rate in the galaxies (Martin 1995) which could be even more effective than galaxy interactions (Ellison et al. 2011). Considering the known connection between star-formation and nuclear activity of galaxies (Springel, Di Matteo & Hernquist 2005; Di Matteo, Springel & Hernquist 2005) it could be expected that bars also increase the AGN activity.
Furthermore, several studies suggest that the gas clouds within galaxies suffer shocks by interaction with the edges of the bars producing angular momentum losses and allowing a flow of gas within the innermost regions of galaxies (Shlosman, Begelman & Frank 1990). Also, a system of bars (”bars within bars”) of different lengths and properties has been proposed (Shlosman, Begelman & Frank 1990) and observed (Emsellem et al. 2001) to have an association with the AGN activity. Erwin (2004) found fifty double-barred galaxies with inner or secondary bar is embedded within a large-scale, outer or primary bar, of the catalog of 67 barred galaxies which contain elliptical stellar structures inside their bars. In addition, the presence of bars can explain the formation of bulges which are also directly related to the probability of occurrence of AGN (Wyse 2004). Coelho & Gadotti (2011) analyzed barred and unbarred galaxy samples with similar stellar mass distributions, finding similar age-metallicity diagrams in both samples; however, in the distribution of bulge ages in barred galaxies showed an excess of younger populations, with respect to bulges in unbarred ones. They also found, for low-mass bulges, twice as much AGN in barred galaxies, as compared to unbarred galaxies.
However, although there is observational evidence that bars cause central concentrations of gas, compared to non-barred galaxies, there is no clear agreement whether the large-scale bars are efficient for the transport of material directly to the regions closest to the black hole (Knapen 2005). Ho, Filippenko & Sargent (1997) found that the existence of bars in a sample of 300 spiral galaxies has no significant effect on the AGN power. More recently, Oh, Oh & Yi (2012) found a signal of bar effect in the AGN activity mainly present in blue galaxies with low black hole mass. This AGN sample was selected with Kauffmann et al. (2003) criteria from a volume limited sample of SDSS-DR7 late-type galaxies () with good image qualities. On the other hand, Lee et al. (2012) used a sample of AGN, selected with Kewley et al. (2001) classification, also from SDSS-DR7 volume limited sample of SDSS-DR7 late-type galaxies () finding that AGN power is not enhanced by bars. In this analysis, Lee et al. (2012) do not include the Composite galaxies within the sample of AGN host and these galaxies are, in general, younger and less massive (Kewley et al. 2006) than the AGN sample defined by the Kewley et al. (2001) criteria. So, the different AGN selection criteria could affect the results related to the effect of enhanced AGN activity by bars.
This discrepancy in the results could be due mainly to: i) a biased selection of the control sample, used for the comparison of the obtained results. In this sense Perez, Tissera & Blaizot (2009) suggest that a control sample for interacting galaxies should be selected matching, at least, redshift, morphology, stellar masses and local densities. This criteria is, also, applicable to the building of control samples of barred galaxies due to its having different properties than unbarred galaxies. ii) the short time of life of bars, 1-2 Gyr (Bournaud, Combes & Semelin 2005) which represents a brief period in the life of an AGN. Moreover, studies using numerical simulations (Bournaud & Combes 2002) found that bars within galaxies can be destroyed and re-formated a couple of time during the galaxy life. Moreover, the 3D N-body simulations (Athanassoula et al. 2005) showed that the central mass concentration necessary to destroy the bar is, at least, several per cent of the mass of the disc; suggesting that, supermassive black holes are not likely to destroy pre-existing bars. So, in this context bars formed at different times, with different conditions, could be present in the sample of barred galaxies.
In this work we made a detailed study of the properties of barred host galaxies and the effects that bars produce in the AGN power is a sample of spiral galaxies comparing the results with a carefully selected sample of unbarred AGN. In section 2 we described the type II AGN selection method, the bar classification and the control sample selection criteria. In section 3 we analyse the dependence of the AGN host galaxy properties with the bar presence. The influence of bars in the black hole activity is detailed in Section 4 and finally the conclusions are summarized in Section 5. The adopted cosmology through this paper is: , and .
2 The AGN SDSS-DR7 Catalog
The Sloan Digital Sky Survey (SDSS, York et al. (2000)) is the largest galaxy survey at the present. It uses a 2.5m telescope (Gunn et al. 2006) to obtain photometric and spectroscopy data that will cover approximately one-quarter of the celestial sphere and collect spectra of more than one million objects. The seven data release imaging (SDSS-DR7, Abazajian et al. (2009)) comprises 11663 square degrees of sky imaged in five wave-bands (, , , and ) containing photometric parameters of 357 million objects. SDSS-DR7 therefore represents the final data set that will be released with the original targeting and galaxy selection (Eisenstein et al. 2001; Strauss et al. 2002). The main galaxy sample, which contains galaxies with measured spectra and photometry, is essentially a magnitude limited spectroscopic sample (Petrosian magnitude) , most of galaxies span a redshift range with a median redshift of 0.1 (Strauss et al. 2002).
Several physical galaxy properties have been derived and published for the SDSS-DR7 galaxies: gas-phase metallicities, stellar masses, indicators of recent major star-bursts, current total and specific star-formation rates, emission-line fluxes, Sérsic index, etc. (Brinchmann et al. 2004; Tremonti et al. 2004; Blanton et al. 2005). These data were obtained from the MPA/JHU111http://www.mpa-garching.mpg.de/SDSS/DR7/ and the NYU222http://sdss.physics.nyu.edu/vagc/ value added catalogs.
For the AGN selection we used the publicly available emission-line fluxes. The method for emission-line measurement is detailed in Tremonti et al. (2004). Additionally, we corrected the emission-line fluxes for optical reddening using the Balmer decrement and the Calzetti et al. (2000) obscuration curve. We assumed an and an intrinsic . Since the true uncertainties in the emission-line measurements were underestimated the signal-to-noise () of every line was calculated with the emission-line flux errors adjusted according to the uncertainties suggested by the MPA/JHU catalog 333http://www.mpa-garching.mpg.de/SDSS/DR7/rawdata.html.
The AGN galaxy sample was selected using a standard diagnostic diagram proposed by Baldwin, Phillips & Terlevich (BPT, 1981) (hereafter BPT). This diagram allows for the separation of type 2 AGN from normal star-forming galaxies using emission-line ratios and depending on their position in the diagram. Furthermore, we used only galaxies with signal-to-noise ratio S/N for all the lines intervening in the diagnostic diagram used to discriminate AGN from HII galaxies. This S/N cut was selected taking into account that the adjusted uncertainties almost duplicated the original errors. So, taking into account the relation between spectral lines, , , and , within the BPT diagram we follow the Kauffmann et al. (2003) criterion to select type 2 AGN as those with:
| (1) |
2.1 Selection of barred AGN galaxies
With the aim of obtaining an AGN sample with barred galaxy hosts, we firstly cross-correlated the SDSS-DR7 AGN galaxies with the spiral objects obtained from the Galaxy Zoo catalog (Lintott et al. 2011), which comprises a morphological classification of nearly 900,000 galaxies drawn from the SDSS. Then, we restricted the AGN spiral edge-on galaxy sample in redshift () and we imposed a magnitude cut such as the extinction corrected SDSS mag is brighter than 16.5. We have selected galaxies with axial ratio since the efficiency of the visual classification decreases with galaxy inclination. With these restrictions, our AGN sample in the SDSS-DR7 comprises 6772 galaxies.
By using the photometric SDSS-DR7, we classified the host galaxies of the AGN spiral galaxy sample morphologically taking into account the naked-eye detection of barred features, finding 1927 AGN hosted in barred galaxies. This represents a fraction of 28.5 with respect to the full sample of 6772 AGN in spiral host galaxies, and this value agrees with the bar fraction found by visual inspection of optical galaxy samples in previous works. 207 objects which were not completely confiable with the bar classification were not included. The details of the classification are listed in Table 1. We have checked for possible dependencies of our classification on redshift by computing the fraction of barred hosts in different redshift intervals finding a nearly constant value of . In particular, there are 244 galaxies within z0.02 out of which 74 (30) have bars. Thus, the presence of small bars, visible in this closer subsample, is not expected to be a significant fraction in our sample of unbarred objects.
Several studies, carried out by means of visual inspection of different optical galaxy samples (e.g. the RC3 and UGC, de Vaucouleurs et al. (1991); Nilson (1973); Marinova et al. (2009)) found a bar fraction of 25-30. Moreover, Masters et al. (2010) computed the mean bar fraction, finding 29.4 of barred galaxies from a sample of 13665 Galaxy Zoo disk objects. More recently, Oh, Oh & Yi (2012) detected a bar fraction of 29.5 (715 AGN barred galaxies), in the sample of AGN galaxies obtained from SDSS-DR7, in the redshift range . However, others studies using near-infrared images from 2MASS (Menéndez-Delmestre et al. 2007) and SDSS image decompositions of , and bands (Gadotti 2009) found a larger fraction of bars, 59% and 42%, respectively.
| Classification | Number of galaxies | Percentages |
|---|---|---|
| Barred | 1927 | 28.5 |
| Unclear barred | 207 | 3.0 |
| Unbarred | 4638 | 68.5 |
| Total | 6772 | 100.0 |
To corroborate the accuracy of our selection criteria, we cross-correlated our sample with barred AGN galaxies taken from the catalog of Nair & Abraham (2010). They constructed a catalog of detailed visual classification for 14034 galaxies in the Sloan Digital Sky Survey Data Release 4 (SDSS-DR4). The sample includes galaxies in the redshift range , with mag 16. They detected a total of 454 barred AGN galaxies sub-classified, depending on the relatively light contribution of the bar in: strong, intermediate and weak. We found 399 (87.9) of a common barred AGN galaxies in the two samples. However, the Nair & Abraham (2010) catalog classified 307 strong and intermediate barred AGN galaxies, from the total sample, from which we found 297 common galaxies, representing the 96.5 of overlap. Considering that we have matched catalogs derived through visual classification, and that this kind of classification could be subjective, the level of agreement is very high.
We focus our attention on the effects of bars on the nuclear activity and it is very well known that galaxy interactions contribute to the AGN power enhancement (Alonso et al. 2007). So, for the purpose of having unbiased results with respect to the bar effects in AGN we derived a sample of AGN hosted by relatively isolated barred galaxies. In order to construct a sample with suitable isolation criterion for barred galaxies we require that any neighboring galaxy within a region of 500 kpc in projected separation and 1000 km must be fainter than the barred AGN galaxy. With this restriction, the final sample of isolated barred AGN is composed by 1530 galaxies.
2.2 Control sample
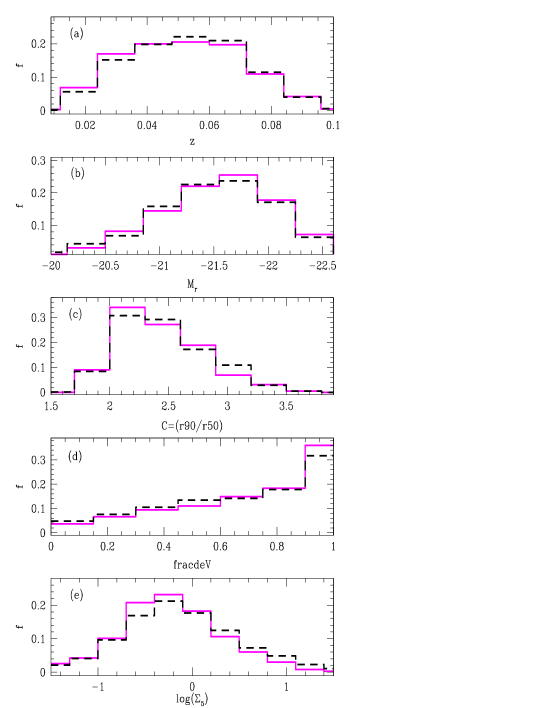
In order to provide a suitable quantification of the effects of bars on active galactic nuclei, we constructed a control sample of unbarred AGN hosts to confront by comparison with the barred host results. First, from the sample of 4638 unbarred AGN spiral face-on galaxies (with and mag16.5) we selected isolated objects, using a suitable isolation criterion defined in the previous section for the barred AGN sample. Then, we defined a sample of control galaxies using a Monte Carlo algorithm that selects galaxies in the unbarred isolated sample, with similar redshift, band magnitude and concentration index444 is the ratio of Petrosian 90 %- 50% r-band light radii, , distributions of the barred AGN sample (see panels a, b and c in Fig.1). We restricted the control sample of unbarred AGN hosts to match the concentration parameter of the AGN barred sample in order to have a similar bulge to disk ratio in both samples. So, the possible differences in the results are associated with the presence of bars and not with the difference in the global morphology.
Coelho & Gadotti (2011) found that bulges in barred galaxies have a lower mass than in unbarred galaxies with similar total stellar mass distribution. Since this tendency could be affect our future analysis, we have considered galaxies with similar bulge prominence in both samples and we have selected the control galaxies with a similar distribution of the parameters of the barred AGN host sample (panel in Fig.1). We notice that the SDSS parameter is a good indicator of bulge sizes in galaxies with disk morphology (Kuehn 2005; Bernardi et al. 2010; Masters et al. 2010; Skibba et al. 2012) and that Masters et al. (2010) conclude that this result is independent of the presence of bars.
We have also selected a control sample with similar distribution of local density environment to that of barred galaxies. With this aim, for both isolated samples (barred and unbarred) we defined a projected local density parameter, . This parameter is calculated through the projected distance to the nearest neighbor, . Neighbors have been chosen to have luminosities above a certain threshold and with a radial velocity difference less than 1000 km . We also imposed the condition to select in SDSS (Balogh et al. 2004). Panel () in Fig.1 shows the distribution for both samples.
The procedure followed to construct this control catalog assures that it will have the same selection effects as the barred AGN catalog, and consequently, it can be used to estimate the actual difference between AGN galaxies with and without bars, unveiling the effect of the bars on the nuclear activity driven by the central black hole feeding.
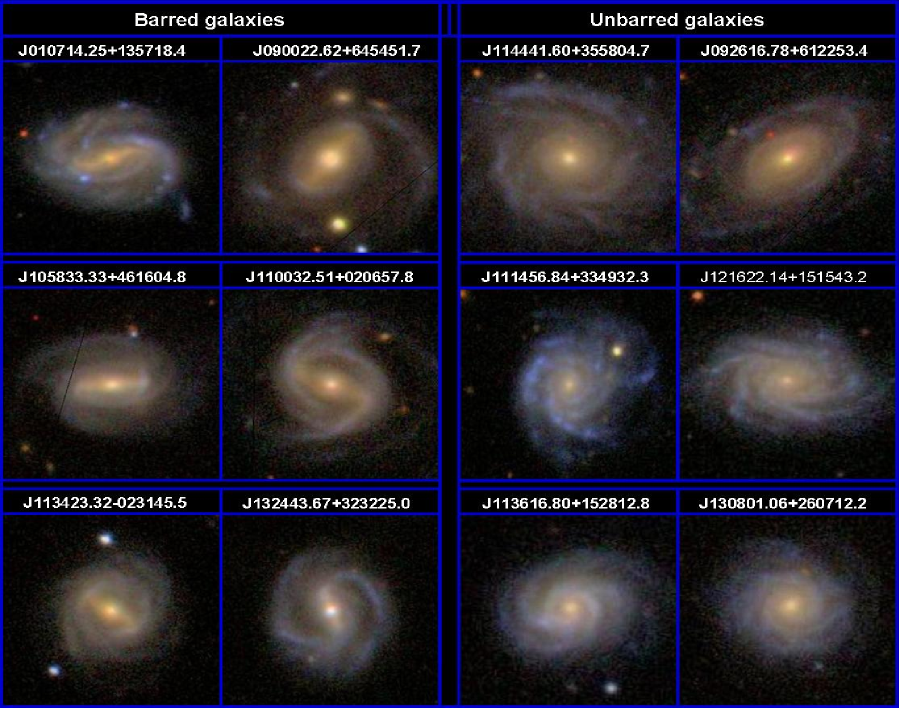
Fig.2 shows images of typical examples of barred and unbarred AGN galaxies (left and right panels, respectively) selected for this work.
3 AGN host properties
Different studies have shown that the bars can induce several processes which modify many properties of the galaxies (e.g. Sellwood & Wilkinson (1993); Combes et al. (1993); Zaritsky et al. (1994)) and also can have associated different star formation history. The bars can trigger nuclear starbursts (Gadotti & dos Anjos 2001), modify the galactic structure (Athanassoula 1983; Buta & Combes 1996), change the chemical composition and dynamics of gas (Martin & Roy 1994; Combes et al. 1993), etc. With the purpose of analyzing the impact of bars on the AGN host properties, in this section we explored the effect of bars on the stellar population, color index and local density environment of the AGN host galaxies.
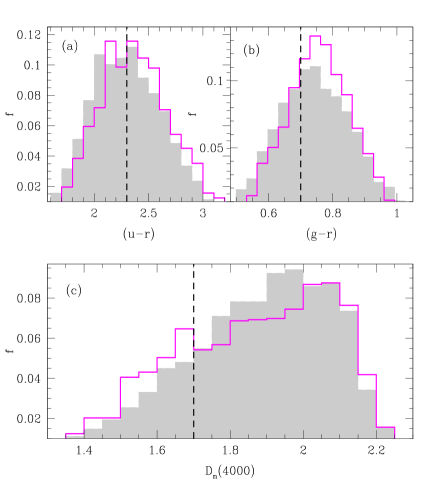
In Fig. 3 (upper panels) we show the and color distributions of barred and unbarred AGN galaxies. It can be seen that there is a clear excess of barred AGN hosts with redder colors. In the same direction, recent results of Masters et al. (2010) found that passive red spiral galaxies had a high fraction of bars, within a sample obtained from the Galaxy Zoo catalog. Furthermore, Oh, Oh & Yi (2012) also found that a significant number of barred galaxies are redder than typical late-type galaxies, and the majority of unbarred spiral galaxies are located in the blue peak. Our results on barred AGN galaxies are consistent with those of barred galaxies without nuclear activity found in previous works.
To complement this analysis, we also use the spectral index as an indicator of the age of stellar populations. This spectral discontinuity occurring at 4000 (Kauffmann et al. 2003) arises by an accumulation of a large number of spectral lines in a narrow region of the spectrum, an effect that is important in the spectra of old stars. We have adopted Balogh et al. (1999) definition of as the ratio of the average flux densities in the narrow continuum bands (3850-3950 and 4000-4100 ). In the lower panel of Fig. 3 we show the distribution of values for barred AGN and galaxies without bars in the control sample. We find an excess of barred objects exhibiting lower values of , showing that the hosts of barred AGN galaxies have an important young stellar population. The differences in the colour and distributions of barred and unbarred AGN (Fig. 3) were confirmed using the Kolmogorov-Smirnov test with a significance higher than 99,95%.
According to these results, we define a population of red and young hosts by restricting to values of colors and parameters for the barred AGN sample. The thresholds are indicated by the dashed vertical line in Fig.3. In Table 2 we quantify this excess of red colors and young stellar population of barred AGN galaxies with respect to the control sample.
| Restrictions | |||
|---|---|---|---|
| of barred | 58.1 | 63.6 | 30.1 |
| of unbarred | 49.3 | 54.2 | 22.3 |
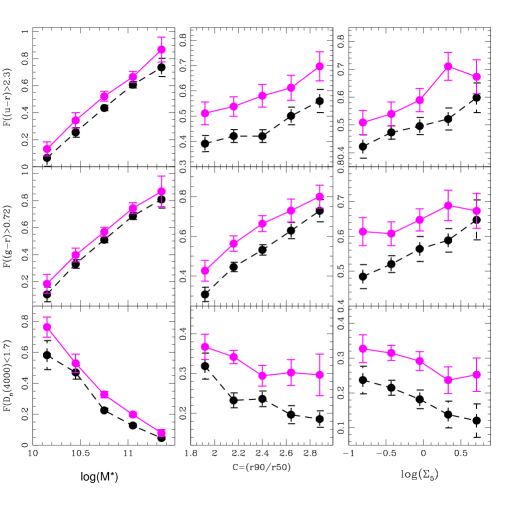
In order to understand the behavior of the colors and stellar populations of barred AGN with respect to AGN galaxies without bars, we have analysed the relative fractions of red and young stellar populations. In Fig. 4 we show the fraction of (upper panel), (middle panel) and (lower panel) as a function of stellar mass, , concentration index, , and local environment parameter, , for barred AGN galaxies and for the control sample (solid and dashed lines, respectively). Errors have been estimated by applying the bootstrap resampling technique in all figures (Barrow, Bhavsar & Sonoda 1984) the error-bar length correspond to 1. As can be seen in the left panels, the fraction of red AGN galaxies increases towards high stellar masses and, on the other hand, the fraction of young stellar population decrease with . It can be seen that barred AGN host galaxies have a systematically higher fraction of redder colors and younger stellar population in different bins of stellar mass, suggesting that bars have an important effect in producing a rapid transformation of gas into stars associated to reddening and a young population of stars.
Middle panels of Fig. 4 show that the red/young fraction increase/decrease toward the more concentrated host galaxies, for both barred and unbarred AGN. This result is consistent with expectations, since galaxies with higher values of the concentration index are related to the bulge type morphology, and lower concentration objects, to spiral galaxies. It can also be seen that barred AGN galaxies (solid lines) show higher fractions of red and young population, for the whole range of the parameter compared to their counterpart of unbarred AGN in the control sample.
Regarding to the relation between bars and environment, different works find that local density could be important in the formation of bars, although results are contradictory. Numerical simulations (e.g. Walker et al. (1996); Mihos et al. (1997); Berentzen et al. (2004)) show that bars are created by interactions between galaxies. Different observational studies find that the bar galaxy fraction does not depend on the environment (van den Bergh 2002; Mendez-Abreu et al. 2010; Martinez & Muriel 2011). More recently, Lee et al. (2012) also find that the fraction of weak bars has no correlation with environmental parameters, suggesting that there is no direct evidence for environmental stimulation of bar formation. On the other hand, Elmegreen et al. (1990) show a correlation between the bar fraction and environment for spiral galaxies, finding the highest fraction in pair systems. More recently, Skibba et al. (2012), from a sample obtained from the Galaxy Zoo 2 project, clearly detected the environmental dependence of barred galaxies, such that barred tend to be found in denser environments than their unbarred counterparts, with environmental correlations that are statistically significant (at a level of 6) on scales of 150 kpc to a few Mpc. The authors argue that the small number statistics of previous studies inhibited their detection of a bar-environment correlation.
In order to study the dependence of colors and stellar populations of AGN hosts on the environment, we show in the right panels of Fig. 4 the red, young population fractions of barred AGN hosts in the control sample as a function of the local galaxy density parameter (). It can be seen a weak trend consistent with the expected increase of the red fractions with local galaxy density for AGN hosts with and without bars. Nevertheless, the fraction of low hosts, where an important young stellar population is present, decreases towards higher values of . Interestingly, in the whole range of , the red and young population fractions of galaxies in barred AGN galaxies (solid lines) exceeds to that of unbarred AGN in the control sample (dashed lines). According to the boostrap error bars this signal is statistically meaningful at more than -level in left panels, and -level in middle and right panels.
From these analysis we conclude that the dependence of colors and stellar populations on environment suggests that bar perturbations are a suitable physical mechanism for a fast star formation activity and a stirring of dust in the central regions of these AGN host galaxies.
4 Black hole activity
As a tracer of the AGN activity, we focus here on the dust corrected luminosity of the [OIII]5007 line, . This estimator is widely used by several authors (Mulchaey et al. 1994; Kauffmann et al. 2003; Heckman et al. 2004, 2005; Brinchmann et al. 2004) and some catalogs of [OIII]5007 luminosities have been published (Whittle 1992; Xu et al. 1999) The main reason is that the [OIII] line is particularly appealing because it is one of the strongest narrow emission lines in optically obscured AGN and with very low contamination by contributions of star formation in the host galaxy. AGN hosts are typically massive galaxies so their metallicities are expected to be high due to the mass-metallicity relation (Kauffmann et al. 2003; Tremonti et al. 2004). For our sample, the majority of the galaxies have so that higher metallicities are expected. Kauffmann et al. (2003) shows by inspection to the BPT diagrams that high metallicity hosts have a low contamination in the by star formation. Furthermore, Heckman et al. (2004), compute the average contribution of the AGN to the for a sample of composite galaxies (AGN above the Kauffmann et al. (2003) criterium but below the Kewley et al. (2001) 2001 line in the BPT diagram) and the AGN-dominated galaxies (above the Kewley et al. (2001) 2001 demarcation in the BPT diagram) taken from SDSS. The results of this work indicate that the emission from composite galaxies comes, in a range of 50% to 90% from AGN activity, while for AGN-dominated galaxies, more than 90% of the comes from AGN emission. In addition, Heckman et al. (2005) found a correlation between the hard X-ray emission of AGN and the OIII luminosity concluding that, at low redshifts, the selection by optical emission lines will recover most AGN selected by hard X-ray emission.
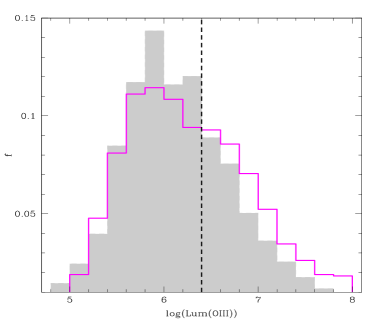
The influence of the bars on nuclear activity can be seen in Fig.5, in the histogram of for barred AGN (solid line), and galaxies in the control sample (full surface). It can be appreciated that barred AGN galaxies show an excess of high values with respect to the control sample. The Kolmogorov-Smirnov statistics allow us to quantify the difference between these distributions with a significance of 99,99%. Here, we consider the luminosity as a limit between weak and powerful AGN, by selecting values that represent the excess of nuclear activity for the barred AGN sample ( for barred AGN galaxies versus for the control sample). This threshold is represented by the dashed vertical line in Fig.5.
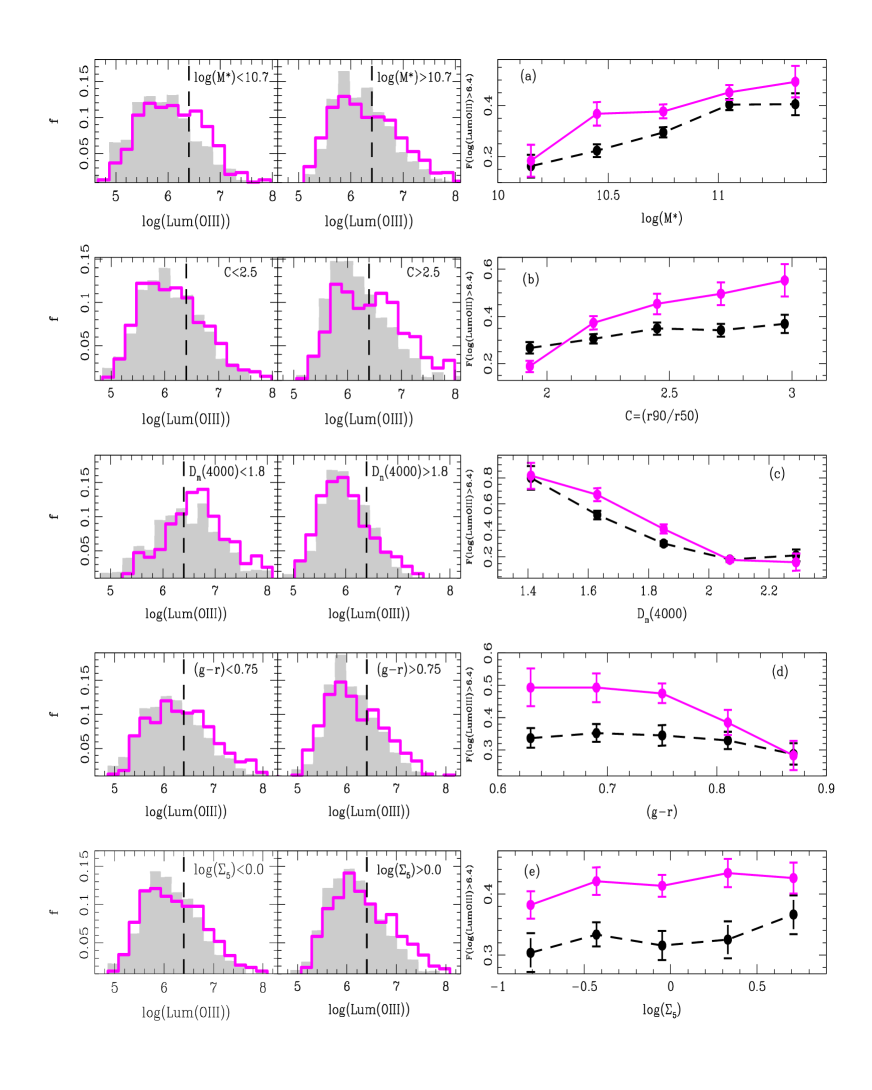
Left and middle panels in Fig. 6, show the nuclear activity distributions, , of barred AGN galaxies in comparison with the unbarred AGN counterparts. The analysis was performed for the different ranges of stellar masses, , concentration parameter, , stellar age indicator, , color and local environment, . We find that in more massive galaxies, with older stellar populations and red colors, the distributions of barred AGN are similar to those of AGN without bars in the control sample. Interestingly, in less massive, younger stellar population and bluer host galaxies ( , and ), the nuclear activity distributions of barred and unbarred AGN exhibit significant differences, with barred objects having a larger fraction of powerful active nuclei galaxies. This behavior can be interpreted in terms of the larger ability of bars to fuel the central black holes in galaxies with a larger gas fraction expected in these hosts. Moreover, we explore the nuclear activity distributions of barred and unbarred AGN with different concentration parameter. The critical concentration index value of is adopted to segregate concentrated, bulge-like () galaxies from more extended, disc-like () objects. Bearing this in mind, we find that in AGN hosts with higher values of , indicating bulge type morphology, barred galaxies show a higher fraction of powerful AGN in comparison with those of unbarred AGN in the control sample.
We have also selected two different local environment ranges, and it can be appreciated that there are no differences in the nuclear activity distributions. In addition, in Table 3 we computed the percentage of barred and unbarred AGN galaxies with , in different ranges of stellar masses, index, age populations, colors and parameter. These percentages reflect the results of distributions (Fig. 6) confirming that most powerful AGN tend to inhabit in blue and young barred host galaxies but with a higher value in the concentration index.
To reinforce the results obtained with distributions, in the right panels of Fig. 6 we present the fraction of galaxies with as a function of galaxy properties. Panel () shows the fraction of galaxies with high values, as a function of stellar mass content of the corresponding host galaxies. This relation has been calculated for barred AGN and for AGN galaxies in the control sample without bars. From the results shown in Fig.6a, it can be clearly appreciated that, in general, most massive hosts show the higher fraction of AGN with . We can also see that barred AGN objects systematically show a higher fraction of powerful AGN galaxies irrespective of the stellar mass content, indicating an enhancement of the black hole activity or barred AGN with respect to AGN residing in unbarred hosts. In the similar way, Oh, Oh & Yi (2012) found that the AGN strength is enhanced by the presence of a bar and linearly correlates with stellar mass.
In panel we show the fraction of powerful AGN galaxies as a function of concentration index, . In this plot we find that the fraction of barred AGN galaxies with increases toward higher values, while the fraction of powerful unbarred AGN appear to remain almost constant with the morphological parameter. In addition, it can be appreciated that barred AGN galaxies show, on average, a higher fraction of powerful AGN, with respect to the control sample, but with a decrease of powerfully barred AGN for the lowest values of the parameter where both barred and unbarred AGN have similar fraction of .
Fig. 6c shows the fraction of barred AGN galaxies and of AGN in the control sample, with strong , as a function of the stellar age parameter (). From this figure we can see that the trend is consistent with the increase of the powerful AGN galaxy fraction with younger stellar population objects, for both, barred and unbarred AGN galaxies. Also, we can appreciate that the fraction of barred AGN galaxies with (solid line) is, for younger galaxies, higher than that of AGN hosts without bars (dashed lines). A similar trend is observed with respect to galaxy color (see Fig.6d) where the fraction of barred AGN galaxies with higher nuclear activity decreases toward redder colors while the fraction of powerful unbarred AGN remains constant for the whole () range.
With the aim of understanding the behavior of the nuclear activity in AGN galaxies with and without bars as a function of local density environments, we also measured the powerful AGN fraction with respect to the parameter. The results are shown in Fig. 6e where can be observed that the fraction of powerful AGN increases slightly toward denser regions. Moreover, it is important to notice the significant excess of barred AGN with high values with respect to the unbarred AGN, independently of the local environment density.
| Ranges | of barred AGN | of unbarred AGN |
|---|---|---|
| 10.7 | 43.5 | 36.6 |
| 10.7 | 35.5 | 22.9 |
| 2.5 | 35.1 | 31.5 |
| 2.5 | 51.8 | 34.4 |
| 1.8 | 24.8 | 22.5 |
| 1.8 | 66.3 | 51.1 |
| 0.75 | 36.3 | 29.1 |
| 0.75 | 42.3 | 35.9 |
| 0.0 | 44.3 | 32.6 |
| 0.0 | 40.1 | 32.8 |
4.1 Black Hole Mass and Accretion Rate
Moreover, it is interesting to further investigate the strength of AGN. For this aim, we estimated black holes masses, , for barred and unbarred AGN galaxies, by using the observed correlation between and the bulge velocity dispersion (Tremaine et al. 2002).
| (2) |
The relation is different for barred and unbarred galaxies, because the central velocity dispersion is enhanced by the stellar motion along a bar (Graham 2008). We adopted (, ) = (7.67 0.115, 4.08 0.751) for barred AGN galaxies and (, ) = (8.19 0.087, 4.21 0.446) for unbarred AGN. (Gültekin et al. 2009). We restricted this analysis to AGN galaxies with 70 km , because the instrumental resolution of SDSS spectra is 60 to 70 km .
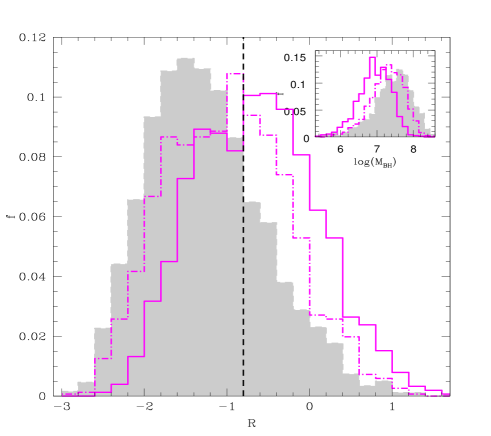
Furthermore, the ratio of [OIII] luminosity to black hole mass (=log(/)) provides a useful measure of the accretion rate onto a black hole (Heckman et al. 2004). The big panel in Fig.7 shows the distributions for barred (solid line) and unbarred AGN (full surface). It can be appreciated that barred AGN galaxies show an excess of high accretion rate values with respect to the control sample. With the purpose of checking the effect of bar in the active galactic nuclei in more detail, we also calculated the accretion rate for barred AGN using the same parameters, and , that we used to obtained and of the unbarred AGN in the control sample. It is represented by dot-dashed lines in Fig.7. Although, in this last case, the signal is less significant, also, barred AGN galaxies show an excess of accretion rate compared to the AGN without bars.
Besides, in the small box in Fig.7, we show the distributions of black holes masses, , for barred and unbarred AGN galaxies (solid line and full surface, respectively). It can be appreciated in this figure that there is a trend for to be systematically larger for unbarred AGN. As can be observed, the accretion rate and black hole mass distributions for barred and unbarred AGN calculated with the same parameters show a difference of lower statistical significance (K-S test with 99,95% and 98,8% confidence, respectively) than in the case when barred AGN black hole masses are calculated with the specific , parameters (K-S test with 100% confidence for both and distributions).
These results show that the excess of the accretion rate within a black holes in barred AGN galaxies with respect to unbarred AGN is a real effect, indicating that bars play an important role in the gas infall toward the central regions in active nuclei galaxies.
5 Summary and Conclusions
We have performed a statistical analysis of both, host characteristics and nuclear activity, of AGN galaxies with and without bars. Our study is based on the sample of AGN derived from the SDSS-DR7 release, using the publicly available emission-line fluxes. We have complemented the SDSS-DR7 data with the addition of a naked-eye detection of barred features of images of 6772 face-on AGN spiral galaxies brighter than mag16.5. With the aim of providing an appropriate quantification of the effects of bars, we constructed a suitable control sample of unbarred AGN galaxies, with the same redshift, band magnitude, concentration index, bulge size parameter and local environment distributions.
We can summarize the main results in the following conclusions.
(i) We found 1927 barred AGN, with respect to the full sample of 6772 spiral face-on AGN host galaxies, which represents a fraction of 28.5. This result agrees well with the bar fraction found by visual inspection of optical galaxy samples in previous works (e.g. Nilson (1973); Marinova et al. (2009); Masters et al. (2010); Oh, Oh & Yi (2012)) but is lower than that found using imagen descomposition technique (Gadotti 2009) and near-infrared analisys images (Menéndez-Delmestre et al. 2007). We also cross-correlated our sample with barred AGN galaxies taken from the catalog of Nair & Abraham (2010), and we found that the visual classification of both catalogs is in very good agreement.
(ii) We examined the color distribution of barred and unbarred AGN galaxies, and we found that there is an important excess of barred AGN hosts with red colors. The distribution of stellar population of barred AGN sample shows an excess of young galaxies, with respect to the control sample. Redder colors and younger stellar populations found in barred AGN galaxies suggest that bar perturbations are an important effect in modifying galaxy properties in the hosts of AGN, producing a significant star formation activity and a stirring of dust in the central regions.
(iii) We also studied the fraction of galaxies with red colors and young stellar population as a function of , concentration index and local density parameter, in barred AGN galaxies and in the control sample. We found that the number of red/young host galaxies increases/decreases with higher values of stellar mass, concentration parameter and local environment. It can be also seen that barred AGN galaxies show a higher fractions, with respect to their counterpart of unbarred AGN in the control sample.
(iv) We found that barred AGN galaxies show an excess of higher nuclear activity, with respect to AGN without bars in the control sample. In addition, we find that this tendency is more significant in less massive, more concentration light, younger stellar population and bluer AGN host galaxies.
(v) We also explored the fraction of powerful AGN (with ) as a function of the host galaxy properties. We find that the fraction of AGN galaxies with increase toward more massive host, higher C values, bluer colors, younger stellar population objects and denser environments. We also found that barred AGN objects systematically show a higher fraction of powerful AGN with respect to the control sample, in bins of different galaxy properties.
We also analyzed the accretion rate onto a black hole for barred and unbarred AGN galaxies. From this study we concluded that barred AGN have an excess of objects with high accretion rate values with respect to the control sample. This result suggests that gas rich galaxies are more efficient in accretion material toward the central region and also imply that bars can help in the fueling of material onto central black hole.
Acknowledgements.
This work was partially supported by the Consejo Nacional de Investigaciones Científicas y Técnicas and the Secretaría de Ciencia y Técnica de la Universidad Nacional de San Juan. Funding for the SDSS has been provided by the Alfred P. Sloan Foundation, the Participating Institutions, the National Science Foundation, the U.S. Department of Energy, the National Aeronautics and Space Administration, the Japanese Monbukagakusho, the Max Planck Society, and the Higher Education Funding Council for England. The SDSS Web Site is http://www.sdss.org/. The SDSS is managed by the Astrophysical Research Consortium for the Participating Institutions. The participating institutions are the American Museum of Natural History, Astrophysical Institute Potsdam, University of Basel, University of Cambridge, Case Western Reserve University, University of Chicago, Drexel University, Fermilab, the Institute for Advanced Study, the Japan Participation Group, Johns Hopkins University, the Joint Institute for Nuclear Astrophysics, the Kavli Institute for Particle Astrophysics and Cosmology, the Korean Scientist Group, the Chinese Academy of Sciences (LAMOST), Los Alamos National Laboratory, the Max-Planck-Institute for Astronomy (MPIA), the Max-Planck-Institute for Astrophysics (MPA), New Mexico State University, Ohio State University, University of Pittsburgh, University of Portsmouth, Princeton University, the United States Naval Observatory, and the University of Washington.References
- Abazajian et al. (2009) Abazajian K. N., Adelman-McCarthy J. K., Agüeros M. A., Allam S. S., Allende Prieto C., An D., Anderson K. S. J., Anderson S. F., et al. , 2009, ApJS, 182, 543.
- Alonso et al. (2007) Alonso M.S., Lambas D.G., Tissera P. B. & Coldwell G., 2007, MNRAS, 375, 1017.
- Athanassoula (1983) Athanassoula E. 1983, IAU Symp., 100, 243.
- Athanassoula et al. (2005) Athanassoula E., Lambert J. & Dehnen W., 2005, MNRAS, 363, 496.
- Baldwin, Phillips & Terlevich (BPT, 1981) Baldwin J. A., Phillips M. M. & Terlevich R., 1981, PASP, 93, 5.
- Balogh et al. (1999) Balogh M., Morris, S. L., Yee, H. K. C., Carlberg, R. G., Ellingson, E., 1999, ApJ, 527, 54.
- Balogh et al. (2004) Balogh M., Baldry I. K., Nichol R., Miller C., Bower R., Glazebrook K., 2004, ApJLetters, 615, 101.
- Balzano (1983) Balzano V.A., 1983, ApJ, 268, 602.
- Barrow, Bhavsar & Sonoda (1984) Barrow J.D., Bhavsar S.P. & Sonoda B.H. 1984, MNRAS, 210, 19p.
- Begelman, Blandford & Rees (1980) Begelman M. C., Blandford R. D. & Rees M. J., 1980, Nature, 287, 307.
- Berentzen et al. (2004) Berentzen I., Athanassoula E., Heller C. H. & Fricke K. J., 2004, MNRAS, 347, 220.
- Bernardi et al. (2010) Bernardi M., Shankar F., Hyde J. B., Mei S., Marulli F., Sheth R. K., 2010, MNRAS, 404, 2087.
- Blanton et al. (2005) Blanton M. Rr, Eisenstein D., Hogg D.W., Schlegel D.J. & Brinkmann J. 2005, ApJ., 629,143.
- Bournaud, Combes & Semelin (2005) Bournaud F., Combes F. & Semelin B., 2005, MNRAS, 364, 18.
- Bournaud & Combes (2002) Bournaud F. & Combes F., 2002, A&A, 392, 83.
- Brinchmann et al. (2004) Brinchmann J., Charlot S, White S.D.M., Tremonti C., Kauffmann G., Heckman T. & Brinkmann J., 2004, MNRAS, 351, 1151.
- Buta & Combes (1996) Buta, R., & Combes, F. 1996, Fund. Cosm. Phys., 17, 95.
- Calzetti et al. (2000) Calzetti D., Armus L., Bohlin R.C., Kinney A.L., Koornneef J. & Storchi-Bergmann T., 2000, ApJ, 533, 682.
- Coelho & Gadotti (2011) Coelho P. & Gadotti D. A., 2011, AJ, 743, L13.
- Combes et al. (1993) Combes F., Elmegreen B. G., 1993, A&A, 271, 391.
- de Vaucouleurs et al. (1991) de Vaucouleurs G., de Vaucouleurs A., Corwin H. G., Jr., Buta R. J., Paturel G., Fouque P., 1991, Third e Reference Catalogue of Bright Galaxies, Springer, New York, NY (USA).
- Devereux (1987) Devereux N.A., ApJ, 1987, 323, 91.
- Di Matteo, Springel & Hernquist (2005) Di Matteo T., Springel V. & Hernquist L., 2005, Nature, 433, 604.
- Eisenstein et al. (2001) Eisenstein D. J., Annis J., Gunn J. E., Szalay A. S., Connolly A. J., Nichol R. C., Bahcall N. A., Bernardi M., et al. , 2001, AJ, 122, 226.
- Ellison et al. (2011) Ellison S.L., Nair P., Patton D.R., Scudder J.M., Mendel J.T. & Simard L., 2011, MNRAS, 416, 2182.
- Elmegreen et al. (1990) Elmegreen D. M., Elmegreen B. G., & Bellin A. D. 1990, ApJ, 364, 415.
- Emsellem et al. (2001) Emsellem E., Greusard D., Combes F., Friedli D., Leon S., Pécontal E. & Wozniak H., 2001, A&A, 368, 52.
- Erwin (2004) Erwin P., 2004, A&A, 415, 941.
- Gadotti & dos Anjos (2001) Gadotti, D. A., & dos Anjos, S. 2001, AJ, 122, 1298.
- Gadotti (2009) Gadotti D.A., 2009, MNRAS, 393, 1531.
- Graham (2008) Graham A. W., 2008, AJ, 680, 143.
- Gültekin et al. (2009) Gültekin, K., et al. , 2009, ApJ, 706, 404.
- Gunn et al. (2006) Gunn J. E., Siegmund W. A., Mannery E. J., Owen R. E., Hull C. L., Leger R. F., Carey L. N., Knapp G. R., et al. , 2006, AJ, 133, 2332.
- Heckman et al. (2004) Heckman T. M., Kauffmann G., Brinchmann J., Charlot S., Tremonti C., White S. D. M., 2004, ApJ, 613, 109.
- Heckman et al. (2005) Heckman T. M., Ptak A., Hornschemeier A., Kauffmann G., 2005, ApJ, 634, 161.
- Hernquist & Mihos (1995) Hernquist L. & Mihos J. C., 1995, ApJ, 448, 41.
- Ho, Filippenko & Sargent (1997) Ho L.C., Filippenko A.V & Sargent W.L.W., 1997, ApJ, 487, 591.
- Kauffmann et al. (2003) Kauffmann G., Heckman T. M., Tremonti C. et al. , 2003, MNRAS, 346, 1055.
- Kewley et al. (2001) Kewley L.J., Dopita M.A., Sutherland R.S., Heisler C.A. & Travena J., 2001, ApJ, 556, 121.
- Kewley et al. (2006) Kewley L.J., Groves B., Kauffmann G. & Heckman T.M., 2006, MNRAS, 372, 961.
- Knapen (2005) Knapen J.H., 2005, A&A, 429, 141.
- Kuehn (2005) Kuehn F., Ryden B. S., 2005, ApJ, 634, 1032.
- Lake, Katz & Moore (1998) Lake G., Katz N. & Moore B., 1998, ApJ, 495, 152.
- Lee et al. (2012) Lee G., Woo J., Lee M.G., Hwang H.S., Lee J.C., Sohn J. & Lee J.H.,2012, ApJ, 750, 141.
- Lintott et al. (2011) Lintott et al. 2011, MNRAS, 410, 166.
- Lynden-Bell (1969) Lynden-Bell D., 1969, Nature, 223, 690.
- Marinova et al. (2009) Marinova, I., et al. , 2009, ApJ, 698, 1639.
- Martin (1995) Martin P., 1995, AJ, 109, 2428.
- Martin & Roy (1994) Martin P., & Roy J. R. 1994, ApJ, 424, 599.
- Martinez & Muriel (2011) Martinez H. J., & Muriel H., 2011, MNRAS, 418, 148.
- Masters et al. (2010) Masters K.L., et al. 2010, MNRAS, 411, 2026.
- Menéndez-Delmestre et al. (2007) Menéndez-Delmestre K., Sheth K., Schinnerer E., Jarrett T.H & Scoville N.Z., ApJ, 2007, 657, 790.
- Mendez-Abreu et al. (2010) Mendez-Abreu J., Sanchez-Janssen R., & Aguerri J. A. L. 2010, ApJL, 711, L61.
- Mihos et al. (1997) Mihos J. C., McGaugh S. S., & de Blok W. J. G. 1997, ApJL, 477, L79.
- Mulchaey et al. (1994) Mulchaey, J. S., et al. , 1994, ApJ, 436, 586.
- Nair & Abraham (2010) Nair P. B., & Abraham R. G. 2010a, ApJS, 186, 427.
- Nilson (1973) Nilson P. 1973, Acta Universitatis Upsaliensis. Nova Acta Regiae Societatis Scientiarum Upsaliensis - Upp- sala Astronomiska Observatoriums Annaler, Uppsala: Astronomiska Observatorium, 1973.
- Oh, Oh & Yi (2012) Oh S., Oh K. & Yi S. K., 2012, ApJS, 198, 40.
- Perez, Tissera & Blaizot (2009) Perez J., Tissera P. & Blaizot J., 2009, MNRAS, 397, 748.
- Rees (1984) Rees M.J., 1984, ARA&A, 22, 471.
- Roos (1981) Roos N., 1981, A&A, 104, 218.
- Roos (1985) Roos N., 1985, A&A, 294, 479.
- Sellwood & Wilkinson (1993) Sellwood J. A., & Wilkinson A., 1993, Rep. Prog. Phys., 56, 173.
- Shlosman, Begelman & Frank (1990) Shlosman I., Begelman M.C. & Frank J., 1990, Nature, 345, 679.
- Shlosman, Frank & Begelman (1989) Shlosman I., Frank J. & Begelman M.C., 1989, Nature, 338, 45.
- Skibba et al. (2012) Skibba R. A. et al. , 2012, MNRAS, 423, 1485.
- Springel, Di Matteo & Hernquist (2005) Springel V., Di Matteo T. & Hernquist L., 2005, MNRAS, 361, 776.
- Strauss et al. (2002) Strauss et al. 2002, AJ, 124, 1810.
- Tremonti et al. (2004) Tremonti C., Heckman T. M., Kauffmann, G. et al. , 2004, ApJ, 613, 898.
- van den Bergh (2002) van den Bergh, S. 2002, AJ, 124, 782.
- Walker et al. (1996) Walker, I. R., Mihos, J. C., Hernquist, L., Bolte, M., & Mendes de Oliveira, C. 1996, IAU Colloq. 157: Barred Galaxies, 91, 486.
- Whittle (1992) Whittle M., 1992, ApJS, 79, 49.
- Wyse (2004) Wyse R.F.G., 2004, ApJ, 612, 17.
- Xu et al. (1999) Xu C., Livio M., Baum S., 1999, AJ, 118, 1169.
- York et al. (2000) York D. G., Adelman J., Anderson J. E. Jr., Anderson S. F., Annis J., Bahcall N. A., Bakken J. A., Barkhouser R., et al. , 2000, AJ, 120, 1579.
- Zaritsky et al. (1994) Zaritsky D., Kennicutt R. C., & Huchra J. P. 1994, ApJ, 420, 87.