Numerical Modeling of Multiphase, Turbulent Galactic Disks with Star Formation Feedback
Abstract
Star formation is self-regulated by its feedback that drives turbulence and heats the gas. In equilibrium, the star formation rate (SFR) should be directly related to the total (thermal plus turbulent) midplane pressure and hence the total weight of the diffuse gas if energy balance and vertical dynamical equilibrium hold simultaneously. To investigate this quantitatively, we utilize numerical hydrodynamic simulations focused on outer-disk regions where diffuse atomic gas dominates. By analyzing gas properties at saturation, we obtain relationships between the turbulence driving and dissipation rates, heating and cooling rates, the total midplane pressure and the total weight of gas, and the SFR and the total midplane pressure. We find a nearly linear relationship between the SFR and the midplane pressure consistent with the theoretical prediction.
keywords:
stars: formation, ISM: kinematics and dynamics, methods: numerical, turbulenceStar formation feedback is a key ingredient to model the star formation rates (SFR) in galactic disks. The interstellar medium (ISM), the raw material for star formation, is highly dissipative so that within a timescale comparable to the dynamical timescales, such as the gravitational free-fall time and the vertical oscillation period, the thermal energy is radiated away, and the turbulent energy is dissipated by shocks and nonlinear cascades. Since the gas depletion time, the time required to convert all the gas into stars, is much longer than the dynamical timescales (e.g., [Krumholz et al. (2012)]), there must be continuous and efficient mechanisms for energy replenishment. Feedback from massive stars is the most probable source that provides a substantial amount of momentum via expanding supernova remnants and photoelectric heating by FUV radiation.
The turbulent and thermal pressures maintained by energy balance support galactic disks against the total weight of the gas under the gravity of gas, stars, and dark matter. In equilibrium, the SFR is thus self-regulated to supply the appropriate amount of thermal and turbulent energy that meets the needs of the ISM. Recently, [Ostriker et al. (2010)] and [Ostriker & Shetty (2011)] have developed an analytic theory for regulation of SFRs based on the equilibrium model, which successfully explains observed relationships among the SFR surface density, the total and molecular gas surface densities, and the stellar surface density.
To directly test the analytic theory quantitatively, we utilize a series of numerical hydrodynamic simulations that resolve vertical dynamics of the ISM and include self-gravity, cooling and heating, and star formation feedback (see also [Kim et al. (2011)]). In our models, star formation feedback is realized by time-dependent heating and by expanding supernova remnants. We focus on outer disk regions where the diffuse ISM dominates, with gas surface densities and star-plus-dark matter volume densities .
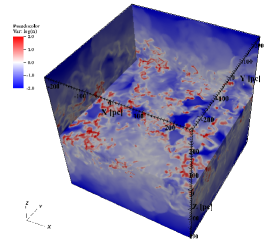
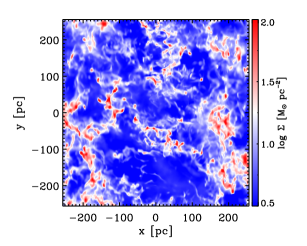
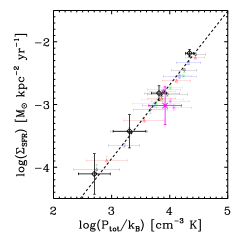
Our model disks undergo a quasi-periodic cycle of vertical oscillations: the disk expands vertically due to feedback, reducing the SFR, which in turn causes the disk to contract back, increasing the SFR and feedback. After one or two vertical oscillations of the disk, the overall physical properties are fully saturated. Figure 1 shows a morphology of the gas in the fiducial model with and at saturation in the left and middle panels; the ISM is multiphase, turbulent, and highly-structured, which is qualitatively similar to that seen in recent HI observations (see McClure-Griffith’s contribution in this volume). We directly measure for all models the midplane thermal () and turbulent () pressures as well as the SFR surface density () that are averaged over one orbital period corresponding typically to three or four vertical oscillations. The thermal and turbulent pressures are approximately linearly proportional to the SFR surface density as the equilibrium model predicts; , and . At the same time, the total (thermal plus turbulent) midplane pressure () is in excellent agreement with the dynamical equilibrium pressure, resulting in . Finally, the fundamental relationship between the SFR surface density and the total pressure naturally reflects the match between supply and demand of the ISM, (see the right panel of Figure 1).
Acknowledgements.
This work was made possible by the facilities of the Shared Hierarchical Academic Research Computing Network (SHARCNET:www.sharcnet.ca) and Compute/Calcul Canada. C.-G. K. is supported by a CITA National Fellowship.References
- [Kim et al. (2011)] Kim, C.-G., Kim, W.-T., & Ostriker, E. C. 2011, ApJ 743, 25
- [Krumholz et al. (2012)] Krumholz, M. R., Dekel, A., & McKee, C. F. 2012, ApJ 745, 69
- [Ostriker et al. (2010)] Ostriker, E. C., McKee, C. F., & Leroy, A. K. 2010, ApJ 721, 975
- [Ostriker & Shetty (2011)] Ostriker, E. C., & Shetty, R. 2011, ApJ 731, 41
- [Wolfire et al. (1995)] Wolfire, M. G., Hollenbach, D., McKee, C. F., Tielens, A. G. G. M., & Bakes, E. L. O. 1995 ApJ 443, 152