The Galactic R Coronae Borealis Stars and the Final He-shell Flash Object V4334 Sgr (Sakurai’s Object): A Comparison
Abstract:
The high resolution optical spectra of H-deficient stars, R Coronae Borealis stars and H-deficient carbon stars are analyzed by synthesizing the C2 Swan bands (0,1), (0,0), and (1,0) using our detailed line-list and Uppsala model atmosphere, to determine the C-abundances and the 12C/13C ratios which are potential clues to the formation process of these stars. The C-abundances derived from C2 bands are about the same for the adopted models constructed with different carbon abundances over the range 8.5 (C/He = 0.1%) to 10.5 (C/He = 10%). The carbon abundances derived from C i lines are a factor of four lower than that adopted for the model atmosphere over the same C/He interval, as reported by Asplund et al.: ‘the carbon problem’. In principle, the carbon abundances obtained from C2 Swan bands and that adopted for the model atmosphere can be equated for a particular choice of C/He that varies from star to star (unlike C i lines). Then, the carbon problem for C2 bands is eliminated. However, such C/He ratios are in general less than those of the extreme helium stars, the seemingly natural relatives to the RCB and HdC stars. The derived carbon abundances and the 12C/13C ratios are discussed in light of the double degenerate (DD) and the final flash (FF) scenarios. The carbon abundance and the 12C/13C ratios for the FF product, Sakurai’s Object is derived. The carbon abundance in the Sakurai’s object is 10 times higher than in the RCB star VZ Sgr. On an average, the carbon abundance in the Sakurai’s Object is about 10 to 100 times higher than in RCB stars. The 12C/13C ratio in Sakurai’s Object is 3.4, the equilibrium value, as expected for FF products.
1 Introduction
R Coronae Borealis (RCB) stars are F- and G-type supergiants having photometric and spectroscopic peculiarities. The photometric peculiarity is that, they exhibit visible light variability upto several magnitudes at unpredictable times, and, the spectroscopic peculiarities are that, they are H-deficient having very weak H-Balmer lines in their spectra than expected for their spectral class and are rich in carbon. The other two groups of H-deficient stars that seem to be close relatives of RCB stars are Extreme Helium (EHe) stars that are warmer and H-deficient Carbon (HdC) stars that are cooler than RCB stars. The EHe and HdC stars do not show photometric variability. The origin and evolution of these stars is not well understood because of their chemical peculiarity and rare occurrence. There are two scenarios in contention, they are, the Double Degenerate (DD) Scenario and the Final Flash (FF) Scenario. The DD-scenario involves a merger of a helium white dwarf with a carbon - oxygen (C - O) white dwarf (Webbink 1984; Iben & Tutukov 1985). The close white dwarf binary resulting from a pair of main-sequence stars, merge due to the loss of angular momentum by gravitational wave radiation (Renzini 1979), and the merger is inflated to a supergiant dimension. The FF scenario involves a single post-Asymptotic Giant Branch (AGB) star, experiencing a final He-shell flash. In investigating the origin and evolution of these stars, the determination and interpretation of surface chemical composition plays the key role. The chemical composition of RCB and HdC stars determined by Asplund et al. (2000) suggested the DD scenario as their origin rather than the FF scenario. The discovery of high value of 18O/16O ratios in cool RCB and HdC stars determined from CO infrared bands (Clayton et al. 2005, 2007; García-Hernández et al. 2009, 2010), and the high fluorine abundances in RCB stars (Pandey et al. 2008) provided the evidences for the DD scenario as the origin of RCB/HdC stars. Further potential clues for the origin of these stars can be the carbon abundances (log (C)111Normalized such that log = 12.15, where is the atomic weight of element i.) and the 12C/13C ratios. Because, the low carbon abundances and the high 12C/13C ratios are expected for the DD scenario and vice-versa for the FF scenario. For RCB/HdC stars, the carbon abundances derived from C i lines are a factor of four lower than that adopted for the model atmospheres constructed with different C/He ratios. That is, the predicted strengths of C i lines are much stronger than the observed. This has been dubbed as the ‘carbon-problem’ by Asplund et al. (2000). To further explore the ‘carbon problem’, we have derived the carbon abundances using the C2 Swan bands in RCB/HdC stars including the final He-shell flash object V4334 Sgr (Sakurai’s Object). The 12C/13C ratios were also determined for these stars.
| Star | C from (0,1) band | C from (0,0) band | C from C i lines | ||
|---|---|---|---|---|---|
| C/He = 0.3% | C/He = 1% | C/He = 3% | C/He = 1% | C/He = 1% | |
| log (C) = 9.0 | log (C) = 9.5 | log (C) = 10.0 | log (C) = 9.5 | log (C) = 9.5 | |
| VZ Sgr | 9.0 | 8.9 | 8.8 | 8.8 | 8.9 |
| UX Ant | 8.4 | 8.3 | 8.2 | 8.1 | 8.7 |
| RS Tel | 8.4 | 8.3 | 8.3 | 8.3 | 8.7 |
| R CrB | 9.0 | 8.8 | 8.8 | 8.6 | 8.9 |
| V2552 Oph | 8.3 | 8.1 | 8.2 | 8.1 | 8.7 |
| V854 Cen | 8.4 | 8.3 | 8.3 | 8.3 | 8.8 |
| V482 Cyg | 8.4 | 8.3 | 8.3 | 8.1 | 8.9 |
| SU Tau | 8.1 | 8.0 | 8.0 | 7.8 | 8.6 |
| V CrA | 8.5 | 8.4 | 8.3 | 8.2 | 8.6 |
| GU Sgr | 8.2 | 8.1 | 8.1 | 8.1 | 8.9 |
| FH Sct | 7.8 | 7.7 | 7.7 | 7.8 | 8.9 |
| V4334 Sgr1 | 9.8 | 9.7 | 9.7 | 9.6 | 9.8 |
1 FF Object
2 Observations
The high resolution optical spectra were obtained from McDonald Observatory and the Vainu Bappu Observatory. The spectra from McDonald Observatory were obtained with the 2.7 m Harlan J. Smith telescope and Tull coude cross-dispersed echelle spectrograph (Tull et al. 1995). at a resolving power of /d = 60,000. The spectra from the Vainu Bappu Observatory were obtained with the 2.34 m Vainu Bappu Telescope equipped with the fibre-fed cross-dispersed echelle spectrometer (Rao et al. 2005) and a 4K4K CCD are at a resolving power of about 30,000.
3 Analysis
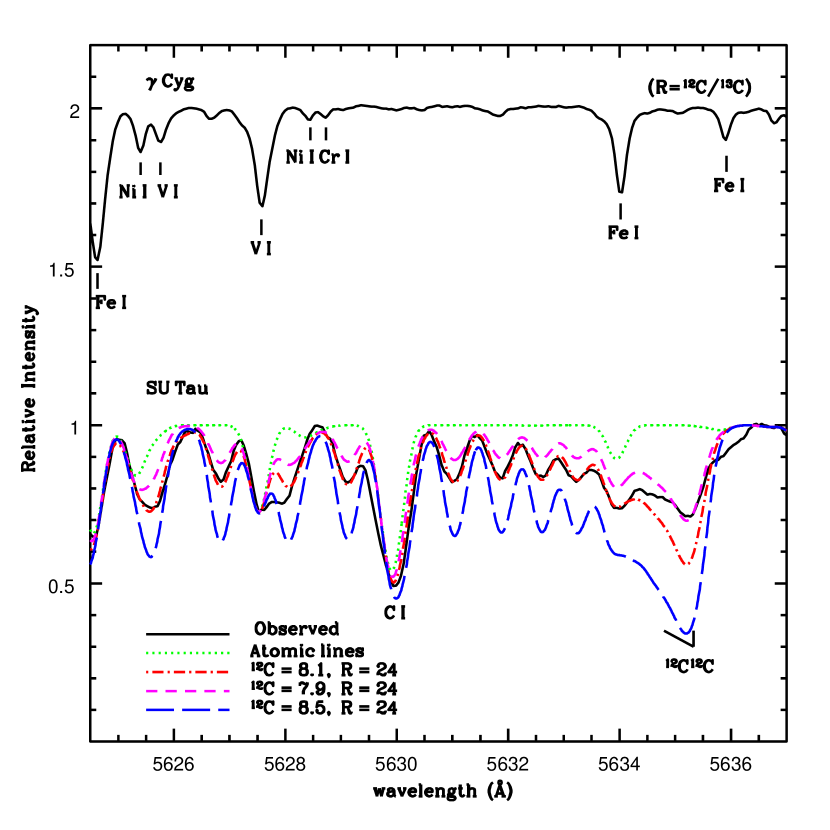
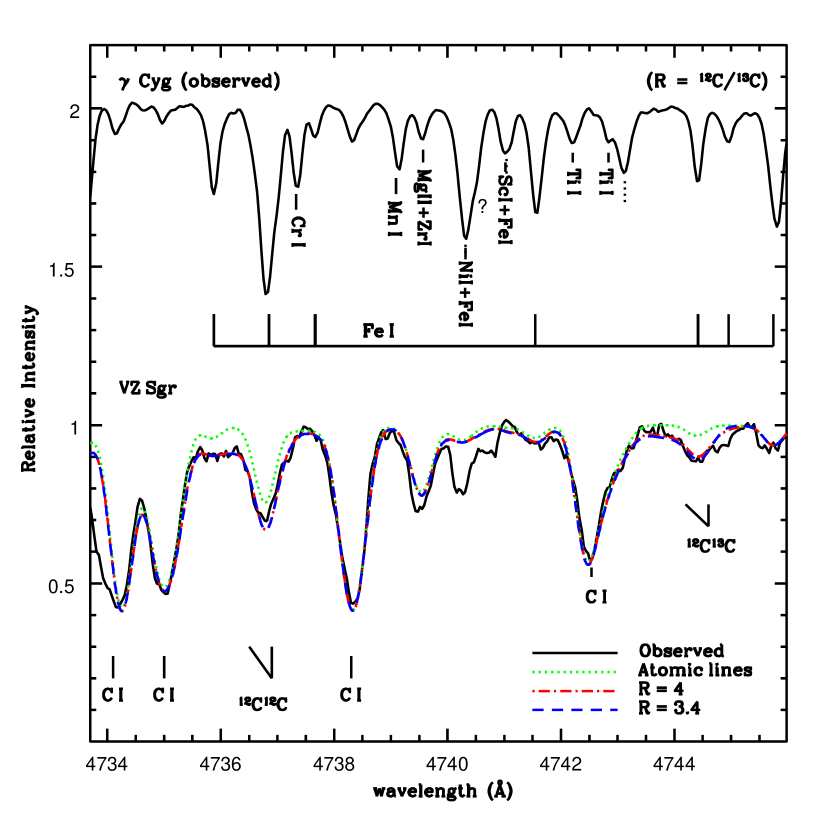
The C2 Swan bands, = +1, 0, and -1 are analyzed for the RCB and HdC stars which are having effective temperatures 7000K, as these bands are undetectable in warmer stars. The (0,0) and (0,1) 12C2 bands are used for the determination of the C abundances. The (0,1) 12C2 band is the best region for the determination of carbon abundance, since it is less blended by the atomic lines and the 12C2 band is free of contamination by the 12C13C band, as they are separated by 8Å and the 12C13C band is to the blue of the blue degraded 12C2 band. For deriving the 12C/13C ratio, the (1,0) C2 band is used. Because, the (1,0) 12C13C band is about 8Å to the red of the blue degraded (1,0) 12C12C band, the 12C13C band is free of contamination by the 12C12C band. These C2 bands are synthesized using our newly constructed C2 molecular line list and including the blending atomic lines for all the three regions. The C2 molecular line-list was constructed using accurate wavelengths given by Phillips & Davis (1968) and excitation potentials were calculated using the molecular constants given by them. The shifts in wavelengths between 12C12C and 12C13C lines were calculated using standard formulae for the vibrational and rotational shifts for C2 lines (Herzberg & Phillips 1948; Stawikowski & Greenstein 1964; Russo et al. 2011). The gf-values were calculated from the theoretical band oscillator strengths given by Schmidt & Bacskay (2007). The basic data for the atomic lines were taken from NIST and Kurucz line list and the gf-values were rederived from the spectra of Arcturus (giant), Cyg (supergiant) and Sun (dwarf) and they are in good agreement. For most lines the gf-values adopted are those derived from Cyg spectrum, since, Cyg has the effective temperature and the surface gravity that is similar to our program stars. Using the Uppsala line blanketed H-deficient model atmospheres (Asplund et al. 1997a), and the line lists discussed above, the C2 molecular bands were synthesized. The synthesized spectrum was convolved with the Gaussian profile with a width that represents effects of stellar macroturbulence and instrumental profile, and then matched with the observed spectrum.
4 Results and Discussions
4.1 The carbon abundance from C2 bands and the carbon problem
The carbon abundance derived from all the three C2 bands are in good agreement. The carbon abundances derived from C2 Swan bands is about the same for the adopted models constructed with different carbon abundances over the range 8.5 (C/He = 0.1%) to 10.5 (C/He = 10%) and is different from the carbon abundances derived from C i lines. The syntheses of the C2 bands for determining the carbon abundance are shown in figures 1 and 2. The derived carbon abundances for RCB stars are given in Table 1. The carbon abundances derived from C2 Swan bands, for the RCB and HdC sample are about 10 times lower than their close relatives, the EHe stars. This mismatch, if not a reflection of different modes of formation, implies that the C abundances for RCB and HdC stars are subject to a systematic error. Nonetheless, that the carbon abundances derived from C2 Swan bands are the real measure of the carbon abundances in RCB and HdC stars cannot be ruled out.
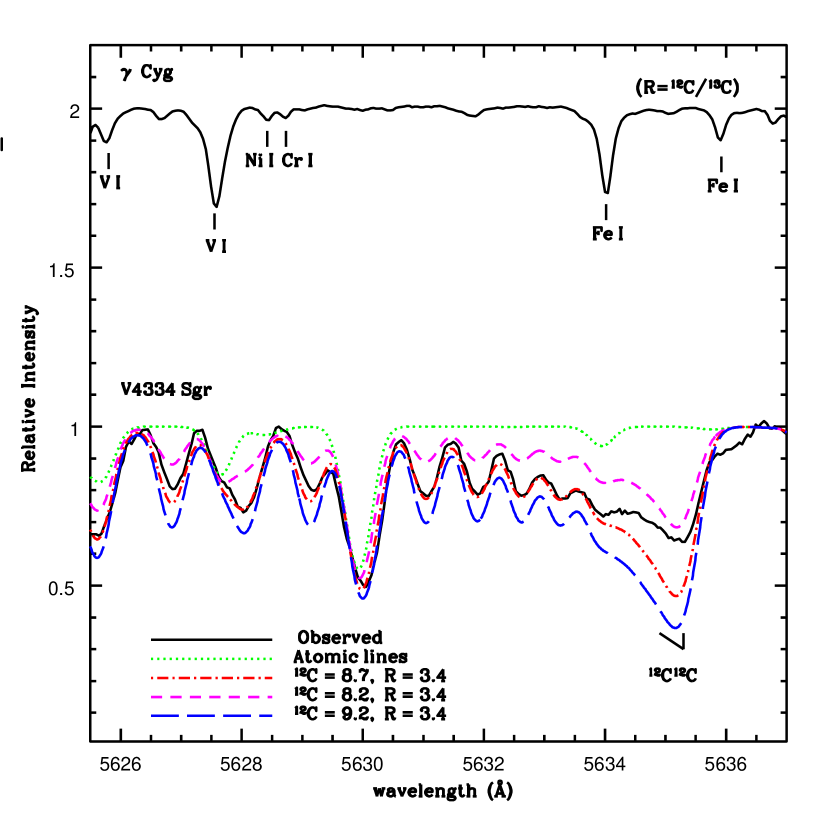
4.1.1 Determination of carbon abundance in FF product: V4334 Sgr (Sakurai’s Object)
The spectrum of Sakurai’s Object obtained from McDonald observatory on 7th October 1996 is used for our analysis. The signal-to-noise per pixel calculated in the 4736Å region is about 140. For the same spectrum, the stellar parameters were determined by Asplund et al. (1997b). These stellar parameters are adopted for our analysis, and they are, the effective temperature = 6900300 K, the surface gravity log g = 0.50.3 (cgs units), and the microturbulence = 6.51 km s-1. The RCB star, VZ Sgr and Sakurai’s Object are having the near same stellar parameters. A relative analysis of these two stars is done to derive the carbon abundance in Sakurai’s Object. The carbon abundance is derived as discussed in Section 3 and 4.1 (also see Hema et al. 2012). The carbon abundance in Sakurai’s Object is about 0.8 dex higher than in VZ Sgr. The carbon abundance of VZ Sgr is 8.9. As it is expected, the carbon abundance in the FF product Sakurai’s Object is higher than the carbon abundance in the RCB stars (see Table 1). As an example, the synthesis for Sakurai’s Object for deriving the carbon abundance is shown in Figure 2.
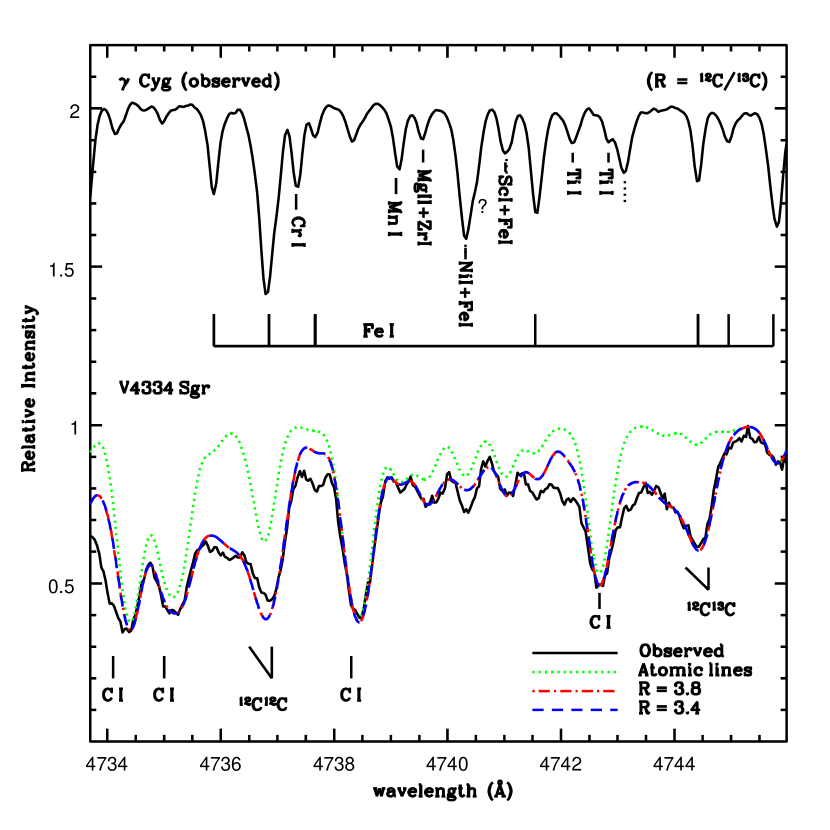
4.2 The 12C/13C ratios
The majority RCB stars and HdC stars are having high values of 12C/13C ratios and are consistent with simple predictions for a cold merger of a He white dwarf with a C-O white dwarf. In DD scenario the carbon abundance is mainly the triple -processed material 12C, hence we expect high values of 12C/13C ratios. The minority RCB stars, which are metal poor and have high [Si/Fe] and [S/Fe] ratios, relative to majority RCBs: VZ Sgr and V CrA, are having low values of 12C/13C ratios (see Figure 3). The low value of 12C/13C ratio is expected for FF scenario, because, with the injection of the surface protons into the 12C rich layer, 13C is synthesized . Yet, due to their distinctive elemental abundances, and the low 12C/13C ratios compared to majority RCB stars, the origin and evolution of minority RCB stars – VZ Sgr and V CrA remain unexplained. The 12C/13C ratio for Sakurai’s Object is derived using the (1,0) C2 band. The 12C/13C ratio is about 3.4, the equilibrium value, as expected for the FF product (see Figure 4).
References
- [1] Asplund, M., Gustafsson, B., Lambert, D. L., & Rao, N. K., 2000, A&A, 353, 287
- [2] Asplund, M., Gustafsson, B., Kiselman, D., & Eriksson, K. 1997a, A&A, 318, 521
- [3] Asplund, M., Gustafsson, B., Kiselman, D., & Eriksson, K. 1997b, A&A, 321, 17
- [4] Clayton, G. C., Geballe, T. R., Herwig, F., Fryer, C., & Asplund, M. 2007, ApJ, 662, 1220
- [5] Clayton, G. C., Herwig, F., & Geballe, T. R., et al. 2005, ApJ, 623, L141
- [6] García-Hernández, D. A., Hinkle, K. H., Lambert, D. L., & Eriksson, K. 2009, ApJ, 696, 1733
- [7] García-Hernández, D. A., Lambert, D. L., Kameswara Rao, N., Hinkle, K. H., & Eriksson, K. 2010, ApJ, 714, 144
- [8] Hema, B. P., Pandey, G., and Lambert, D. L. 2012, ApJ, 747, 102
- [9] Herzberg, G., & Phillips, J. G. 1948, ApJ, 108, 163
- [10] Iben, I., Jr., & Tutukov, A. V. 1985, ApJS, 58, 661
- [11] Pandey, G., Lambert, D. L., & Rao, N. K. 2008, ApJ, 674, 1068
- [12] Phillips, J. G., & Davis, S. P. (ed.) 1968, The Swan System of the C2 Molecule. The Spectrum of the HgH Molecule (Berkeley, CA: Univ. California Press)
- [13] Rao, N. K., Sriram, S., Jayakumar, K., & Gabriel, F. 2005, J. Astrophys. Astron., 26, 331
- [14] Renzini, A. 1979, in Stars and Star Systems, ed. B. E. Westerlund (Astrophysics and Space Science Library, Vol. 75; Dordrecht: Reidel), 155
- [15] Russo, R. E., Bol’Shakov, A. A., Mao, X., et al. 2011, Spectrochim. Acta, 66, 99
- [16] Schmidt, T. W., & Bacskay, G. B. 2007, J. Chem. Phys., 127, 234310
- [17] Stawikowski, A., & Greenstein, J. L. 1964, ApJ, 140, 1280
- [18] Tull, R. G., MacQueen, P. J., Sneden, C., & Lambert, D. L. 1995, PASP, 107, 251
- [19] Webbink, R. F. 1984, ApJ, 277, 355