eurm10 \checkfontmsam10 \pagerange119–126
Compressible Air Entrapment in High-Speed Drop Impacts on Solid Surfaces
Abstract
Using high-speed photography coupled with optical interference, we experimentally study the air entrapment during a liquid drop impacting a solid substrate. We observe the formation of a compressed air film before the liquid touches the substrate, with internal pressure considerably higher than the atmospheric value. The degree of compression highly depends on the impact velocity, as explained by balancing the liquid deceleration with the large pressure of compressed air. After contact, the air film expands vertically at the edge, reducing its pressure within a few tens of microseconds and producing a thick rim on the perimeter. This thick-rimmed air film subsequently contracts into an air bubble, governed by the complex interaction between surface tension, inertia and viscous drag. Such a process is universally observed for impacts above a few centimeters high.
1 Introduction
The impacts of liquid drops onto solid substrates are ubiquitous and appear in a variety of applications, such as spray coating and ice accumulation on aircraft (Yarin, 2006). While the interaction between liquid and solid has been extensively studied, the important role of air is discovered only recently, as shown by the surprising finding that air pressure strongly influences the liquid splash outcomes (Xu et al., 2005; Xu, 2007). Therefore, understanding the behavior of air during liquid-solid impacts will bring new advancement to this fundamental phenomenon, and may benefit practical processes such as splash control and surface coating. Experimentally, entrapment of air during impacts is commonly observed: when the impact speed is high (), a thin air film is trapped at the very beginning, which subsequently contracts into one or two air bubbles (Thoroddsen et al., 2003, 2005). At low impact speed (), however, the air under the drop remains connected with outside for the majority of time (i.e., not entirely trapped), until it gets enclosed by the moving contact line (de Ruiter et al., 2012). Recent study (Kolinski et al., 2012) further reveals a short-lived nanometer thick air film right before the formation of contact line. The air entrapment depends on the impact velocity, the liquid property (Thoroddsen et al., 2003, 2005; de Ruiter et al., 2012; Kolinski et al., 2012) and the surrounding air pressure (Driscoll & Nagel, 2011). Theoretically, simulations have explored air entrapment with both compressible (Mandre et al., 2009; Mani et al., 2010) and incompressible (Smith et al., 2003; Hicks & Purvis, 2010) models. Marked deformation of drop surface before it touches the solid is predicted: the drop surface is deformed upward at the impact center, making the first contact away from the center on a ring-like area. Compressible model by Mandre et al. (2009) and Mani et al. (2010) further indicates significant compression in the trapped air, resulting in a pressure considerably higher than the atmospheric value. Despite these important predictions, however, experimental measurement on the exact condition of trapped air is still missing, especially near the critical moment of impact. In particular, even the fundamental question whether the trapped air is compressed or not remains unclearly. To clarify these puzzles and better understand the impact phenomenon, experimental study on air entrapment close to the moment of impact is highly desirable.
2 Experimental methods
Using fast photography coupled with optical interference (Driscoll & Nagel, 2011; de Ruiter et al., 2012), we experimentally study the air entrapment during a liquid drop impacting a smooth substrate at relatively high speeds (). We observe the formation of a compressed air film before the liquid touches the substrate, with internal pressure considerably higher than the atmospheric value. The degree of compression highly depends on the impact velocity, which is explained by balancing the liquid deceleration with the large pressure of compressed air. After contact, the air film expands vertically at the edge, reducing its pressure within a few tens of microseconds and producing a thick rim on the perimeter. This thick-rimmed air film subsequently contracts into an air bubble, governed by the complex interaction between surface tension, inertia and viscous effects (see Fig.5(a) for the entire process). Such a process is universally observed for impacts above a few centimeters high.
To independently study the effects of viscosity and surface tension, three different liquids are used: , oil-1.04 and oil-9.30. The two oils are silicone oils with similar surface tensions but different dynamic viscosities: and . By contrast, and oil-1.04 have similar viscosities but different surface tensions (see table 1). Reproducible drops around millimeter in size (see table 1 for details) are released from rest at different heights, and impact a smooth and dry cover glass at various velocities (). The two silicon oils completely wet the glass substrate with zero static contact angle, and has the static contact angle . All experiments are performed at the atmospheric pressure, . The impacts are viewed from below with an inverted microscope and recorded with a high-speed camera (Photron SA4) at recording speeds up to 150,000 frames per second. The illumination light is monochromatic, with the wavelength and coherence length a few microns. The short coherence length makes sure that there is no interference between the two sides of the substrate. The Newton’s rings produced by the trapped air can quantitatively characterize the thickness profile of air.
| liquid | (degree) | R(mm) | |||
|---|---|---|---|---|---|
| 1000 | () | ||||
| oil-1.04 | 816 | 17.4 | () | ||
| oil-9.30 | 930 | 20.1 |
3 Experimental results
3.1 Formation of air film before contact ()
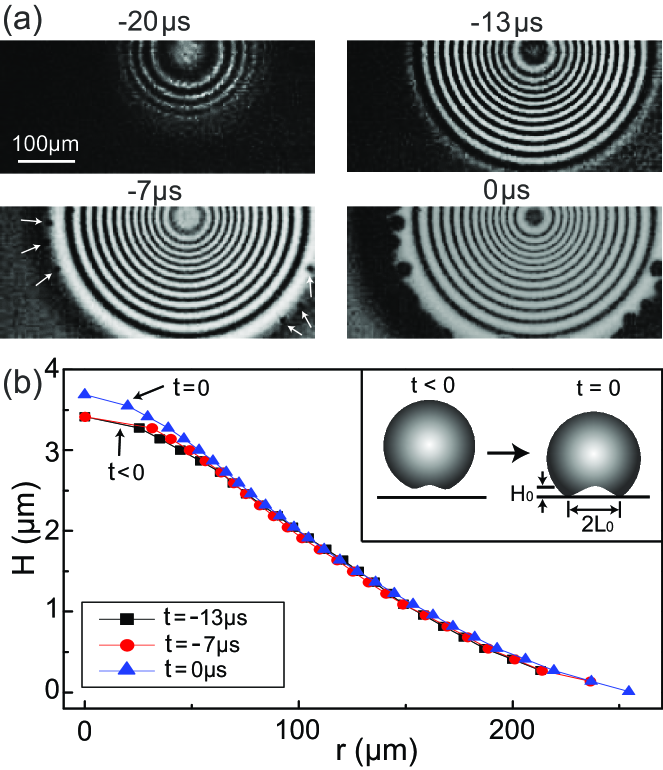
We first clarify the entrapment behavior before liquid touches solid. As the drop approaches the substrate, the air in the thin gap can not escape immediately and gets compressed to a high pressure (exact values measured later in Fig.4(b)). Such a high pressure locally pushes in the drop surface and creates a dimple around impact center, as illustrated by the cartoon in Fig.1(b) inset. The interference patterns from the dimple are shown in Fig.1(a), for an oil-9.30 drop at the impact speed . In the first frame (), Newton’s rings appear as the drop-to-substrate distance becomes smaller than the coherence length of light (a few microns). In the second frame (), a quite flat dimple with the horizontal scale several hundred microns but the vertical scale a few microns is produced. Because of this thin and flat nature, the dimple can be exactly considered as an air film. The third frame () shows a very similar pattern as the second one, except with a few black spots of isolated contacts indicated by the white arrows. The fourth frame () reveals the global liquid-solid contact on a thick black ring at the edge of the pattern. This moment of first global contact is also defined as the moment of throughout our study.
The thickness of the dimple, , can be accurately derived from the pattern with the relationship between two neighboring rings. Using contact area as the zero-thickness reference point, we can quantitatively determine the entire thickness profile of the trapped air in the frame. We can further determine the profiles for the two previous frames ( and ), due to their highly similar patterns as the frame, which enables the tracking of every ring. The thickness as a function of distance from the center, versus , is plotted in Fig.1(b): before the contact, an air film with the lateral size but a thickness of only forms, which maintains an almost identical profile through the next several frames. Significant variation only appears near the center (), where the interface moves upward instead of downward, with a small speed (calculated from the profiles at and ). Clearly, the motion of the drop is quite complex immediately before the contact: while the main body falls at the impact speed, ; the small volume above the trapped air () stays almost stationary, with the region at even moving oppositely in upward direction.
3.2 Profile of air film upon contact ()
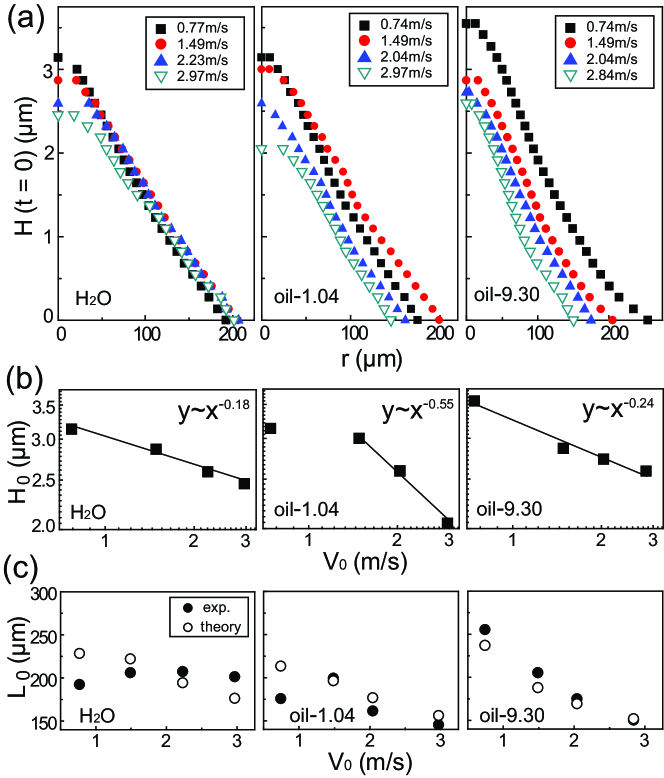
To systematically study the air film properties, we characterize their profiles at for different velocities and liquids, as shown in Fig.2(a). The three panels correspond to the three different liquids and each panel contains data for several impact velocities. In general, air film becomes thinner with the increase of impact velocity, as illustrated by the measurements. For quantitative understanding, we plot the maximum thickness measured at , , as a function of in Fig.2(b). Clearly decreases with , consistent with the previous theory (Mandre et al. (2009)). However, the exact dependence of on differs from the prediction: we calculate the “compressible factor” defined theoretically as (Mandre et al. (2009), is the dynamic viscosity of air), and obtain the range 0.1–10 for our experimental data. Thus our experiments are at the transition region from “incompressible regime” to “compressible regime” predicted by the theory, and should decrease with faster than the power law of . However the log-log plots in Fig.2(b) find powers much slower than -2/3. This discrepancy calls for further theoretical studies on the problem.
We also measure the horizontal radius, , versus for different liquids and compare it with the existing theory (Hicks et al. (2012)). In Fig.2(c), we plot our measurements as solid symbols and the theoretical prediction, (Hicks et al. (2012)), as the open symbols. We use the bottom radius of curvature right before contact shown in Table 1 for the calculation. Without any fitting parameter, a reasonable agreement is observed at high while some deviation occurs for low . This is surprising since the theory is based on an incompressible calculation, which should match our low rather than the high region. Further study is required to clarify this puzzle.
3.3 Evolution of air film after contact ()
The dimple continues to evolve after the liquid-solid contact. The interference patterns for are shown in Fig.3(a), for an impact with the same condition as in Fig.1(a). Frame one () shows the Newton’s rings from the initial thin film, with the global contact on a thick black ring at the edge. During the subsequent contraction (), the Newton’s rings in the middle remain largely unchanged, while a grey region without rings grows thicker and thicker at the edge. This grey region smoothly evolves into an air bubble at the end of the process (319 and 2486). Such a smooth evolution implies that the thickness of grey region at must be close to the bubble diameter () and substantially exceed the coherence length of light, which explains the lack of Newton’s rings. Similarly, having a thickness larger than the coherence length explains the absence of rings in the grey region for previous frames as well. To estimate the thickness there, we assume that the grey region has a half-circular vertical cross section, as demonstrated by the dashed curves in Fig.3(b) (the non-circular impression comes from the different x and y scales).
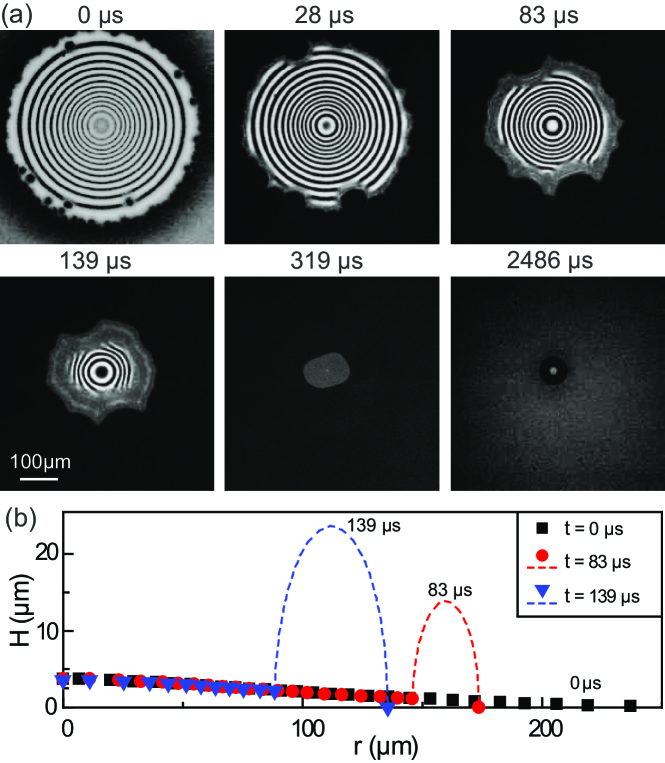
Combining the thickness measured from the Newton’s rings and estimated at the grey region, we plot the entire thickness profiles for the frames in Fig.3(b). Different colors indicate different time , with the solid symbols from direct measurement and the dashed curves from the half-circular estimate. Clearly the air film does not contract with a uniform thickness; instead the edge grows into a thick rim while the interior remains thin and flat.
3.4 The compression at
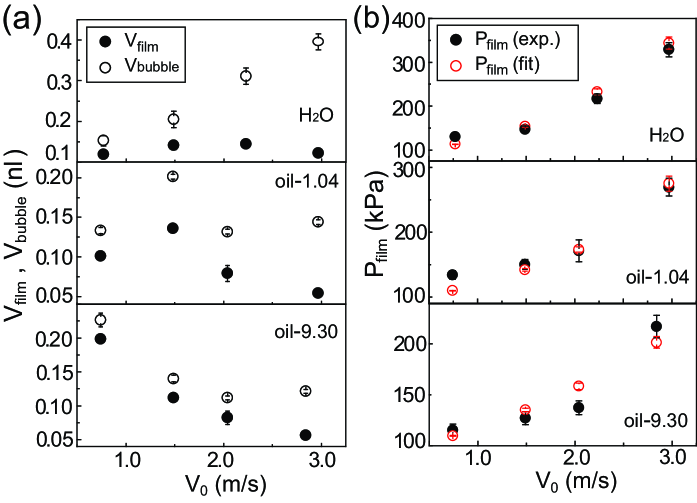
Is the trapped air initially () compressed or not? We address this fundamental question by accurately measuring and comparing the volumes at the initial () and the final states. The volume at is directly obtained from the thickness profile H(r); and the volume of the final air bubble is accurately determined from its diameter. To make sure that the bubble is a perfect sphere instead of a cap intersected by the substrate, we keep track of the bubble until it leaves the surface and rises upward. Since the bubble is a perfect sphere after leaving the surface, we can unambiguously determine its volume from the diameter. The exact values of and are shown in Fig.4(a) for different velocities and liquids. The plot reveals a considerable volume increase from film to bubble, proving that the trapped air at is indeed compressed.
To further estimate the pressure at , we need to clarify whether the compression is isothermal or adiabatic. It depends on the time scale of air entrapment, , compared with the time scale during which a thermal equilibrium can be reached, . In our experiment, ; while is determined by the rate of thermal conduction. Our system is a thin air film with the upper and lower boundaries (liquid drop and glass substrate respectively) at the room temperature. Suppose there is a temperature change in the middle (from gas compression or viscous heating or other reasons), the thermal gradient then becomes and the heat flux per unit time is , with being the thermal conductivity of air and being the horizontal cross section area; the factor of 2 comes from the existence of two boundaries. This heat flux will bring the system back to equilibrium during the time scale: , with being the air’s specific heat per unit mass and being the volume of trapped air. Plugging in the values for atmospheric pressure and room temperature, , we obtain: . Therefore, the trapped air reaches thermal equilibrium rather rapidly, due to its thin thickness and small heat capacity, and the compression in our experiment can be considered as isothermal. Subsequently, the compressed air film expands to an uncompressed air bubble, again in an isothermal manner since expansion is even slower than compression. Thus we can obtain the initial air film pressure, , from the isothermal equation of state:
| (1) |
Here since the bubble is uncompressed (the curved surface of bubble adds a negligibly small Laplace pressure around kPa to ). The exact values of are shown as solid symbols in Fig.4(b). Apparently, increases dramatically with impact speed, varying from very close to to several .
This velocity dependence can be qualitatively understood by a force balance estimate. Immediately before the contact, the compressed air in the dimple locally decelerates the liquid to an almost complete stop in vertical direction (see Fig.1(b) main panel), on the length scale of the dimple’s radius (see Fig.1(b) inset). The deceleration occurs during the time scale , with the magnitude . Since the affected liquid has the mass , we get the force: , with C being a pre-factor of order unity. This force naturally comes from the excess pressure of compressed air multiplying the area: . Making the two force expressions equal (Mandre et al. (2009); Mani et al. (2010)) and solving for yield:
| (2) |
This expression has the same trend as the measurements: at small , approaches ; while it rises rapidly with due to the large geometric factor, . The values calculated from this expression are plotted as open symbols in Fig.4(b), and agree reasonably well with the measurements (solid symbols), for different liquids at various impact speeds. The only fitting parameter, C, is indeed of order unity: C = 0.33 (), 0.33 (oil-1.04) and 0.23 (oil-9.30). Clearly C does not change with surface tension but decreases with viscosity, suggesting that under the same impact condition the air trapped in a more viscous drop is less compressed.
Comparing with the existing compressible model (Mandre et al. (2009); Mani et al. (2010)), our experimental range overlaps with their transition region from “incompressible regime” to “compressible regime” (i.e., ). Indeed the data in Fig.4(b) verify such a predicted transition: at low the pressure is close to and the compression is small; while significant compression appears above (corresponding to in the theory). We also find that the initial impact pressure, , exceeding the liquid inertia, , by a large factor of . This comes from the dramatic deceleration of liquid under the thin gap geometry.
3.5 The contraction at
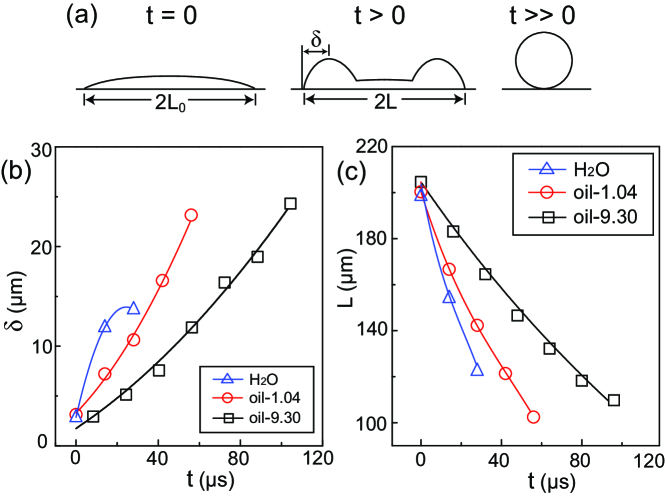
From compressed air film to uncompressed air bubble, the detailed process requires further clarification. We measure this process from interference patterns and demonstrate the evolution in Fig.5(a). At the moment of contact (t = 0), the trapped air is thin and flat with a pressure higher than . After the contact (t 0), however, the air pressure drops sharply as the impact pressure decreases, resulting in a rapid volume expansion at the edge of film. This non-uniform expansion may come from the non-uniform pressure distribution after contact: the center of the film is right below the stagnation point of liquid and thus experiences higher impact pressure; while the edge of air film experiences less impact pressure and more easily to expand. This expansion produces a rim much thicker than the interior, as illustrated in Fig.5(a). We estimate the rim’s volume by assuming a half-circular profile and deduce the pressure from volume estimate. We find that the pressure rapidly drops to uncompressed value within a few tens of microseconds. The uncompressed thick-rimmed structure subsequently contracts into an air bubble.
Therefore, the contraction process is mostly under uncompressed condition except at the very beginning, consistent with the incompressible assumption in previous contraction measurements (Thoroddsen et al., 2003, 2005). However, the previous study assumes a uniform film thickness, while we believe that the thick rim plays an important role. We take the characteristic size of the rim, (see Fig.5(a)), as the dominant length scale during contraction: the surface tension provides the driving stress, , which is balanced by the liquid inertial, , and the viscous stress, . We note that the buoyant effect may also drive the dewetting of air film. However when compared with the surface tension, the buoyant effect is completely negligible during the contraction period studied here: . Therefore we neglect the buoyant effect and use the surface tension as the solely driving force:
| (3) |
Here is the instantaneous contraction velocity at the edge, and , are pre-factors of order one. This expression relates the contraction speed to the rim size . From , we can further calculate the pattern’s radius, (see Fig.5(a)), via the relationship . Thus we can obtain L(t) by solving for in Eq.3 and then integrate it:
Therefore, can be calculated from the knowledge of . We obtain the function by first measuring experimentally and then fitting the data with high order polynomials, as shown in Fig.5(b). On the other hand, can be independently measured from our images. To directly measure L(t), we make the best circular fit for the edge of the pattern, and obtain L(t) from the radius of the circle. The results of two approaches are compared in Fig.5(c) for different liquids. The calculated curves match the measured symbols quite well, confirming the validity of the expression in Eq.3. In addition, the two fitting parameters, and , are universally valid for all liquids, and are indeed of order unity. The air film contracts the fastest in , due to the large surface tension and low viscosity. It contracts slower in oil-1.04, because of the reduced surface tension. The motion is the slowest in oil-9.30, due to the effects of both low surface tension and high viscosity. In conclusion, the contraction is determined by the complex interaction between surface tension, inertia, and viscous effects, as described by Eq.3. Because the dynamic contact angle during contraction is different from the static value and can not be measured directly, its role for air film contraction is still unclear.
4 Conclusions
In this work, we couple high-speed photography with optical interference to study the formation and evolution of air entrapment in liquid-solid impacts. We find a compressed air film formed before liquid touches solid, with an internal pressure significantly higher than the atmospheric value. After contact, the air film vertically expands at the edge, reducing the pressure within a few tens of microseconds and making a rim much thicker than the interior. This thick-rimmed structure subsequently contracts into an air bubble, driven by the complex interaction between surface tension, inertia, and viscous effects. Our investigation provides explicit information for the initial impact pressure as well as the detailed profile transformation during the subsequent evolution. This knowledge may benefit impact related applications such as surface coating and splash control.
This project is supported by the Hong Kong RGC CUHK404211, CUHK404912 and direct grant 2060418.
References
- van Dam & Clerc (2004) van Dam, D. B. & Clerc, C. L. 2004 Experimental study of the impact of an ink-jet printed droplet on a solid substrate. Physics of Fluids 16 (9), 3403–3414.
- Driscoll & Nagel (2011) Driscoll, M. M. & Nagel, S. R. 2011 Ultrafast interference imaging of air in splashing dynamics. Phys. Rev. Lett. 107, 154502.
- Hicks et al. (2012) Hicks, P. D., Ermanyuk, E. V., Gavrilov, N. V. & Purvis, R. 2012 Air trapping at impact of a rigid sphere onto a liquid. Journal of Fluid Mechanics 695, 310–320.
- Hicks & Purvis (2010) Hicks, P. D. & Purvis, R. 2010 Air cushioning and bubble entrapment in three-dimensional droplet impacts. Journal of Fluid Mechanics 649, 135–163.
- Kolinski et al. (2012) Kolinski, J. M., Rubinstein, S. M., Mandre, S., Brenner, M. P., Weitz, D. A. & Mahadevan, L. 2012 Skating on a film of air: Drops impacting on a surface. Phys. Rev. Lett. 108, 074503.
- Mandre et al. (2009) Mandre, S., Mani, M. & Brenner, M. P. 2009 Precursors to splashing of liquid droplets on a solid surface. Phys. Rev. Lett. 102, 134502.
- Mani et al. (2010) Mani, M., Mandre, S. & Brenner, M. P. 2010 Events before droplet splashing on a solid surface. Journal of Fluid Mechanics 647, 163–185.
- de Ruiter et al. (2012) de Ruiter, J., Oh, J. M., van den Ende, D. & Mugele, F. 2012 Dynamics of collapse of air films in drop impact. Phys. Rev. Lett. 108, 074505.
- Smith et al. (2003) Smith, F. T., Li, L. & Wu, G. X. 2003 Air cushioning with a lubrication/inviscid balance. Journal of Fluid Mechanics 482, 291–318.
- Thoroddsen et al. (2003) Thoroddsen, S. T., Etoh, T. G. & Takehara, K. 2003 Air entrapment under an impacting drop. Journal of Fluid Mechanics 478, 125–134.
- Thoroddsen et al. (2005) Thoroddsen, S. T., Etoh, T. G., Takehara, K., Ootsuka, N. & Hatsukih, Y. 2005 The air bubble entrapped under a drop impacting on a solid surface. Journal of Fluid Mechanics 545, 203–212.
- Xu (2007) Xu, L. 2007 Liquid drop splashing on smooth, rough, and textured surfaces. Phys. Rev. E 75, 056316.
- Xu et al. (2005) Xu, L., Zhang, W. W. & Nagel, S. R. 2005 Drop splashing on a dry smooth surface. Phys. Rev. Lett. 94, 184505.
- Yarin (2006) Yarin, A. L. 2006 Drop impact dynamics: Splashing, spreading, receding, bouncing…. Annual Review of Fluid Mechanics 38 (1), 159–192.