ALMA observations of -Oph 102: grain growth and molecular gas in the disk around a young Brown Dwarf
Abstract
We present ALMA continuum and spectral line observations of the young Brown Dwarf -Oph 102 at about 0.89 mm and 3.2 mm. We detect dust emission from the disk at these wavelengths and derive an upper limit on the radius of the dusty disk of AU. The derived variation of the dust opacity with frequency in the mm provides evidence for the presence of mm-sized grains in the disk outer regions. This result demonstrates that mm-grains are found even in the low density environments of Brown Dwarf disks and challenges our current understanding of dust evolution in disks. The CO map at 345 GHz clearly reveals molecular gas emission at the location of the Brown Dwarf, indicating a gas-rich disk as typically found for disks surrounding young pre-Main Sequence stars. We derive a disk mass of % of the mass of the central Brown Dwarf, similar to the typical values found for disks around more massive young stars.
Subject headings:
circumstellar matter — brown dwarfs — stars: individual (Oph 102) — planets and satellites: formation — submillimeter: stars1. Introduction
Brown Dwarfs (BDs) are very low-mass (M0.085M⊙), stellar-like objects unable to burn hydrogen. It is now established that young BDs are surrounded by dusty circumstellar disks (Natta & Testi, 2001; Natta et al., 2002; Testi et al., 2002; Scholz & Jayawardhana, 2008) and undergo a T Tauri-like phase during their early evolution that involves disk accretion and outflows (Jayawardhana et al., 2003; Natta et al., 2004).
Because of their very low masses, disks around BDs also represent an extreme environment to test planet formation theories. There are a few wide orbit, giant planets known as companions to BDs, most likely formed as a result of the fragmentation of the proto-BD core or by gravitational instabilities in the outer disk (e.g. 2M1207b, 2M0441b, Chauvin et al., 2005; Lodato et al., 2005; Todorov et al., 2010). However, most extrasolar planets (and all rocky planets) are thought to form via the core accretion process (Matsuo et al., 2007), and evidence of the first steps of this process has been found in disks around more massive pre-Main Sequence (PMS) stars. In particular, sub-mm observations, which probe the bulk of the disk cold material, have shown that the grains have grown to to reach millimeter and centimeter size (e.g. Beckwith & Sargent, 1991; Rodmann et al., 2006; Ricci et al., 2010a; Ubach et al., 2012).
In BD disks, infrared spectroscopy has shown that in several sources silicates on the disk surface have been significantly modified in size and crystallinity, as in PMS stars (Sterzik et al., 2004; Apai et al., 2005). Until now, due to the limited sensitivity of sub-mm telescopes, the detection of long wavelength emission from young BDs has been limited to continuum photometry of the few brightest objects (e.g. Scholz et al., 2006; Mohanty et al., 2012). The start of ALMA operations allows us to perform more detailed studies. Here we report on multi-wavelength continuum and CO() observations on the young BD -Oph 102. This object ( MJup, M6-spectral type) in the -Ophiuchi star forming region (SFR) is known to be surrounded by a disk from infrared observations, to have a significant mass accretion rate and to drive a wind and molecular outflow (Bontemps et al., 2001; Natta et al., 2002, 2004; Whelan et al., 2005; Phan-Bao et al., 2008). In this Letter we report on our ALMA observations, which were designed to derive a solid estimate of the mm spectral index to constrain the dust properties. In particular we found evidence for grain growth to mm-grain sizes in the outer regions of the –Oph 102 disk. Also, we clearly detected molecular gas emission from the disk and derived an estimate for its mass.
2. ALMA Observations and Results
2.1. Observations and data reduction
We observed –Oph 102 using ALMA Early Science in Cycle 0 at Band 7 and 3 (about 345 and 100 GHz, respectively). Observations in Band 7 were performed using 15 antennas in the Compact array configuration on November 3, 2011, and 16 antennas in the Extended array configuration on May 23, 2012 (projected baseline lengths in the range from the shadowing limit to 400 m). Observations in Band 3 were conducted with 16 antennas in the Extended configuration on May 8, 2012 (projected baseline lengths from 35 to 402 m). All observations were done in good and stable weather conditions, with precipitable water vapor of mm and mm at Band 7 and 3, respectively. The ALMA correlator was set to record dual polarization with four separate spectral windows, each providing a bandwidth of 1.875 GHz with channels of 0.488 MHz width. Spectral windows were centered at 331.103, 332.998, 343.103, 344.998 GHz for Band 7 observations and 86.1021, 87.9976, 98.103, 99.999 GHz for Band 3. The total integration times on –Oph 102 were approximately 15 and 30 minutes in Band 7 and 3, respectively.
The interferometric visibility data were reduced using the CASA package (McMullin et al., 2007). J1924-292 and 3C279 were observed as bandpass calibrators, Neptune and Titan for flux calibration. Simultaneous observations of the 183 GHz water line with the water vapour radiometers were used to reduce atmospheric phase noise before using J1625-254 for standard complex gains calibration. The flux scale was tied to the Butler-JPL-Horizons 2010 models of Neptune and Titan, resulting in an accuracy of .
Imaging of the calibrated visibilities was done in CASA. For each band, a continuum map was produced using natural weighting and combining all the channels without line emission. The only line emission detected was the CO () rotational line in Band 7 which was imaged separately. The CO(3-2) shows significant extended emission as well as compact structure. We imaged the CO data in two separate ways to highlight the different components: we first used all the data, natural weighting and a gaussian taper of the visibilities to recover as much as possible of the extended emission and compare with the low angular resolution map of Phan-Bao et al. (2008); additionally, we also imaged the data from baselines exceeding k with robust weighting to filter out emission on scales larger than about , or AU at the Ophiuchus distance, and highlight the compact emission associated with –Oph 102.
2.2. Continuum maps
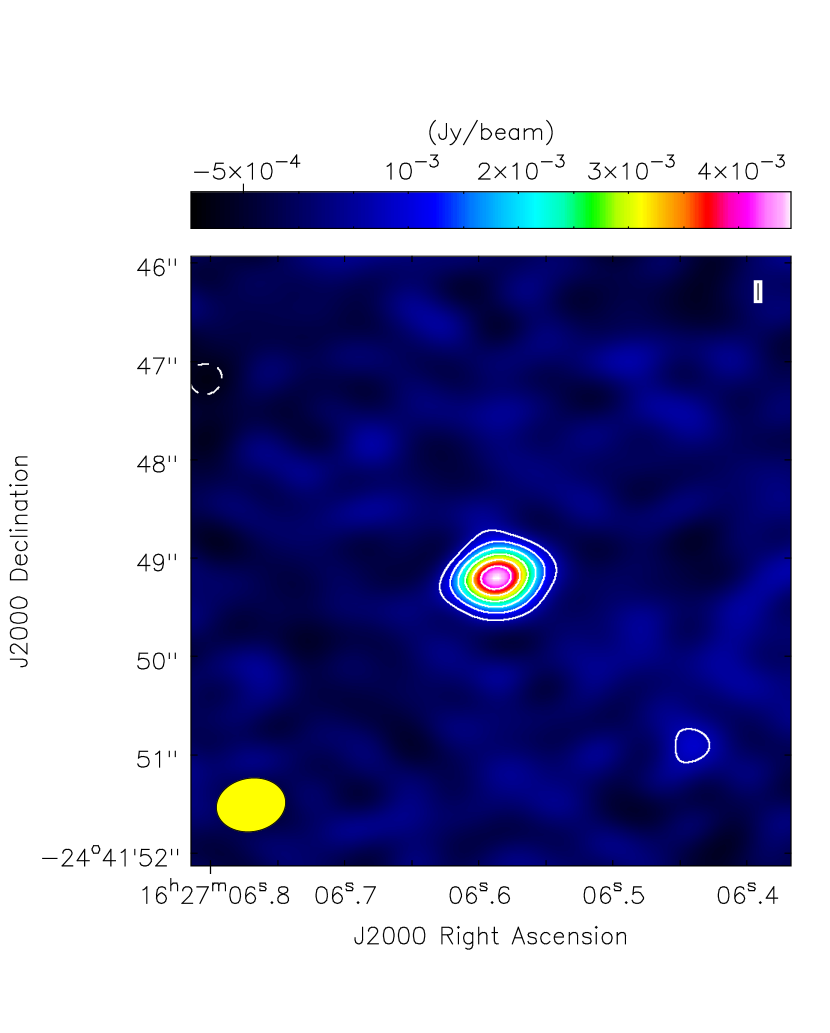
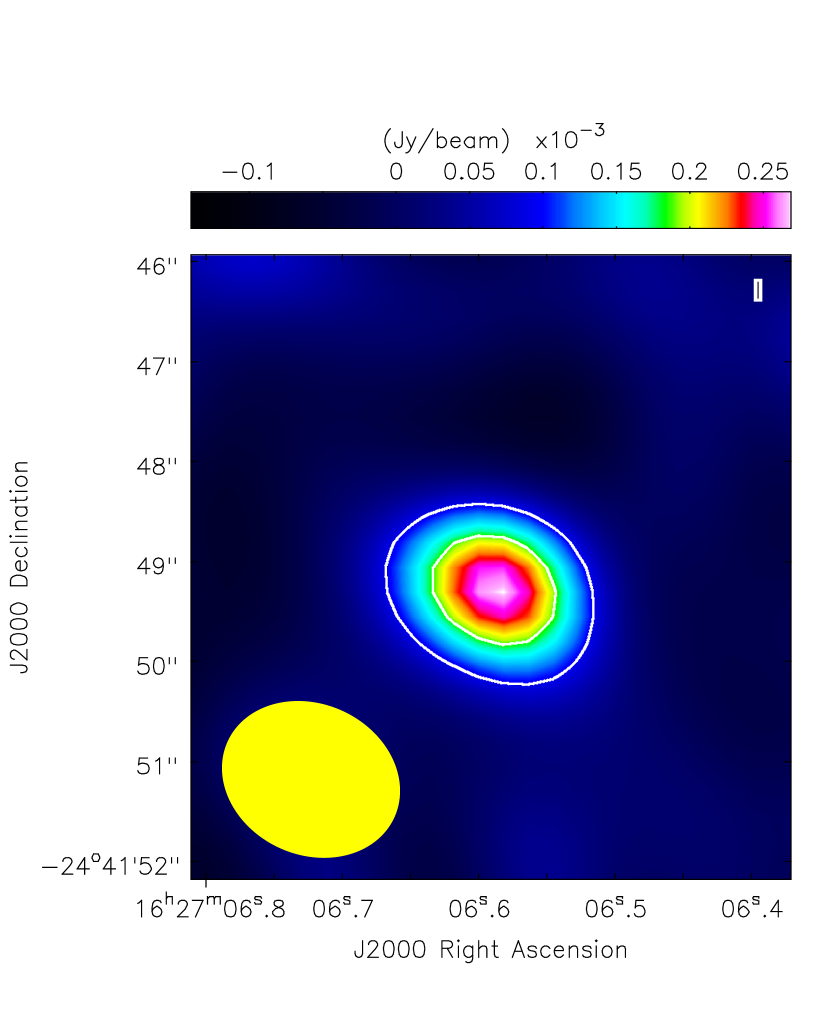
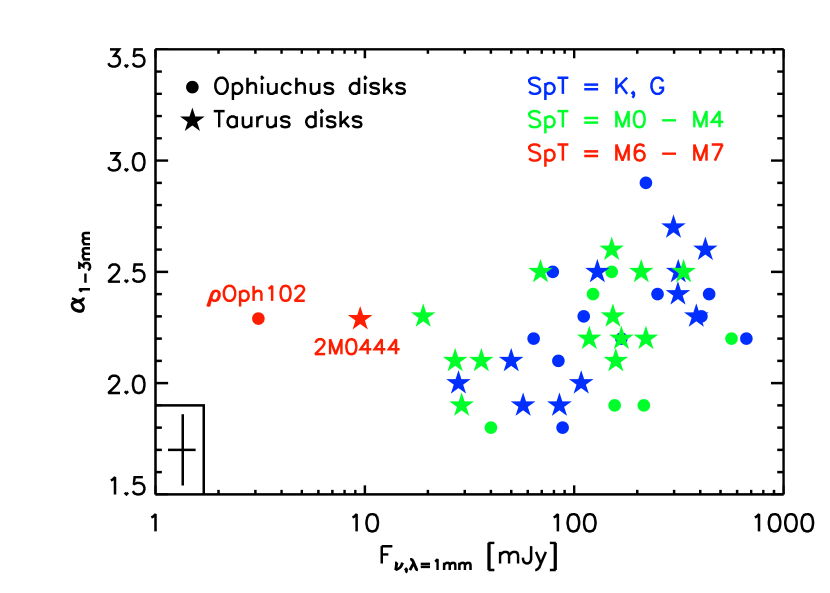
Figure 1 shows the continuum maps at about 0.89 mm (Band 7) and 3.2 mm (Band 3). Dust emission from the disk surrounding -Oph 102 is clearly detected in both maps. We measured flux densities of mJy at 0.89 mm and of mJy at 3.2 mm. The obtained rms-noise levels are consistent with the theoretical expectations given the on-source integration times. This gives a sub-mm spectral index () between 0.89 and 3.2 mm of , where the uncertainty accounts for both the flux calibration and the rms noise in the maps. This value lies well within the range of values measured for disks around single PMS stars in the -Oph and Taurus SFRs (see Figure 3). This suggests that the physical properties of the dust grains emitting in the sub-mm, e.g. their size, do not significantly vary in disks around PMS stars and BDs. The implications of this result will be discussed in Section 3.
Using observations with the Submillimeter array (SMA, Ho et al., 2004) Phan-Bao et al. (2008) reported a low signal-to-noise flux density of mJy at about 1.3 mm. Interpolating between our two measurements, we expect a flux density of mJy at 1.3 mm, lower than the value previously reported, although the discrepancy is only at the 2-level. Note that already with minutes on-source with ALMA in Early Science we reached a sensitivity times better than the SMA.
By inspecting the visibility data, within the uncertainties, we did not find evidence for a decrease of the visibility amplitude with projected baseline length, neither at the shorter nor at the longer baseline lengths probed by our observations. We conclude that our observations did not spatially resolve the disk continuum emission. Considering our angular resolution of at 0.89 mm, and a distance of 130 pc for the -Oph SFR (Wilking et al., 2008; Lombardi et al., 2008), this indicates that the dust is concentrated within less than AU from the central BD.
2.3. CO molecular gas map
The low angular resolution, tapered natural weighting map shows a morphology of the CO() that closely resembles the map of the CO() emission presented by Phan-Bao et al. (2008). We confirm the same main emission features as observed in the SMA map. They interpreted these structures as a bipolar molecular outflow emitted by Oph 102. Even if the signal to noise in our map is significantly better than in the SMA data, our data are most likely significantly affected by missing flux at short baselines. Furthermore, the most prominent features attributed to the outflow are close to the edge of the ALMA primary beam, making it difficult to accurately determine the emission and its extent. For these reasons, we will not discuss the extended emission and outflow further in this Letter.
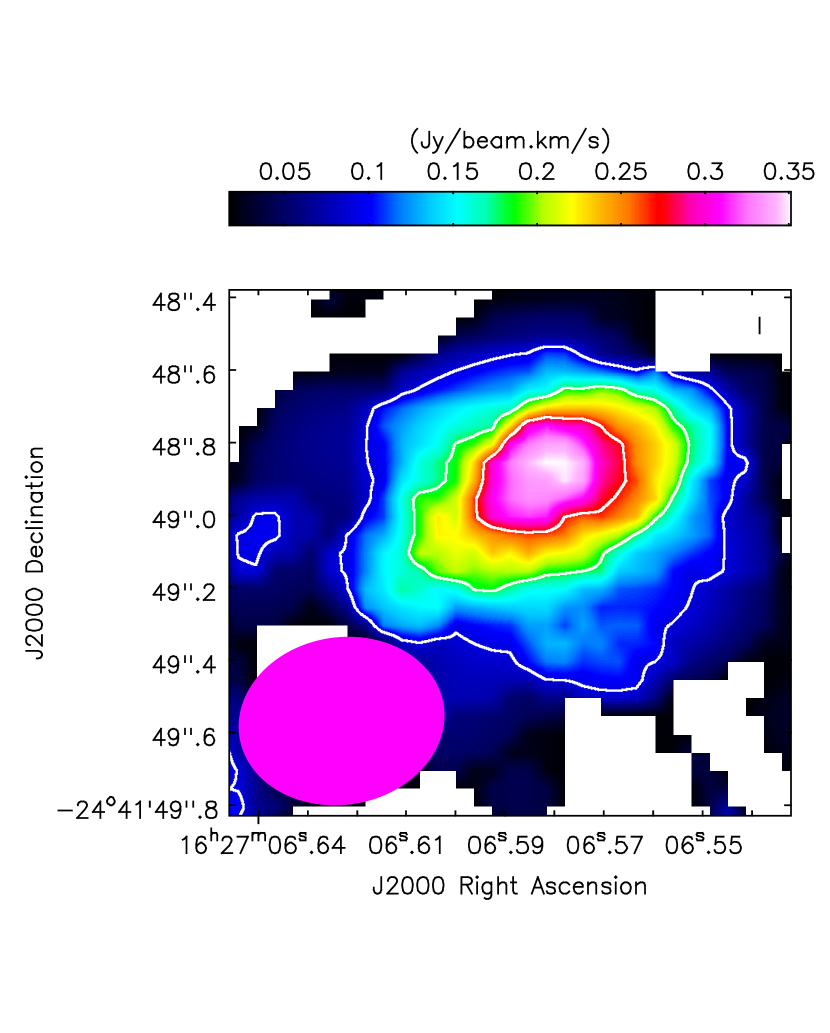
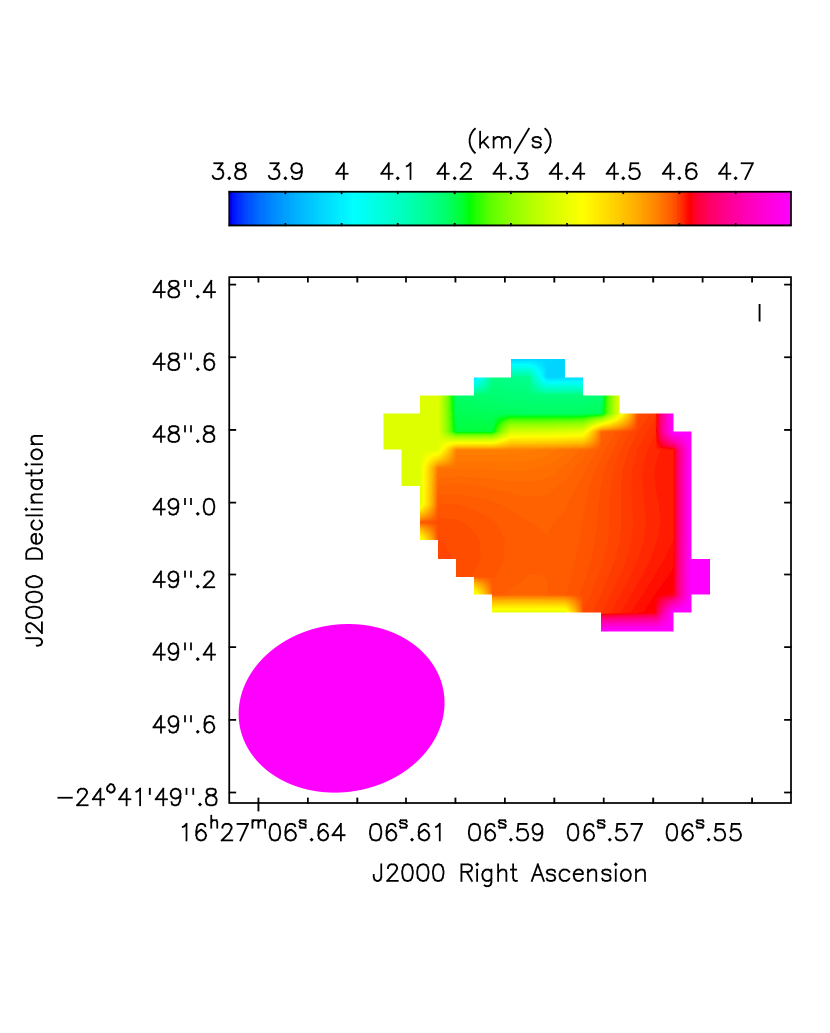
In the CO() low angular resolution map we also detected compact emission coincident with the continuum emission described in Sect. 2.2. Left panel of Fig. 2 shows the map of integrated CO() emission, obtained by filtering out the extended CO emission as described at the end of Section 2.1. Compact emission, that we associate with -Oph 102, is clearly detected in several channels. The disk is detected at a level, with a velocity-integrated total flux of about mJykm/s. Right panel of Fig. 2shows the intensity weighted velocity field of CO molecular gas. We tentatively find the presence of a velocity gradient along the disk spanning a range of radial velocities of km/s. This is consistent with gas in Keplerian rotation in an inclined disk orbiting at distances AU from a 0.06 BD. However, the angular () and velocity ( km/s) resolutions of our observations do not allow a full characterization of the rotation curve of the disk and non-Keplerian rotation curves are still possible.
3. Discussion
To derive the disk mass and physical properties of the grains we model the mm continuum emission using a two-layer (surfacemidplane) model of a flared disk heated by the radiation of the central BD (Chiang & Goldreich, 1997; Dullemond et al., 2001).
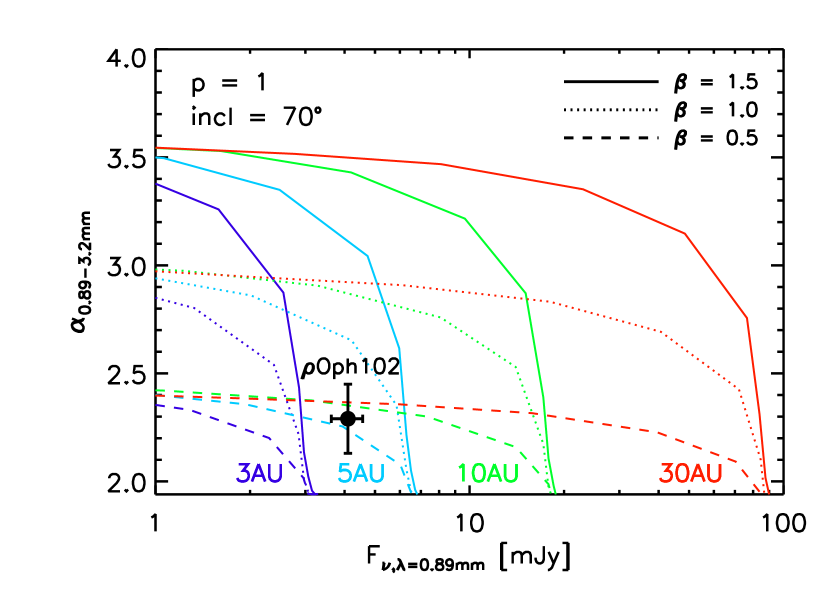
The adopted sub-stellar photospheric properties of -Oph 102 and the dust model are described in the caption of Figure 4. Since our observations did not allow us to spatially resolve the dust emission of the disk, we could not strongly constrain the disk radius and inclination. Our analysis of the unresolved disk photometry follows the procedure outlined in Testi et al. (2001), adapted for the case of young BDs. For the disk surface density we adopted a radial profile with , which is the typical value found for T Tauri disks in the sub-mm (e.g. Isella et al., 2009; Andrews et al., 2010; Guilloteau et al., 2011). A large value of the disk inclination is suggested by the detection of an optical jet (Whelan et al., 2005) and by the nearly symmetric morphology of the bipolar outflow in molecular CO (Phan-Bao et al., 2008). At the same time, the visual extinction of the -Oph 102 photosphere, i.e. (Natta et al., 2002) poses an upper limit of degrees for the disk inclination, as a more inclined disk would absorb the (sub)-stellar radiation much more efficiently (see Skemer et al., 2011). We assume in the following an inclination of 70 degrees; however, our results do not depend critically on this choice.
3.1. Disk mass and size
The main results of our modeling can be derived from Figure 4, which shows the ALMA data overlaid with the predictions from the disk models presented above. Disk models with radii larger than AU can reproduce the data only if the spectral index of the dust opacity () is smaller than 1. This is because for these disks the dust emission is predominantly coming from the optically thin outer regions of the disk. In this case, the spectral index of the SED reflects the dust opacity spectral index, and a relatively low value of is needed to explain the measured spectral index . Models with disk radii AU reproduce the observed continuum flux and spectral index with a broad range of values. This is because very small disks have to be relatively dense to explain the observed sub-mm fluxes: the dust emission in these models becomes mostly optically thick and, in this regime, it does not depend on the dust opacity law. (cf. the discussion in Testi et al., 2001).
Using the CO() detection we can test the hypothesis of a small, optically thick disk. The mean brightness temperature of the CO() in our FWHM beam is 8.3 K. As the gas in the disk is primarily heated by radiation from the central BD, its temperature cannot be very high, i.e. 30-40 K, which in turns means that the beam filling factor of the disk cannot be very small. Under the assumptions of optically thick gas emission and face-on geometry, this argument sets a lower-limit of about 15 AU for the disk radius. For example, if the disk radius was 5 AU the beam filling factor would be 2.3%, the exact value depending on the disk inclination. This would correspond to a gas temperature 400 K, which is much higher than expected for a BD disk.
The -values constrained by our analysis for these larger disks, i.e. , correspond to dust opacities values of cmg (see also Ricci et al., 2010a). Given the measured flux densities, we derive estimates for the dust mass of , or assuming an ISM-like gas-to-dust mass ratio of 100. These values correspond to a disk which contains 0.3–1% of the mass of the BDdisk system and are consistent with the distribution of values for more massive T Tauri systems (Williams & Cieza, 2011).
3.2. Constraints on the physics of dust evolution in gas-rich disks
The -values needed for disks larger than 5 AU are significantly lower than the values constrained for the ISM (, see Draine, 2003) and are instead consistent with the values derived for disks around PMS stars (, e.g. Natta et al., 2007; Ricci et al., 2010a). So far, the only plausible hypothesis proposed to explain these values of is that most of the thermal emission observed in the sub-mm is coming from mm-sized grains, or larger, from the disk outer regions (Draine, 2006; Ricci et al., 2012).
State-of-the-art models of dust evolution in disks can calculate the size-dependent evolution of solids accounting for a variety of different mechanisms, e.g. coagulation, fragmentation, radial migration (Brauer et al., 2008; Birnstiel et al., 2010a). Sub-mm observations providing information on the grain size distribution of dust in disks around PMS stars have been used to test the predictions from these models (Birnstiel et al., 2010b; Pinilla et al., 2012). In these models, the efficiency for a disk to grow solids critically depends on its physical conditions. If compared with more massive disks around PMS stars, these models predict that at the conditions of BD disks (e.g. lower densities, higher relative velocities due to radial drift) the growth to mm-grains should be much less efficient. Furthermore, in BD disks inward radial drift of mm-grains is expected to be faster than in T Tauri disks by a factor of a few. Therefore, the discovery of mm-sized grains in the outer regions of BD disks, as suggested in the case of -Oph 102, severely challenges models of early evolution of solids. Possible ways to explain the presence of mm-sized grains in the outer regions of young BD disks are discussed in Pinilla et al. (2012, in prep.). These include very low levels of turbulence in the disk to decrease the collisional speed between solids, and require the action of some physical mechanisms which can efficiently halt the inward radial migration of these particles, e.g. gravitational clumping favored by the magnetic field in the disk (Johansen et al., 2007).
4. Summary
We presented ALMA observations of the young Brown Dwarf -Oph 102 at about 0.89 mm and 3.2 mm. We reported the detection of the disk surrounding -Oph 102 in both the dust continuum bands and in CO(). Dust continuum emission is spatially unresolved, and this provides an upper limit on the radius of the dusty disk of AU. We derived a disk mass of % of the mass of the Brown Dwarf, similar to the typical values found for disks around PMS stars. The detection of CO molecular gas emission at the location of the Brown Dwarf indicates a gas-rich disk as typically found for disks surrounding more massive young stars. We measured a spectral index of the continuum emission , which is significantly lower than the value found in the ISM. By modeling the dust emission and from the properties of the CO molecular gas emission we constrained the variation of the dust opacity with frequency, which is a diagnostic of grain growth in the disk. Our result indicates that mm-grains are found not only in the outer regions of T Tauri disks, but even in the low density environments of Brown Dwarf disks, and this challenges our current understanding of dust evolution in gas-rich disks.
References
- Andrews et al. (2010) Andrews, S. M., Wilner, D. J., Hughes, A. M., Qi, C., & Dullemond, C. P. 2010, ApJ 723, 1241
- Apai et al. (2005) Apai, D., Pascucci, I., Bouwman, J., et al. 2005, Science 310, 834
- Beckwith & Sargent (1991) Beckwith, S. V. W., & Sargent, A. I. 1991, ApJ 381, 250
- Birnstiel et al. (2010a) Birnstiel, T., Dullemond C. P., & Brauer, F. 2010a, A&A 513, 79
- Birnstiel et al. (2010b) Birnstiel, T., Ricci, L., Trotta, F., Dullemond, C. P., Natta, A., Testi, L., Dominik, C., Henning, T., Ormel, C. W., & Zsom, A. 2010b, A&A 516L, 14
- Bontemps et al. (2001) Bontemps, S., André, P., Kaas, A. A., Nordh, L., Olofsson, G., Huldtgren, M., & Abergel, A. et al. 2001A&A 372, 173
- Bouy et al. (2008) Bouy, H., Huélamo, N., Pinte, C., Olofsson, J., Barrado Y Navascués, D., Mart n, E. L., Pantin, E., & Monin, J.-L. et al. 2008, A&A 486, 877
- Brauer et al. (2008) Brauer, F., Dullemond, C. P., & Henning, Th. 2008, A&A 480, 859
- Cardelli et al. (1989) Cardelli, J. A., Clayton, G. C., & Mathis, J. S. 1989, ApJ 345, 245
- Chauvin et al. (2005) Chauvin, G., Lagrange, A.M., Dumas, Ch. 2005, A&A 438, L25
- Chiang & Goldreich (1997) Chiang, E., & Goldreich, P. 1997, ApJ 490, 368
- Draine (2006) Draine, B. T. 2006, ApJ, 636, 1114
- Draine (2003) Draine, B. T. 2003, ARAA 41, 241
- Dullemond et al. (2001) Dullemond, C. P., Dominik, C., & Natta, A. 2001, ApJ 560, 957
- Guilloteau et al. (2011) Guilloteau, S., Dutrey, A., Pi tu, V., & Boehler, Y. 2011, A&A 529, 105
- Ho et al. (2004) Ho, P. T. P., Moran, J. M., & Lo, K. Y. 2004, ApJ 616L, 1
- Isella et al. (2009) Isella, A., Carpenter, J. M., & Sargent, A. I. 2009, ApJ 701, 260
- Jayawardhana et al. (2003) Jayawardhana, R., Mohanty, S., & Basri, G. 2003, ApJ, 592, 282
- Johansen et al. (2007) Johansen, A., Oishi, J. S., Mac Low, M.-M., Klahr, H., Henning, Th., & Youdin, A. 2007, Nature 448, 1022
- Lodato et al. (2005) Lodato, G., Delgado-Donate, E., Clarke, C.J. 2005, MNRAS 364, L91
- Lombardi et al. (2008) Lombardi, M., Lada, C. J., & Alves, J. 2008, A&A, 480, 785
- Matsuo et al. (2007) Matsuo, T., Shibai, H., Ootsubo, T., Tamura, M. 2007, ApJ 662, 1282
- McMullin et al. (2007) McMullin, J. P., Waters, B., Schiebel, D., Young, W., & Golap, K. 2007, in ASP Conf. Ser. 376, Astronomical Data Analysis Software and Systems XVI, ed. R. A. Shaw, F. Hill, & D. J. Bell (San Francisco, CA: ASP), 127
- Mohanty et al. (2012) Mohanty, S., Greaves, J., Mortlock, D., et al. 2012, ApJ submitted
- Natta et al. (2007) Natta, A., Testi, L., Calvet, N., Henning, Th., Waters, R., Wilner, D.J. 2007, 2007 Protostars and Planets V, 767
- Natta et al. (2002) Natta, A., Testi, L., Comer n, F., Oliva, E., D’Antona, F., Baffa, C., Comoretto, G., & Gennari, S. 2002, A&A 393, 597
- Natta et al. (2004) Natta, A., Testi, L., Neri, R., Shepherd, D. S., Wilner, D. J. 2004, A&A 416, 179
- Natta & Testi (2001) Natta, A., Testi, L. 2001, A&A 376, L22
- Phan-Bao et al. (2008) Phan-Bao, N., Riaz, B., Lee, C.-F., Tang, Y.-W.; Ho, P. T. P., Mart n, E. L., Lim, J., Ohashi, N., & Shang, H. 2008, ApJ 689, 141
- Pinilla et al. (2012) Pinilla, P., Birnstiel, T., Ricci, L., Dullemond, C. P., Uribe, A. L., Testi, L., & Natta, A. 2012, A&A 538, 114
- Pollack et al. (1994) Pollack, J. B., Hollenbach, D., Beckwith, S., Simonelli, D. P., Roush, T., & Fong, W. 1994, ApJ 421, 615
- Ricci et al. (2012) Ricci, L., Trotta, F., Testi, L., Natta, A., Isella, A. & Wilner, D. J. 2012, A&A 540, 6
- Ricci et al. (2010a) Ricci, L., Testi, L., Natta, A., Neri, R., Cabrit, S. & Herczeg, G. J. 2010, A&A 512, 15
- Ricci et al. (2010b) Ricci, L., Testi, L., Natta, A., & Brooks, K. J. 2010b, A&A 521, 66
- Rodmann et al. (2006) Rodmann, J., Henning, Th., Chandler, C. J., Mundy, L. G., & Wilner, D. J. 2006, A&A 446, 211
- Scholz & Jayawardhana (2008) Scholz, A. & Jayawardhana, R. 2008, ApJ 672, L49
- Scholz et al. (2006) Scholz, A., Jayawardhana, R. & Wood, K. 2006, ApJ 645, 1498
- Skemer et al. (2011) Skemer, A. J., Close, L. M., Szucs, L., Apai, D., Pascucci, I., & Biller, B. A. 2011,ApJ 732, 107
- Sterzik et al. (2004) Sterzik, M.F., Pascucci, I., Apai, D., van der Bliek, N., Dullemond, C.P. 2004, A&A 427, 245
- Testi et al. (2002) Testi, L., Natta, A., Oliva, E., et al. 2002, ApJ 571, L155
- Testi et al. (2001) Testi, L., Natta, A., Shepherd, D. S., & Wilner, D. J. 2001, ApJ 554, 1087
- Todorov et al. (2010) Todorov, K., Luhman, K. L., & McLeod, K. K. 2010, ApJ 714, L84
- Ubach et al. (2012) Ubach, C., Maddison, S. T., Wright, C. M., Wilner, D. J., Lommen, D. J. P., & Koribalski, B. 2012, MNRAS in press, arXiv:1207.0260
- Warren (1984) Warren, S. G. 1984, ApOpt 23, 1206
- Weingartner & Draine (2001) Weingartner, J. C., & Draine, B. T. 2001, ApJ 548, 296
- Wilking et al. (2008) Wilking, B. A., Gagn , M., & Allen, L. E. 2008, in Handbook of Star Forming Regions: Volume II, The Southern Sky, ed. Reipurth (San Francisco, CA: ASP), 351
- Williams & Cieza (2011) Williams, J. P., & Cieza, L. A. 2011, ARA&A 49, 67
- Whelan et al. (2005) Whelan, E., Ray, T., Bacciotti, F., et al. 2005, Nature 435, 652
- Zubko et al. (1996) Zubko, V. G., Mennella, V., Colangeli, L., & Bussoletti, E. 1996, MNRAS 282, 1321