Kinematics and Excitation of the Molecular Hydrogen Accretion Disc in NGC 1275
Abstract
We report the results of high spatial and spectral resolution integral-field spectroscopy of the central arcsec2 of the active galaxy NGC 1275 (Perseus A), based on observations with the Near-infrared Integral Field Spectrograph (NIFS) and the ALTAIR adaptive-optics system on the Gemini North telescope. The circum-nuclear disc in the inner pc of NGC 1275 is seen in both the H2 and [\textFe ii] lines. The disc is interpreted as the outer part of a collisionally-excited turbulent accretion disc. The kinematic major axis of the disc at a position angle of is oriented perpendicular to the radio jet. A streamer-like feature to the south-west of the disc, detected in H2 but not in [\textFe ii], is discussed as one of possibly several molecular streamers, presumably falling into the nuclear region. Indications of an ionization structure within the disc are deduced from the \textHe i and Br emission lines, which may partially originate from the inner portions of the accretion disc. The kinematics of these two lines agrees with the signature of the circum-nuclear disc, but both lines display a larger central velocity dispersion than the H2 line. The rovibrational H2 transitions from the core of NGC 1275 are indicative of thermal excitation caused by shocks and agree with excitation temperatures of and K for the lower- and higher-energy H2 transitions, respectively. The data suggest X-ray heating as the dominant excitation mechanism of [\textFe ii] emission in the core, while fast shocks are a possible alternative. The [\textFe ii] lines indicate an electron density of . The H2 disc is modelled using simulated NIFS data cubes of H2 emission from inclined discs in Keplerian rotation around a central mass. Assuming a disc inclination of , the best-fitting models imply a central mass of . Taken as a black-hole mass estimate, this value is larger than previous estimates for the black-hole mass in NGC 1275, but is in agreement with the - relation within the rms scatter. However, the molecular gas mass in the core region is tentatively estimated to be non-negligible, which suggests that the central mass may rather represent an upper limit for the black-hole mass. In comparison to other H2-luminous radio galaxies, we discuss the relative role of jet feedback and accretion in driving shocks and turbulence in the molecular gas component.
keywords:
galaxies: general – galaxies: active – galaxies: nuclei – galaxies: individual (NGC 1275)1 INTRODUCTION
NGC 1275 (also commonly known as Perseus A, 3C 84, 4C+41.07, or IRAS 03164+4119) is the central galaxy in the Perseus cluster, Abell 426. The cluster Abell 426 shows two distinct velocity components: NGC 1275 () belongs to the low-velocity component, which is associated with velocities of 5200 km s-1. The high-velocity component, showing velocities of 8200 km s-1 is located in front of NGC 1275 to the north and north-west of the nucleus (Rubin et al., 1977). The two velocity components have been interpreted as indicating an ongoing galaxy cluster merger (Unger et al., 1990). However, X-ray absorption studies by Gillmon et al. (2004) and Sanders & Fabian (2007) indicate that the separation between both velocity components is large. Gillmon et al. (2004) suggest that the high-velocity system is not yet merging with NGC 1275 but is still in the process of falling into the cluster.
The number of classifications for NGC 1275 in the literature – Fanaroff-Riley 1 radio galaxy (F-R I), BL Lac object, post-merger galaxy, cooling-flow galaxy, peculiar Seyfert 1, and LINER – reflect the fact that NGC 1275 exhibits an extraordinarily rich set of interstellar physical phenomena. It is a star-forming early-type cD galaxy, harbouring an active nucleus which is a point source of hard X-rays (Kawara & Taniguchi, 1993; Prieto, 1996) and a very strong radio source (hence the name Perseus A). The radio emission on large-scales and parsec-scales shows a pair of jets (Pedlar et al., 1990; Walker, Romney & Benson, 1994). The jets are oriented at a position angle of 160∘ (Pedlar et al., 1990). Using VLBI measurements of the parsec-scale jet, Walker, Romney & Benson (1994) inferred a likely range of angles to the line of sight of . The southern jet is the one approaching us.
NGC 1275 is associated with strong thermal X-ray emission, which extends over several arc minutes around the active nucleus and shows a complex bubble-like morphology (Fabian et al., 2000, 2003a), as well as with an extended structure of H filaments (Minkowski, 1957; Lynds, 1970). These filaments of ionized gas have been studied in detail by Conselice, Gallagher & Wyse (2001). They are likely to be stabilized by magnetic fields (Fabian et al., 2008) and display LINER-like spectra which have been analysed by Sabra et al. (2000). Sabra et al. (2000) examined a variety of excitation mechanisms – including shocks, ionization by an AGN, and stellar photoionization – without finding a fully adequate explanation for the observed spectra. Collisional heating by ionizing particles has recently been investigated in greater detail as a possible explanation for the emission characteristics of the filaments (Ferland et al., 2009; Fabian et al., 2011).
NGC 1275 was originally believed to represent the prototypical cooling-flow galaxy, in which the H filaments have formed by cooling of the intracluster medium (Fabian, 1994). But the correlation between the X-ray and H morphology suggests that the filaments rather consist of cold gas which is uplifted behind the radio bubbles driven by the radio jet (Fabian et al., 2003). Salomé et al. (2006) and Salomé et al. (2011) have shown that there is also a tight correlation between the extended CO line emission, the H filaments, the extended X-ray emission, and the large radio lobes mapped by Pedlar et al. (1990). Likewise, Lim et al. (2012) found a close correspondence between the H filaments and the extended H2 1-0 S(1) emission. A fraction of the molecular gas and much of the thermal X-ray emission are confined in shells around bubbles of non-thermal synchrotron-emitting plasma. This is clear evidence of the importance of the radio lobes in compressing and cooling the ambient galactic medium. This ambient galactic medium can be derived from either shock-cooled thermal X-ray plasma or from the debris of a recent galactic merger (Conselice, Gallagher & Wyse, 2001).
The total mass of molecular gas in NGC 1275 is large. Based on CO(2-1) observations of the nuclear and extended gas, Salomé et al. (2006) measured a total mass of cold H2 of , using the standard CO to molecular hydrogen conversion factor. About of this molecular gas are contained in the inner kpc, a mass that is comparable with the total mass of H2 in the Milky Way. Most of the emission arises in an extended east-west structure passing through the nucleus. Salomé et al. (2006) found that the CO emission in the central 8 kpc diameter region does not show any evidence of large-scale rotation. However, the CO line profile in the central 4 kpc diameter region is double-peaked, which may indicate inflows, outflows, or a rotating disc (Salomé et al., 2011).
The source of the molecular hydrogen in the nuclear region of NGC 1275 is thought to be turbulent infalling gas. Whether this gas is carried into the central regions by a galactic merger or a cooling flow is unclear (e.g. Salomé et al., 2006). Interferometric observations of the CO emission in the central 10 kpc by Lim et al. (2008) revealed that most of the gas is associated with radial filaments, which are oriented in the east-west direction (i.e. perpendicular to the jet axis), located between X-ray cavities, and consistent with radially infalling gas flows. Lim et al. (2008) argued that the absence of any large-scale rotation makes a merger-origin of the gas less likely.
The near-infrared spectrum of the nuclear region was investigated by Rudy et al. (1993) who found that the [\textFe ii] lines are unusually strong and narrow, indicating that they arise from a region with kinematics different from the nucleus. It was suggested that these features are caused by shocks. Shocks were also suggested as the cause of the H2 1-0 S(1) line emission, first investigated by Fischer et al. (1987). These molecular shocks were discussed as possible triggers of starburst activity. Krabbe et al. (2000), Rodríguez-Ardila, Riffel & Pastoriza (2005), and Wilman, Edge & Johnstone (2005) determined the excitation temperatures of the near-infrared H2 lines in the circum-nuclear region. They found the emission of this K H2 component to be consistent with thermal excitation from X-ray or shock heating. Because the brightest H2 emission is extended over only the central 300 pc, Krabbe et al. (2000) concluded that it is more likely to be directly associated with the AGN rather than being located in a large-scale cooling flow. Donahue et al. (2000) agreed with this conclusion and further suggested that the H2 emission is too bright to be part of a cooling flow. In addition, their HST images show a faint extension of H2 1-0 S(1) emission from the nucleus to the southwest as well as a faint feature to the east of the nucleus.
Wilman, Edge & Johnstone (2005) inferred the properties of the near-infrared H2 in the centre of NGC 1275, using observations of the central arcsec2 with the imaging spectrograph UIST (UKIRT Imaging Spectrometer) on UKIRT (United Kingdom Infrared Telescope) taken under seeing-limited conditions of 0.3–0.4 arcsec. They suggested that the H2 emission at around 50 pc from the nucleus arises in a dense clumpy disc, rotating in a plane perpendicular to the radio jet. They concluded that thermal excitation by the nuclear radiation field is the dominant excitation mechanism of the H2 emission. Based on the discontinuity in H2 velocity across the nucleus of around 240 km s-1, they estimated a mass of M⊙ for the black hole at the nucleus, assuming a disc inclination of . The nuclear [\textFe ii] 1.644 µm emission was found to be spatially resolved, while the nuclear Pa emission remained unresolved. According to Wilman, Edge & Johnstone (2005), the nuclear disc of hot H2 would likely be part of the larger-scale H2 and CO structure seen in NGC 1275. This, together with the more recent observations of molecular gas in the extended filaments on several 10 kpc scales (Salomé et al., 2006; Lim et al., 2012), suggests that the fuelling process of the AGN in NGC 1275 by interstellar material is being observed over a large range of scales.
In this paper, we analyse the inner circum-nuclear disc of NGC 1275 using observations with NIFS (Near-infrared Integral-Field Spectrograph; McGregor et al., 2003) in conjunction with the adaptive-optics system, ALTAIR, on the Gemini North telescope. The NIFS data permit a high-spatial-resolution study of the kinematics of the molecular and ionized gas via the H2 1-0 S(1), [\textFe ii] 1.644 µm, \textHe i 2.058 µm, and Br 2.166 µm lines as well as an examination of the excitation mechanisms of H2 and [\textFe ii]. Throughout the paper we assume H km s-1 Mpc-1, , and , which results in a spatial scale of 358 pc arcsec-1 for NGC 1275 (Wright, 2006).
2 OBSERVATIONS
The Gemini Near-infrared Integral-Field Spectrograph (NIFS) and ALTAIR adaptive-optics system on the 8.1 m Gemini North telescope on Mauna Kea in Hawaii were used to obtain -band and -band spectra of NGC 1275. NIFS has 29 slitlets, each 0.1 arcsec wide, and has a resolution of 0.04 arcsec per spaxel along each slitlet. The field of view is arcsec2, and it delivers a spectral resolving power of 5300, matched to two pixels on the detector, at both and . This corresponds to a velocity resolution of 60 km s-1.
The -band observations of NGC 1275 were obtained on 2005 November 11 during the commissioning of NIFS. The observations were performed using the ALTAIR natural guide star system with the nucleus of NGC 1275 as the reference for the adaptive-optics correction. The nearby star U1275_02199239 was used as the on-instrument wavefront sensor (OIWFS) guide star for slow flexure correction. The instrument was oriented at a position angle of , so that the slitlets were aligned E-W. The observation consisted of eight exposures of 600 s duration centred on NGC 1275, interleaved with eight 600 s exposures of an adjacent sky region. None of these exposures was spatially dithered. The A0V HIPPARCOS star HIP 18769 was observed after the NGC 1275 observation to provide correction of telluric absorption and flux calibration from its 2MASS magnitudes.
The -band observations of NGC 1275 were obtained during NIFS Science Verification observations (program GN-2006A-SV-124) on 2006 February 1 and 2. Again, ALTAIR was used in natural guide star mode and the instrument was set to a position angle of . Two object-sky exposure pairs were obtained with 900 s exposure times in modest seeing, one pair on each night. HIP 18769 was also observed after NGC 1275 on each night.
3 DATA REDUCTION AND VISUALIZATION
The data were reduced in a standard way (Storchi-Bergmann et al., 2009) using a variant of the Gemini IRAF package. The object and sky exposures were combined first. Then a dark exposure was subtracted from both the combined-object and combined-sky frames. The combined-sky frame was scaled to match the combined-object frame and subtracted. The sky-subtracted object frame was then flatfielded, bad pixels were interpolated, and the 29 individual two-dimensional slitlet spectra were extracted from this image. Argon arc spectra were used to define the wavelength calibration and flatfield exposures through a Ronchi grating were used to define the spatial calibration along slitlets. Each two-dimensional slitlet spectrum was then geometrically transformed onto a rectilinear spatio-spectral coordinate grid and the resulting 29 two-dimensional spectra combined into a three-dimensional data cube. A one-dimensional spectrum was extracted from a 0.5 arcsec-diameter circular aperture defined within the standard star data cube, a correction for telluric absorption was defined, and this one-dimensional correction spectrum was applied to all spaxels within the object and standard star data cubes. Similarly, a flux-calibration spectrum was extracted from the telluric-corrected standard star data cube using a 1.5 arcsec-diameter circular aperture with the level set by the 2MASS or band magnitude and the blackbody shape defined by its 2MASS colour temperature of 11 000 K. The final data cubes obtained at and are in the form of multi-extension FITS files with 2040 wavelength pixels and spatial pixels (spaxels).
The resulting - and -band spectra of the core of NGC 1275, integrated over a 1.0 arcsec-diameter circular aperture, are shown in Figs 1 and 2. The -band spectrum of the core of NGC 1275 is known to be dominated by H2 emission lines (Krabbe et al., 2000; Wilman, Edge & Johnstone, 2005). Our spectra confirm a large number of H2 lines, mostly in the -band spectrum and some weaker lines in the -band spectrum. The -band is dominated by the strong [\textFe ii] 1.644 µm emission. Other weaker [\textFe ii] emission lines are also apparent. Furthermore, weaker lines of the Brackett series and of \textHe i are seen in the - and -band. The flux measurements for the emission lines detected in the NIFS spectra are listed in Table 1.
| (1) | (2) | (3) | (4) | (5) | (6) | (7) |
|---|---|---|---|---|---|---|
| Line | Vacuum Wavelength | Flux | FWHM | Flux | FWHM | Comment |
| (µm) | (erg s-1 cm-2) | (km s-1) | (erg s-1 cm-2) | (km s-1) | ||
| 1.0 arcsec aperture | 0.5 arcsec aperture | |||||
| … | … | blend | ||||
| H2 1-0 S(10) | 1.6665 | … | … | blend | ||
| … | … | blend | ||||
| H2 1-0 S(9) | ||||||
| … | … | blend | ||||
| … | … | blend | ||||
| H2 1-0 S(8) | … | … | blend | |||
| \textH i Br10 | … | … | low S/N | |||
| H2 1-0 S(7) | ||||||
| H2 2-1 S(4) | … | … | … | low S/N | ||
| H2 1-0 S(2) | ||||||
| H2 2-1 S(3) | ||||||
| H2 1-0 S(1) | ||||||
| H2 2-1 S(2) | ||||||
| H2 3-2 S(3) | ||||||
| H2 1-0 S(0) | ||||||
| H2 2-1 S(1) | ||||||
| H2 2-1 S(0) | … | … | … | low S/N | ||


A knowledge of the -band point-spread function (PSF) is required for analysing the surface-brightness profiles and the kinematics of the emission-line gas in the circum-nuclear region of NGC 1275. We use the spatial profile of the standard star, HIP 18769, as our PSF reference. Obtaining the PSF from separate standard-star observations involves uncertainties, since the observing conditions may have changed between these and the object observations. The PSF could be measured more directly using an unresolved emission component in the -band data cube for NGC 1275. Candidates for this are the -band continuum emission or hydrogen emission from the AGN broad-line region. However, Fig. 3 shows that the profile of the -band continuum of NGC 1275 (filled squares) is extended compared to the profile of the standard star. The same is true for the Br 2.166 µm emission of NGC 1275 (open squares), which is integrated over a velocity interval from to after continuum subtraction. The fact that the Br 2.166 µm emission is spatially extended suggests that the integrated line includes emission from outside the AGN broad-line region. In order to isolate any emission from the AGN broad-line region, it would be necessary to decompose the line profile, which is not practical at the given signal-to-noise ratio.

The radial profile of HIP 18769 and the corresponding PSF fit are shown in Fig. 3. The PSF fit is based on a single Moffat function of the form
| (1) |
where is the amplitude, is the radius, and FWHM is the full width at half maximum. Fitting this function to the standard star profile results in a FWHM of 0.103 arcsec (36 pc), corresponding to one spatial pixel across the slitlets.
4 EMISSION-LINE MORPHOLOGY
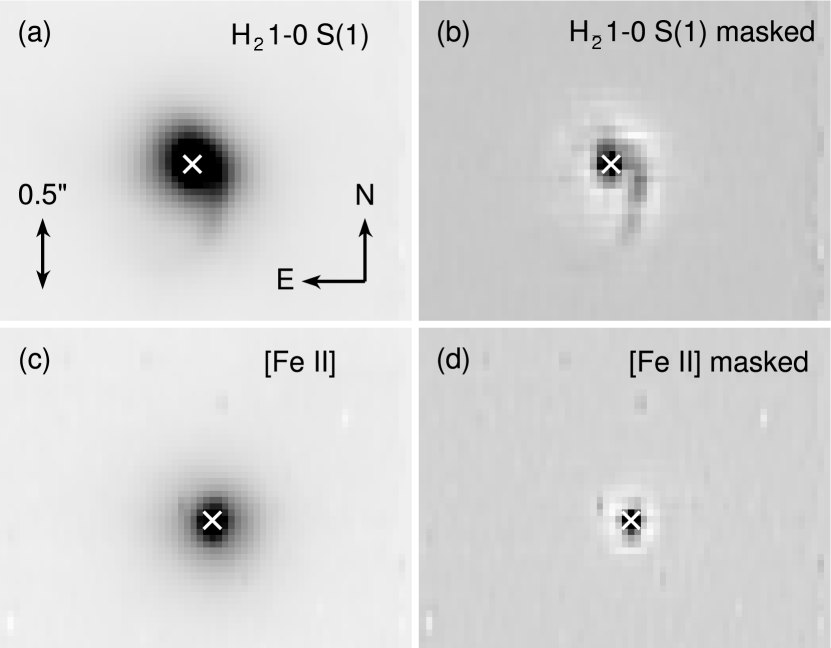
The circum-nuclear regions of the integrated flux maps in H2 1-0 S(1) and [\textFe ii] 1.644 µm show a steeply increasing surface brightness towards the core of the galaxy (Fig. 4a and c). In the analysis presented here, this emission is interpreted as tracing the outer parts of an inclined accretion disc around the central active nucleus. The classical inner accretion disc is unresolved at our spatial resolution of 36 pc.
The integrated H2 emission is clearly perturbed towards the south-west. Fig. 4b shows an unsharp mask of the integrated H2 image of Fig. 4a, which is the result of subtracting a smoothed copy of Fig. 4a from Fig. 4a. The smoothing is performed by convolving the image with a Gaussian function, using a FWHM of 3 pixels. Fig. 4b reveals a feature extending from the nucleus to the west and south, which is likely to be a part of the southwestern emission feature reported by Donahue et al. (2000). It is uncertain whether this is a stream of gas falling into the centre or being ejected from the centre. However, Lim et al. (2008) found signs of generally infalling motions in the molecular gas, CO(2-1), in the inner kpc on kiloparsec scales. Since it is likely that these streams of gas continue to smaller scales, we interpret the southwestern feature in our NIFS data as an infalling stream of gas settling into the overall accretion disc at small radii. As we will see in Sections 5 and 8.2, the streamer is associated with redshifted velocities and apparently joins the H2 disc on a retrograde orbit. The streamer is not detected in [\textFe ii] 1.644 µm emission. This is obvious from Fig. 4d, which shows the unsharp mask corresponding to the integrated [\textFe ii] 1.644 µm emission. The lack of [\textFe ii] detection in the streamer suggests that the streamer is either predominantly molecular in nature, or not exposed to sufficient internal high-velocity shocks or sufficient X-ray heating from the nuclear continuum source, both of which are possible [\textFe ii] excitation mechanisms.
5 EMISSION-LINE KINEMATICS
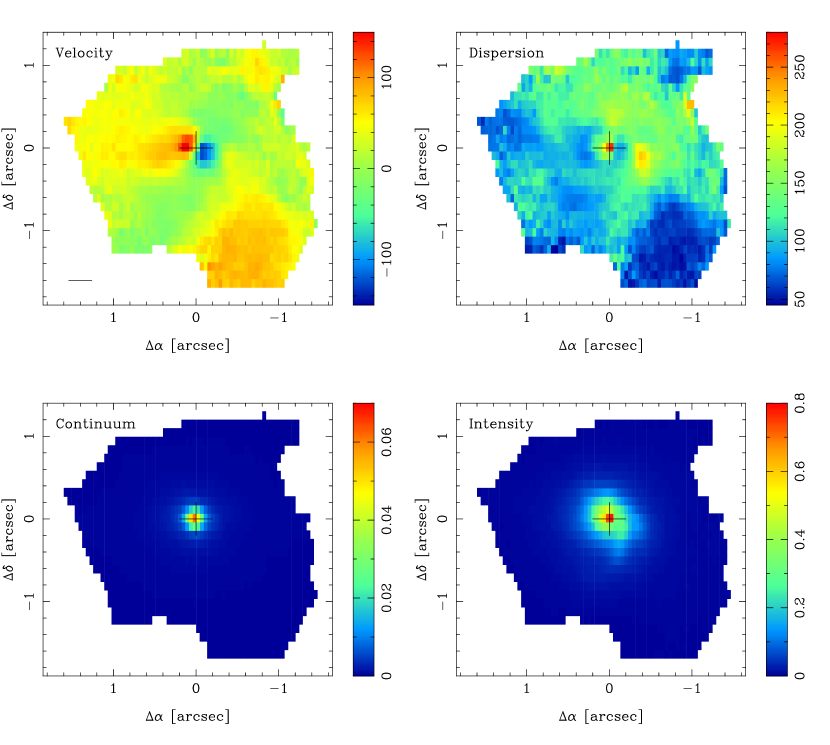
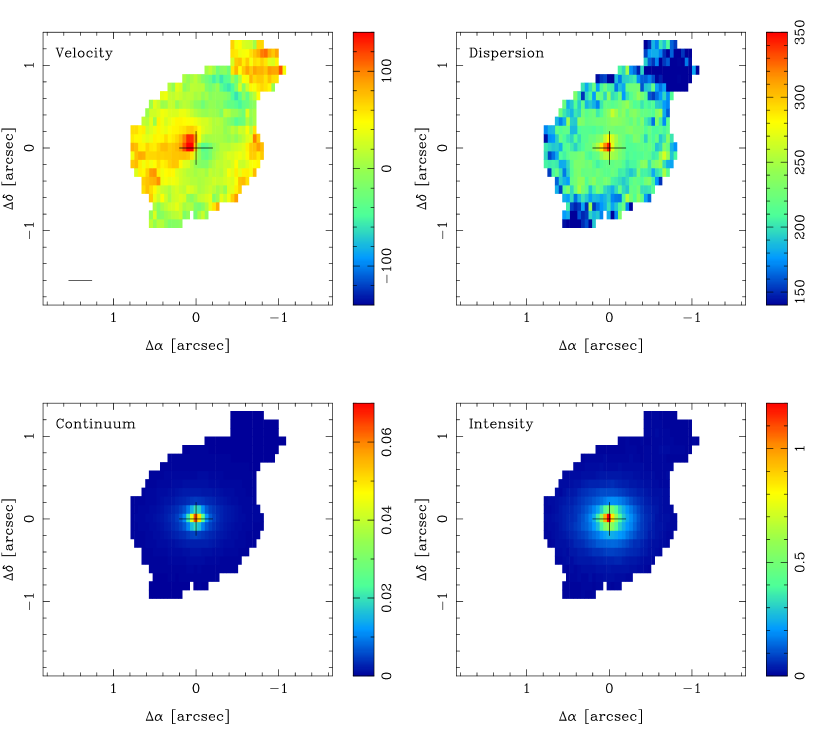
In agreement with the morphological evidence for a circum-nuclear disc from Section 4 and the previous indications for a rotating disc based on the lower-resolution data by Wilman, Edge & Johnstone (2005), the H2 1-0 S(1) 2.122 µm and [\textFe ii] 1.644 µm emission lines show kinematics indicative of disc rotation in the central arcsec ( pc) of NGC 1275. The kinematic maps, based on a single-Gaussian profile fit to the H2 1-0 S(1) 2.122 µm and [\textFe ii] 1.644 µm lines, are shown in Figs 5 and 6. The four panels of each figure show the central velocity (upper left panel), the velocity dispersion (upper right panel), the continuum flux density (lower left panel), and the intensity of the Gaussian fit to the line profile (lower right panel). The scenario of disc rotation is supported by the fact that the redshifted and blueshifted emission of H2 1-0 S(1) 2.122 µm and [\textFe ii] 1.644 µm is symmetrical with respect to the peak in continuum intensity (indicated by the cross in Figs. 5 and 6). In addition, the continuum peak coincides with the line intensity peak and the peak in velocity dispersion of both lines.
A jet-driven origin of the H2 and [\textFe ii] kinematics in the circum-nuclear region can be ruled out, because the major kinematic axis of the proposed disc is perpendicular to the radio jets. The major kinematic axis is found at a position angle of PA=68∘, while the radio jets are located at PA=160∘ (Pedlar et al., 1990). The fact that the two position angles are perpendicular to each other strongly suggests that the observed rotating disc represents the outer parts of an accretion disc and that the jets are ejected along the polar direction. In this case, a disc inclination of about 45∘ can be inferred from the known angle of the radio jets with respect to the line of sight (cf. Wilman, Edge & Johnstone, 2005). Furthermore, since the southern radio jet is, by its brightness, inferred to be pointing towards us, we can conclude that the disc is seen in projection with its northern portions closer to us, and that it is rotating in a counter-clockwise direction.
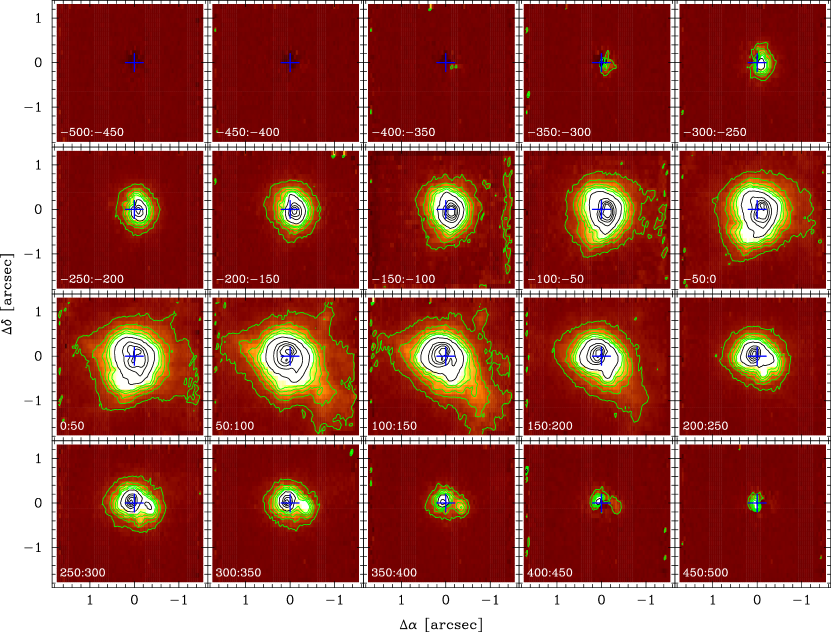
On larger scales the kinematics of H2 1-0 S(1) 2.122 µm and [\textFe ii] 1.644 µm is more complex. Where detected, both lines show a similar line-of-sight velocity field. An exception to this is the region directly south and west of the blueshifted portion of the disc, where the H2 velocity field shows indications of redshifted velocities. The H2 emission from this region is interpreted as a streamer of molecular gas, which is associated with the morphological feature shown in Fig. 4b. The H2 velocity dispersion is characterized by a secondary peak at about 0.4 arcsec west of the nucleus in the upper right panel of Fig. 5. At this position the observed H2 line profile splits into separate kinematic components and becomes double-peaked. Since the single-Gaussian fit is not an appropriate model for these complex line profiles, we show the velocity slices for the H2 emission in Fig. 7. The dominant streamer feature is seen as an extension to the south-west, which is associated with redshifted velocities. As argued in Section 4, we suggest that this represents an infalling stream of molecular gas. In this scenario, the gas stream enters the nuclear region on a retrograde orbit with respect to the sense of rotation of the molecular disc. This is likely to cause shocks and turbulence that lead to energy dissipation in the disc, which may stimulate more rapid gas accretion onto the nucleus of NGC 1275. In addition to this prominent streamer, Fig. 7 shows indications of other streamers which are likely to connect to the filamentary structure around NGC 1275 on larger scales.
A common feature of the kinematic maps in both, H2 1-0 S(1) and [\textFe ii] 1.644 µm emission, is the circular region of redshifted velocities at a distance of about 1.2 arcsec from the nucleus to the north-west. This region is characterized by small velocity dispersions in both lines. With respect to the core, this region is found at a position angle of , which is close to the projected axis of the radio jet at PA=160∘ (Pedlar et al., 1990), (i.e. PA= for the northern radio jet with respect to the core). Since the projected location of this region roughly coincides with the jet axis, this feature may result from a jet-cloud interaction.
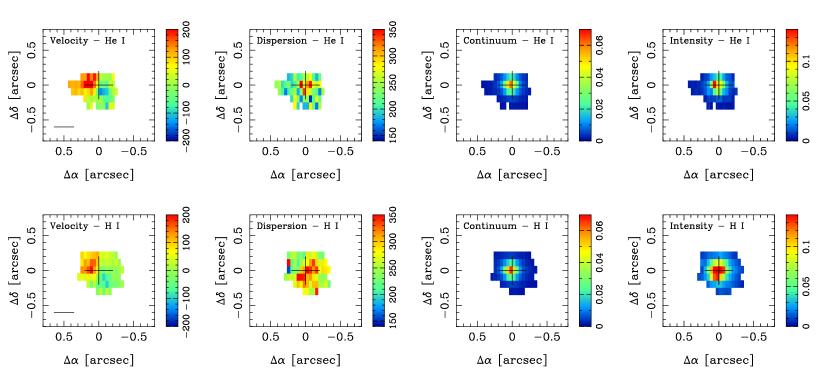
6 IONIZATION STRUCTURE
By comparing the H2 1-0 S(1), [\textFe ii] 1.644 µm \textHe i 2.058 µm and Br emission, we find evidence of an ionization structure within the circum-nuclear disc. H2 1-0 S(1) emission traces the outer regions of the disc and is likely to form a toroid, rather than continuing all the way to the nucleus. We use the dust sublimation radius as an estimate for the innermost radius at which H2 molecules can survive without being dissociated by the nuclear radiation field. A simple estimate of that radius is given by the distance from the core at which the nuclear bolometric luminosity, , is sufficient for heating the dust to its sublimation temperature, :
| (2) |
where is the Stefan-Boltzmann constant. We use as bolometric luminosity of NGC 1275 (Levinson et al., 1995). For a dust sublimation temperature of K (see e.g. Nenkova et al., 2008), the sublimation radius is about 0.1 pc. A larger sublimation radius is possible, if the sublimation temperature is lower: For example, 1 pc corresponds to a local temperature of about 500 K. For the forbidden [\textFe ii] 1.644 µm line, the critical density is of the order of (see Fig. 12). Therefore, the [\textFe ii] 1.644 µm emission becomes less important relative to the permitted lines in the high-density regions closer to the nucleus. The \textHe i 2.058 µm and Br lines, however, are expected to be tracers of the (presumably photoionized) inner portions of the disc as well as, possibly, the outer rim of an inflated disc facing the AGN. Evidence for such a scenario can be found in Fig. 8. This figure shows a single-Gaussian fit to the \textHe i 2.058 µm and Br emission lines in NGC 1275, in direct analogy to Figs 5 and 6 for the H2 1-0 S(1) and [\textFe ii] 1.644 µm emission lines. The \textHe i 2.058 µm and Br emission is slightly extended compared to the -band continuum emission of NGC 1275 (see also Fig. 3), but more compact than the H2 1-0 S(1) and [\textFe ii] 1.644 µm emission. The orientation of the major kinematic axis of the velocity field in \textHe i 2.058 µm and Br matches that of the disc in H2 1-0 S(1) and [\textFe ii] 1.644 µm, suggesting that the \textHe i 2.058 µm and Br emission are associated with the same physical structure as the latter two emission lines. In addition, like H2 1-0 S(1) and [\textFe ii] 1.644 µm, \textHe i 2.058 µm and Br show a peak in velocity dispersion that is centred on the core of NGC 1275. However, the velocity dispersion of \textHe i and Br in the core () is larger than that of H2 1-0 S(1) (). The same result can be deduced from the integrated nuclear spectrum in Fig. 2, where the \textHe i 2.058 µm and Br lines are shown to be broader than the H2 lines (see also FWHM values in Table 1). This larger nuclear velocity dispersion of the \textHe i 2.058 µm and Br emission compared to the H2 emission indicates that the \textHe i and Br emission arises at least partially from the inner portions of the circum-nuclear disc. These inner parts of the disc are expected to be dominated by high gas velocities that manifest themselves in the form of broad line profiles as a consequence of PSF smearing. Fig. 6 shows that the [\textFe ii] 1.644 µm emission in the core of NGC 1275 is also characterized by a larger velocity dispersion – i.e. a broader line profile in Fig. 1 and Table 1 – than the H2 emission. The velocity dispersion displayed by the nuclear [\textFe ii] 1.644 µm emission is comparable to the value found for the \textHe i 2.058 µm and Br emission. This suggests that the core of NGC 1275 on scales smaller than the NIFS resolution also contains [\textFe ii] 1.644 µm-emitting gas with large velocities from ordered or turbulent motion, which may be associated with the disc rotation or with jet-gas interactions.
7 EXCITATION MECHANISMS
The excitation mechanism for the H2 and [\textFe ii] emission in the centre of NGC 1275 is analysed based on the line flux measurements given in Table 1.
7.1 Molecular hydrogen
Krabbe et al. (2000) and, more recently, Wilman, Edge & Johnstone (2005) and Rodríguez-Ardila, Riffel & Pastoriza (2005) have analysed the H2 excitation mechanism in the nucleus of NGC 1275. All find it to be thermally excited. Wilman, Edge & Johnstone (2005) find that the excitation temperature is K from low-excitation transitions, with a higher temperature of K applying to high-excitation lines, while Rodríguez-Ardila, Riffel & Pastoriza (2005) have used the ratio of the H2 lines to determine a vibration temperature of K, and a rotational temperature of K.
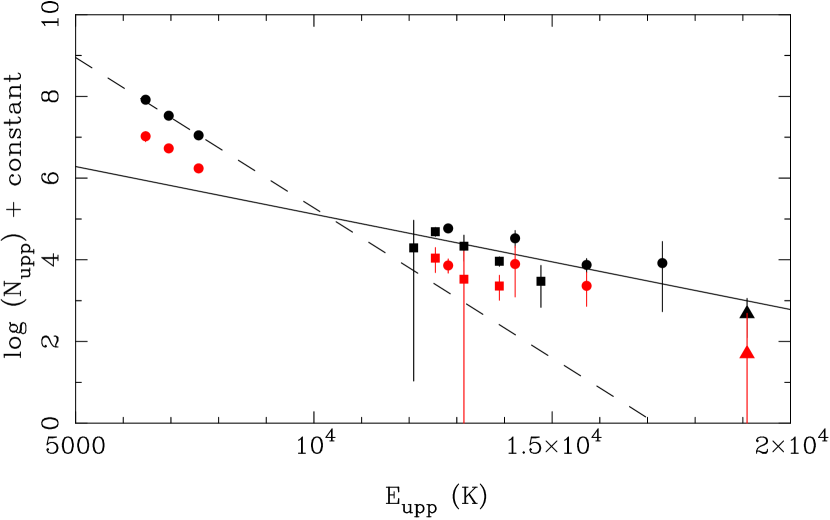
The relative H2 level populations for the central 1.0 arcsec-diameter aperture centred on the nucleus of NGC 1275 are shown in Fig. 9, together with the corresponding measurements for a 0.5–1.0 arcsec-diameter annulus. The level populations are calculated from H2 line fluxes measured from the integrated -band and -band spectra (Figs 1 and 2) and listed in Table 1. At densities above cm-3, the H2 gas is expected to be collisionally excited and so will be in thermal equilibrium. The level populations are then defined by an excitation temperature, , that will be similar to the local gas temperature and can rise to several thousand Kelvin through heating by shocks or UV and X-ray irradiation. The relative level populations are derived by the Boltzman equation such that , where is the line flux, is the line wavelength, is the spontaneous emission coefficient, is the statistical weight of the upper level of the transition, and is the energy of the upper level of the transition. These are plotted in the population diagram in Fig. 9 versus the upper-level energy. Transitions for a gas in thermal equilibrium lie along a straight line in this diagram with a slope of .
As found by Krabbe et al. (2000) and Wilman, Edge & Johnstone (2005), H2 transitions from the core of NGC 1275 with K are characterized by an excitation temperature of K, while transitions from higher energy levels are characterized by a hotter excitation temperature. The dashed straight line in Fig. 9 corresponds to the K value found by Wilman, Edge & Johnstone (2005) for low-energy transitions. Our data are well fit by this temperature, although our low energy data are not as extensive as those of Wilman, Edge & Johnstone (2005) who measured several Q-branch transitions that lie redwards of our spectra. A least-squares fit to only higher energy transitions (K) gives an excitation temperature of K (solid straight line in Fig. 9). Wilman, Edge & Johnstone (2005) derive a comparable value of 3100 K from their data.
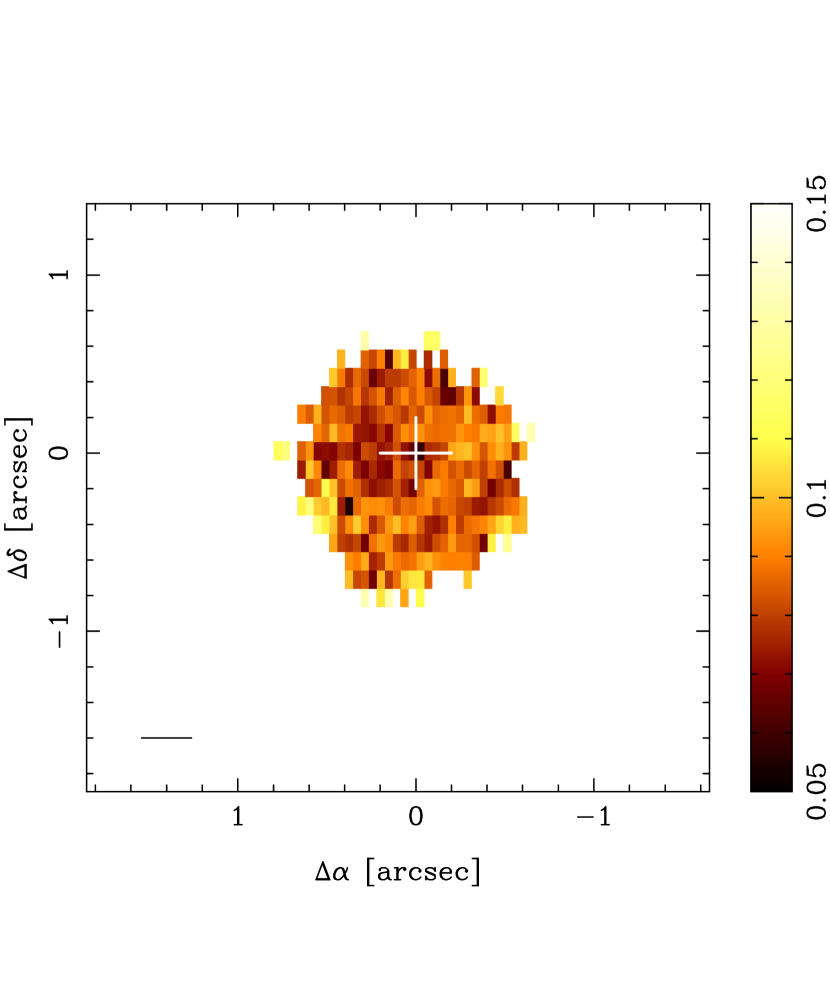
A significant contribution from fluorescent excitation of the H2 emission can be ruled out based on the flux ratio of the high-energy H2 2-1 S(1) line and the low-energy H2 1-0 S(1) line, shown in a pixel-by-pixel comparison in Fig. 10. The ratio is spatially uniform at a value of about 0.08-0.09. Following the diagnostic diagram in fig. 1a of Mouri (1994), this value overlaps with the thermal excitation models but is much lower than the typical value of 0.5-0.6 predicted for fluorescent excitation. Furthermore, the lack of spatial variation in the line ratio over the nuclear region contradicts a scenario with fluorescent excitation. If the higher excitation temperature of the high-energy levels were due to irradiation of the gas by nuclear UV or X-ray photons, this effect would then be expected to be stronger close to the nucleus. In general, no significant change is observed in the behaviour of the high-energy transitions in our data between the 1.0 arcsec-diameter circular aperture and a 0.5–1.0 arcsec-diameter annulus. This can be seen in Fig. 9, where the low- and high-energy transitions corresponding to the annulus (red symbols) display the same slope as those corresponding to the circular aperture (black symbols).
The likely scenario for the excitation of the H2 emission in the nuclear region of NGC 1275 is shocks. In Fig. 11, we compare the two straight lines corresponding to the excitation temperatures of the low and high-energy transitions in our H2 data for NGC 1275 to H2 data for shocked gas in the Orion molecular outflow, taken from Brand et al. (1988). The shocked H2 gas in Orion shows the same properties as our H2 data for NGC 1275 in terms of a higher excitation temperature for higher-energy transitions, presumably arising in post-shock gas having a range of temperatures. A range of excitation temperatures with higher temperatures for higher-energy transitions is also characteristic of the mid-infrared H2 excitation diagrams of NGC 1275 and other H2-luminous radio galaxies, which Ogle et al. (2010) find to be consistent with shock-excitation. Therefore, we conclude that shocks are the dominant excitation mechanism for the H2 emission in the central 1.0 arcsec of NGC 1275.

7.2 [\textFe ii]
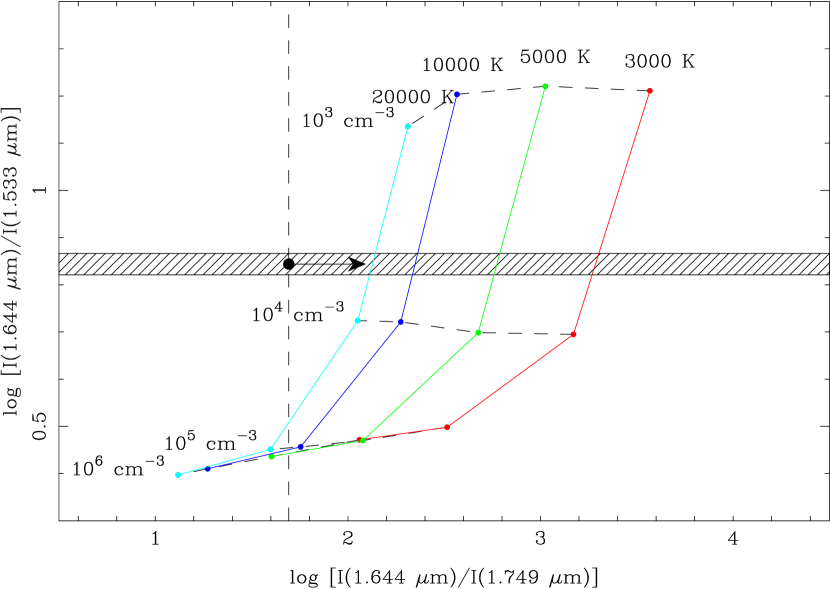
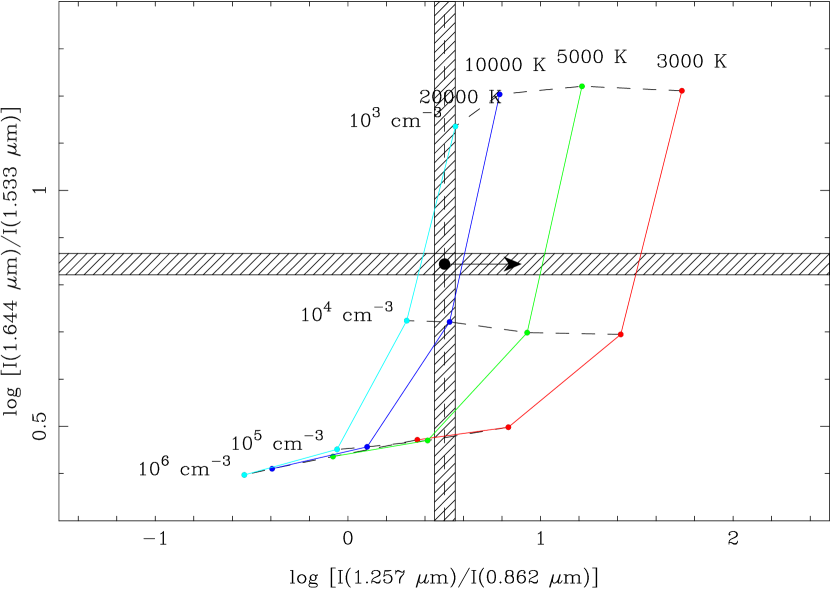
Several authors have attempted to understand the nature of [\textFe ii] excitation in NGC 1275 (e.g. Rudy et al., 1993). The ionization potential of Fe+ (16.2 eV) is similar to that of hydrogen, so [\textFe ii] emission tends to arise in partially ionized regions. Being due to forbidden transitions between low-energy levels, the intensities of the near-infrared [\textFe ii] emission lines are principally dependent on the electron density. Calculations of the statistical equilibrium of collisional and radiative transitions among the lowest 16 levels of \textFe ii have been performed by several authors to study Seyfert galaxies (e.g., Mouri, Kawara, & Taniguchi, 2000; Thompson, 1995) and young stars (e.g., Pesenti et al., 2003; Takami et al., 2006). The energy level diagram for [\textFe ii] has been presented by these authors. Including only the lowest four terms is justified at the electron temperatures involved, which are likely to be and leave higher energy levels significantly less populated. We have repeated this 16-level atom calculation for \textFe ii using level energies from Aldenius & Johansson (2007), radiative transition probabilities from Quinet et al. (1996), (as listed by Aldenius & Johansson, 2007), and collision strengths from Zhang & Pradhan (1995) and Pradhan & Zhang (1993). The model results for a range of [\textFe ii] emission-line combinations are shown in Fig. 12 along with the empirical ratios and their uncertainties for NGC 1275 measured from our integrated nuclear spectrum (Fig. 1). The line ratios indicate a density in the [\textFe ii] region of .

Deriving the electron temperature in the [\textFe ii] region is more difficult. The near-infrared [\textFe ii] lines arise from transitions between the lowest three terms (a6D, a4F, and a4D). The transitions detected in our -band spectra all occur between the a4D and a4F terms and so have a limited range of upper-level energies. The -band transitions of [\textFe ii] (e.g., at 1.257 µm) share the same upper energy levels, so do not provide temperature discrimination. Several authors have suggested using shorter wavelength transitions from the a4P term or longer wavelength transitions between the a4F and a6D terms to constrain the electron temperature in Seyfert galaxies (Mouri, Kawara, & Taniguchi, 2000) and young stars (Nisini et al., 2002; Pesenti et al., 2003). This is the approach that we adopt here.
We begin by using near-infrared transitions from the a4P energy level to constrain the electron temperature. The a4P3/2-a4D7/2 transition occurs at 1.7489 µm in the -band so could make a nearly reddening-independent indicator with the 1.644 µm line. The predicted dependence of this ratio as a function of electron temperature is shown in Fig. 13. In practice, the [\textFe ii] 1.7489 µm line coincides in wavelength with the H2 1-0 S(7) 1.7480 µm line, which is strong in NGC 1275. Consequently, we have assumed that the [\textFe ii] 1.7489 µm line is not detected in our -band spectrum and have defined a 3 upper limit on the 1.644 µm/1.749 µm ratio accordingly. This is indicated in Fig. 13 by the dashed line and solid arrow. This limit does not provide a useful constraint on the electron temperature. The [\textFe ii] a4P3/2-a4F3/2 0.9474 µm line, which has been suggested as an electron temperature indicator for young stars (Nisini et al., 2002), is similarly overwhelmed by strong [\textS iii] 0.9531 µm emission in NGC 1275 (Riffel, Rodríguez-Ardila, & Pastoriza, 2006).
Mouri, Kawara, & Taniguchi (2000) for Seyfert galaxies and Pesenti et al. (2003) for young stars have both suggested using the [\textFe ii] a4P5/2-a4F9/2 0.8619 µm line strength as an indicator of electron temperature. We choose to compare this line to the [\textFe ii] 1.257 µm line. This avoids reddening and aperture size issues to the greatest extent possible. Our model predictions for the dependence of this line strength on electron temperature are shown in Fig. 14. These results are in good agreement with the similar calculation of Mouri, Kawara, & Taniguchi (2000). We use the flux of the [\textFe ii] 1.257 µm line from Riffel, Rodríguez-Ardila, & Pastoriza (2006). A prominent emission line is also present at a rest-frame wavelength of Å in the /-band spectrum of NGC 1275 presented by Riffel, Rodríguez-Ardila, & Pastoriza (2006). The feature is at a significantly different wavelength to the \textO i 8446 Å line seen in several others of their objects and to the closest hydrogen recombination lines (\textH i P13 at 0.8667 µm and P14 at 0.8601 µm), and also the \textCa ii triplet emission at 0.8498, 0.8542, and 0.8662 µm. We estimate the line flux to be erg s-1 cm-2. If this is a detection of the [\textFe ii] line, it indicates that the electron temperature in the [\textFe ii]-emitting region is (Fig. 14). Otherwise, this represents an upper limit to the electron temperature. [\textFe ii] 0.8617 µm emission has been seen previously in the Orion Nebula and in the Seyfert galaxy NGC 4151 (Osterbrock, Shaw, & Veilleux, 1990), which strengthens the case for a detection in NGC 1275.
Possible excitation mechanisms for the [\textFe ii] emission in NGC 1275 are X-ray heating or fast shocks. Mouri, Kawara, & Taniguchi (2000) argue that [\textFe ii] excitation by X-ray heating (i.e., a power-law photoionizing continuum) leads to higher electron temperatures () than shock heating (). To the extent that their models are applicable, the elevated electron temperature in NGC 1275 is more indicative of X-ray heating than shock excitation. The high [\textFe ii] 1.644 µm/\textH i Br 2.166 µm ratio of in NGC 1275 also supports X-ray heating as the dominant excitation mechanism in the nuclear spectrum integrated over a 0.5 arcsec aperture. This ratio is a measure of the relative volumes of the partially-ionized region emitting [\textFe ii] and the fully-ionized region emitting \textH i. It is expected to be in the range 0.1–1.4 in starburst regions (Colina, 1993), but can have values up to in environments where X-rays penetrate deeply into neutral gas (Alonso-Herrero et al., 1997). The high value of this ratio in NGC 1275 and the proximity of the [\textFe ii] emission to the nucleus suggest that this is the process that excites the [\textFe ii] emission in NGC 1275.
We can also use the -band data of Riffel, Rodríguez-Ardila, & Pastoriza (2006) to locate NGC 1275 in the ([\textFe ii] 1.257 µm)/([\textS ii] 1.03 µm) versus ([\textFe ii] 1.533 µm)/([\textFe ii] 1.644 µm) diagram of Pesenti et al. (2003). They propose this as a diagnostic of Fe depletion on dust grains in the jets of young stars. According to table 5 in Riffel, Rodríguez-Ardila, & Pastoriza (2006), the ratio [\textFe ii] 1.257 µm/[\textS ii] µm in NGC 1275 is 0.5. In contrast, Galactic Herbig-Haro objects show a ratio of 3.0 (Pesenti et al., 2003). These data, therefore, suggest that Fe is far more depleted in NGC 1275 than in Galactic Herbig-Haro objects. This is consistent with other estimates for Seyfert galaxies (e.g., Mouri, Kawara, & Taniguchi, 2000) where the strength of the [\textFe ii] emission is interpreted to be primarily due to the ionization conditions, rather than to significant dust grain destruction in shocks.
8 DISCUSSION
8.1 Accretion scenario for the molecular disc
The NIFS data for the circum-nuclear region of NGC 1275 suggest predominantly shock-excited molecular-hydrogen emission. This emission traces a rotating disc, which, according to Wilman, Edge & Johnstone (2005), is likely to be unstable or to have a clumpy structure, as well as one or several streamer-like features. A possible interpretation of these results is an accretion scenario in which gas loses orbital energy as a result of shocks and turbulent dissipation, leading to a net mass inflow and to a net increase in binding energy of the accretion flow. Our model for this scenario is based on the model suggested for the ionized accretion disc in the centre of M87 by Dopita et al. (1997, see their equations (7) and (8)). In this model, at each radius in the accretion flow, the net increase in binding energy is matched by the shock luminosity from radiative losses, :
| (3) |
where is the gravitational potential and is the net mass accretion rate including the inflow rate minus any mass outflow in a disc wind. If the fraction of the total shock luminosity that is radiated into the H2 line is given by , then
| (4) |
First, we consider the case that the gravitational potential in equation (3) is dominated entirely by the central massive object (). In this case, the net gain in binding energy in the accretion flow strongly depends on the radius and increases steeply towards small radii. Combining equations (3) and (4), results in
| (5) |
if we assume that the net mass accretion rate is approximately constant (as is likely in the outer parts of the accretion disc) and also that the ratio for radiation into the line is approximately constant. This means that the radial variation in surface brightness should follow a steep scaling law with radius, proportional to :
| (6) |
The assumption of constant accretion rate and radiative efficiency per H2 molecule is clearly not valid for the innermost parts of the accretion disc. In these regions, presumably, disc winds lower the net rate of mass accretion, H2 molecules are dissociated, and the critical density may be exceeded. All these effects lead to a flattening of the H2 surface-brightness profile at small radii. This can be expressed in the form of a core radius so that
| (7) |
where is the amplitude and is a core radius.
Now, we consider the case that the gravitational potential in equation (3) is dominated entirely by an extended stellar mass distribution. In this case, the enclosed mass at each radius increases with radius. The corresponding gravitational potential will lead to an accretion-powered H2 surface-brightness profile that is flatter than the one in equation (6). As the AGN dominates the near-infrared continuum emission of NGC 1275 in the circum-nuclear region, the detailed stellar distribution within the PSF of the AGN is uncertain. However, in order to illustrate the accretion-flow scenario in a gravitational potential that is purely dominated by the stellar mass distribution, we refer to the stellar mass-distribution model used by Wilman, Edge & Johnstone (2005). Wilman, Edge & Johnstone (2005) fitted the stellar surface-brightness profile, obtained from an HST NICMOS F160W image of NGC 1275, at radii arcsec, excluding the innermost AGN-dominated radii. They find that the stellar surface-brightness profile can be modelled with a modified Hubble profile with a core radius of arcsec. For a constant mass-to-light ratio, the modified Hubble profile corresponds to a deprojected stellar density of
| (8) |
(cf. Wilman, Edge & Johnstone, 2005). Our NIFS observations probe radii which are small compared to the above core radius of arcsec. On these scales, the stellar density from equation (8) is approximately constant with radius (). This means that the enclosed stellar mass increases proportional to and that the gravitational potential is proportional to . According to equations (3) and (4), this type of gravitational potential results in an accretion-powered H2 surface-brightness profile that is constant with radius:
| (9) |
In order to compare the above accretion-flow model for the H2 emission with the data for NGC 1275, we fit the observed H2 surface-brightness profile with a generalized form of equation (7), in which the power-law index is included as a fit parameter:
| (10) |
For , this function is equal to the model for the H2 surface-brightness profile in a gravitational potential that is entirely dominated by the central massive object (equation (7)). For , this function is equal to equation (9), which shows the example of an accretion flow in the gravitational potential of an extended stellar mass distribution. In order to take into account PSF smearing, equation (10) is convolved with the PSF model shown in Fig. 3 before it is fitted to the observed data.
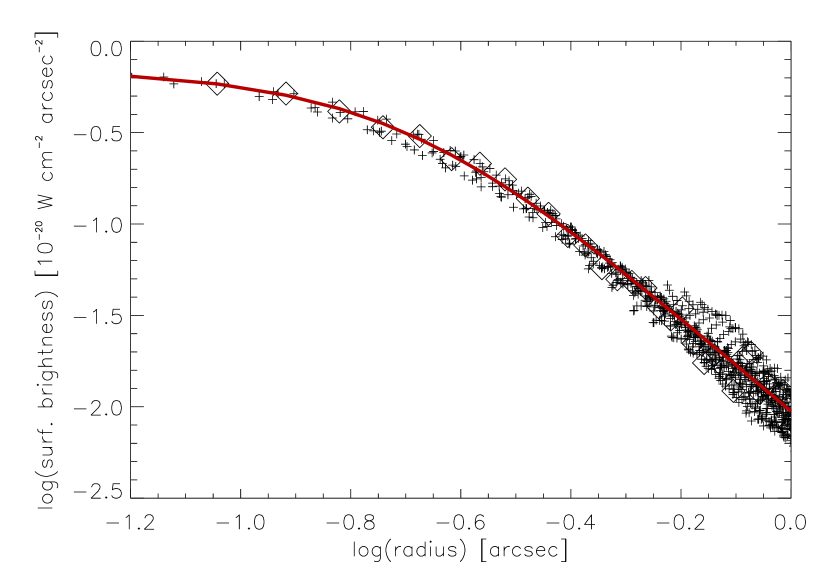
The observed H2 surface-brightness profile for the inner 1 arcsec (358 pc) of NGC 1275 is displayed in Fig. 15. The profile (small plus signs) is measured over an azimuthal range of (in order to avoid the streamer to the south-west of the nucleus) and mapped onto a regular grid in radius via linear interpolation (large diamonds). If the inclination of the H2 disc caused significant projection effects, i.e. if the ellipticity of the isophotes were significant, the measurements for each surface brightness level would be distributed over a range of projected radii. As such projection effects are negligible at arcsec (225 pc) in Fig. 15 (small crosses), we do not deproject the profile. More significant projection effects are only seen at arcsec. But the H2 distribution on these scales is likely to be more complex than the disc configuration inferred from the rotation pattern for pc.
The fit of the PSF-convolved function of equation (10) to the observed H2 surface-brightness profile results in arcsec and (red line in Fig. 15). This profile is slightly flatter than the profile expected for an accretion flow in a gravitational potential dominated by a central point mass. We, therefore, conclude that the observed H2 surface-brightness profile in NGC 1275 is in general agreement with the above accretion-flow model when taking into account that the gravitational potential has contributions from an extended mass distribution in the inner 1 arcsec (358 pc).
Wilman, Edge & Johnstone (2005) estimated that the enclosed stellar mass in NGC 1275 is about 1 per cent of the total dynamical mass at pc (0.14 arcsec). It is therefore negligible on the scales that are characterized by the regular disc rotation (see Section 5). As the surface-brightness profile is fitted up to larger scales, we use the model of Wilman, Edge & Johnstone (2005) in order to deduce that the enclosed stellar mass increases by a factor of ten from pc (0.14 arcsec) to pc (0.3 arcsec) and by a factor of 100 from pc (0.14 arcsec) to pc (0.67 arcsec).
In addition to the stellar mass, the molecular gas mass is likely to contribute significantly to the total mass in the centre of NGC 1275. We derive a tentative estimate for the amount of molecular gas in the central pc of NGC 1275 by comparing our NIFS data to the large-scale H2 1-0 S(1) and CO observations by Lim et al. (2012) and Salomé et al. (2006). Lim et al. (2012) report a total H2 1-0 S(1) flux of the NGC 1275 nebula (nucleus plus filaments) of . According to our NIFS data, of the order of 1 per cent of this flux originate from the central pc. Assuming that this flux ratio translates into a mass ratio and that the same ratio applies to the near-, mid-infrared, and cold molecular gas, we estimate the cold molecular gas mass in the central pc to be about 1 per cent of the total cold molecular gas mass of the NGC 1275 nebula (, Salomé et al., 2006). This results in a cold molecular gas mass of , which is about two orders of magnitude larger than the stellar mass estimate for the same region.
8.2 Disc model and black-hole mass
As the H2 emission in the inner pc of NGC 1275 shows evidence for a rotating disc, the enclosed mass of the disc can be inferred from kinematic modelling. If the potential of the rotating disc is dominated by the central supermassive black hole, the enclosed mass provides a direct estimate of the black-hole mass. For NGC 1275, a black-hole mass estimate of M dex was reported by Wilman, Edge & Johnstone (2005), using the observed jump in H2 velocity across the nucleus as an indication of disc rotation. Their data, based on seeing-limited UIST (UKIRT Imaging Spectrometer) observations, lack the resolution to reconstruct the full two-dimensional intensity and velocity profiles of the disc. Their black-hole mass estimate is, therefore, based on a single value for the nuclear velocity discontinuity of resolved on a radial scale of 50 pc (0.15 arcsec). Another estimate for the black-hole mass of NGC 1275 was given by Bettoni et al. (2003). Using the - relation and a velocity dispersion of , they obtain an indirect mass estimate of .
We have modelled the H2 emission for the inner pc of NGC 1275 three-dimensionally, using a simulated NIFS data cube of a thin, transparent disc of H2 in Keplerian rotation around a central point mass. The model disc is first created in polar coordinates by assigning each radial and azimuthal sampling point a Gaussian line component. The central wavelength of the line component is given by the circular velocity at that radius, as determined from the Keplerian rotation curve. The line width is set to the NIFS spectral resolution of , i.e. the line components are assumed to be intrinsically unresolved. As discussed in Section 8.1, the observed H2 surface-brightness profile does not show any significant projection effects on pc scales. Therefore, we define the line flux at each radius in the face-on disc using equation (10) with the parameters determined from the fit in Fig. 15. The resulting model disc is projected spatially onto an oversampled Cartesian grid of pixels. This step involves summing up all spectra that fall into each pixel for the given input inclination and the input position angle of PA (see Section 5). Finally, in order to simulate the NIFS data, each two-dimensional slice of the model data cube is convolved spatially, using the PSF from Section 3, and rebinned onto the rectangular NIFS pixel scale. The output is a full arcsec2 NIFS data cube of an “observed” model disc.
For the actual comparison between the model and the data via values, we only consider spectral pixels from the central arcsec2 () around the position of the nucleus of NGC 1275 (on which the model disc is centred). This section covers the region with the most regular disc-type velocity field in the observations (see Fig. 5). The surface-brightness profile (Fig. 15) does not show a sharp cut-off at the edges of the kinematically defined disc but rather a smooth decline in H2 surface brightness over the full NIFS field-of-view. Therefore, we use an intrinsic size of the model disc that is much larger than the region and extends well beyond this region for all projection angles considered here. For numerical purposes, the model disc is also truncated at small radii in order to avoid infinite velocities when the radius in the Keplerian disc approaches zero. We choose an inner cut-off radius of 1 pc. This corresponds to the minimum radius at which H2 molecules are likely to survive the nuclear radiation field, as outlined in Section 6.
Fig. 16 shows the values for a comparison between the observed H2 1-0 S(1) lines and a grid of models with varying central mass and intrinsic disc inclination in the central arcsec2 () around the core of NGC 1275. In this figure, the absolute flux scale of each model has been adjusted independently to the value that fits the observed H2 lines in the central arcsec2 best. As an example, the line profiles from one of the best models ( and ) are compared to the observed line profiles in Fig. 17. It is obvious that the observed line profiles in the spectra to the west of the nucleus show a redshifted wing, which is not present in the models for pure disc rotation. This redshifted wing is part of the streamer discussed in Sections 4 and 5.
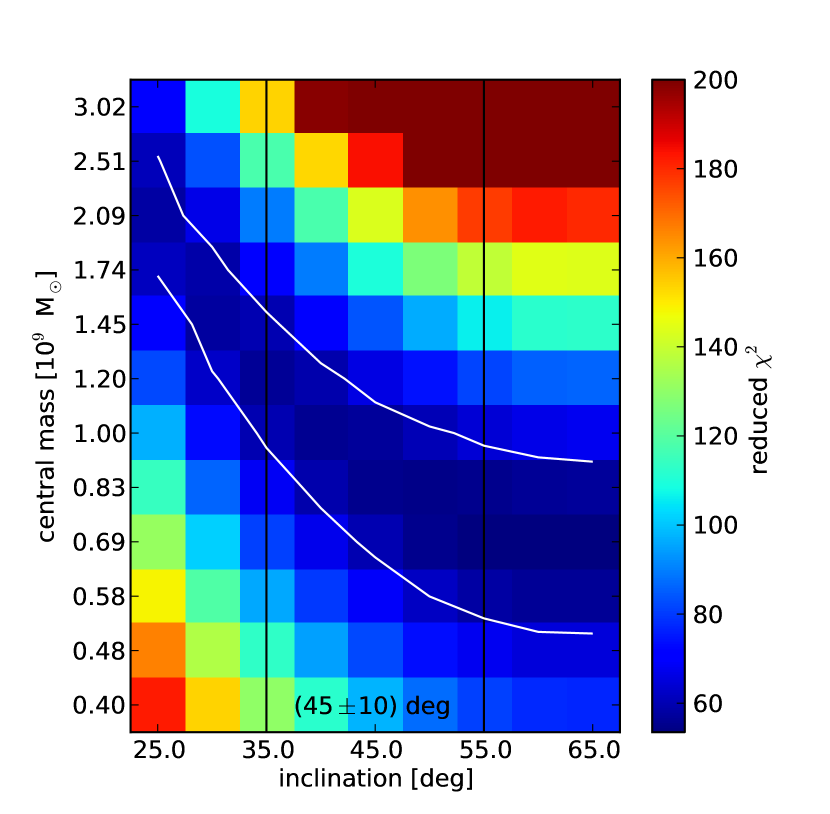
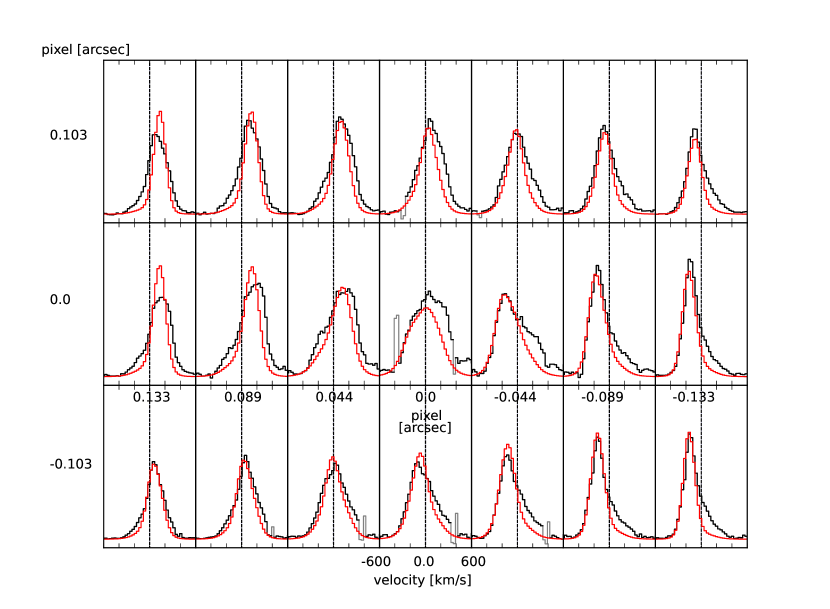
Fig. 16 shows that the enclosed mass of the best-fitting model depends on the disc inclination. This is due to the degeneracy between central mass and inclination in reproducing the same line-of-sight velocities in the Keplerian disc. Small values populate a valley extending from a central mass of about at an inclination of to a central mass of about at an inclination of . The global lower mass limit for the central mass of in Fig. 16 is robust against a possible underestimate of the PSF width in our -band observations. By increasing the FWHM of the model PSF, the best-fitting models at a fixed inclination are shifted toward higher central masses. This is a consequence of enhanced PSF smearing which causes the central velocity gradient in the models to decrease, so that a higher central mass is required in order to fit the observed velocities.
Wilman, Edge & Johnstone (2005) use an inclination of in their estimate for the dynamical mass in NGC 1275. This value is based on the assumption that the disc rotation axis has the same orientation as the axis of the radio jet, which is inclined by - with respect to the line-of-sight (Walker, Romney & Benson, 1994). For a similar disc inclination of , our model suggests a best-fitting central mass of within the contour level shown in Fig. 16. This is larger than the M⊙ derived by Wilman, Edge & Johnstone (2005). This discrepancy is a consequence of mainly two factors: First, the higher resolution NIFS data resolve a larger velocity discontinuity across the nucleus. Secondly, in contrast to the calculation by Wilman, Edge & Johnstone (2005), our three-dimensional analysis takes into account PSF smearing, which leads to a decrease in the observed velocities close to the nucleus. Our value for the central mass is in agreement with the - relation within the rms scatter. Assuming a stellar velocity dispersion of for NGC 1275 (see Bettoni et al., 2003), the updated - relation for all morphological types from Graham et al. (2011), results in , which is consistent with our value within the rms scatter of 0.43 dex reported by Graham et al. (2011).
Wilman, Edge & Johnstone (2005) show that the stellar contribution to the total dynamical mass within pc is negligible and, therefore, argue that the dynamical mass represents the black-hole mass. However, as shown in Section 8.1, we estimate that a large reservoir of molecular gas of the order of is present in the central parts of NGC 1275. This large gas mass could potentially contribute significantly to the derived enclosed mass. In fact, if this gas mass is subtracted from the total enclosed mass of , the resulting black-hole mass of is almost exactly the same as the one derived from the - relation. However, as this result involves large uncertainties, we conclude by merely noting that our estimate of the enclosed mass may rather represent an upper limit for the black-hole mass.
8.3 Comparison to other H2-luminous radio galaxies
Using Spitzer observations of pure rotational H2 transitions in the mid-infrared, Ogle et al. (2010) detect warm molecular hydrogen emission in 30 per cent of their sample of 3C radio galaxies, including NGC 1275. These molecular hydrogen emission galaxies (MOHEGs) are found among radio galaxies of both Fanaroff–Riley classes and among cool core clusters. The sample studied by Ogle et al. (2010) shows that radio MOHEGs as a class typically have low star-formation rates despite the large H2 masses, which indicates that turbulence prevents the gas from efficiently forming stars. Furthermore, most MOHEGs harbour low-luminosity AGN that cannot provide sufficient X-ray heating for powering the observed H2 emission. The AGN in NGC 1275 () belongs to the more X-ray luminous AGN among the radio MOHEGs (cf. fig. 17 and table 9 in Ogle et al., 2010). This means that X-ray heating may make a stronger contribution in NGC 1275 than in many X-ray faint MOHEGs. However, fig. 17 in Ogle et al. (2010) shows that the ratio of the observed warm H2 luminosity to X-ray luminosity for NGC 1275, i.e. , is still a factor of 7 higher than the maximum ratio of 0.01 derived for an X-ray dissociation region. Therefore, even in NGC 1275, X-ray heating by the AGN is unlikely to be the primary excitation mechanism for H2.
Instead, Ogle et al. (2010) conclude that the most likely excitation mechanism for the H2 emission in radio MOHEGs is shocks (or, less likely, cosmic ray heating). The same mechanism is suggested for NGC 1275, based on the NIFS data discussed in this paper (Section 7.1). This raises the question whether these shocks originate from radio-jet feedback, as suggested for the overall sample of radio MOHEGs by Ogle et al. (2010), or from gas accretion, as discussed for the molecular disc in NGC 1275 in Section 8.1. In the feedback scenario, shocks are driven into dense clouds in a porous interstellar medium by the hot cocoon powered by the radio jet, as for example shown in the simulations by Wagner & Bicknell (2011) and Sutherland & Bicknell (2007). In the accretion scenario, gas clumps are repeatedly shocked while falling into the centre of the galaxy so that gravitational potential energy is converted into shocks and turbulent heating. In a case study of 3C 326 N, a radio MOHEG with a very low star-formation rate and an X-ray faint AGN, Ogle et al. (2007) suggest a tidally-induced accretion flow as the most likely origin of the shocks, while Nesvadba et al. (2010) favour the jet feedback scenario.
Simple energy considerations for NGC 1275 show that either of the processes, radio jet feedback or gas accretion, is sufficient to power the observed mid- or near-infrared H2 emission. For the radio jet, Ogle et al. (2010) report a jet cavity power of , which is almost 3 orders of magnitude larger than the luminosity of the warm H2 emission (, cf. Ogle et al., 2010). For the accretion process, we estimate an accretion luminosity of the order of , which is about one order of magnitude larger than the warm H2 luminosity. This accretion luminosity is derived by dividing the potential energy of the infalling gas of about by the dynamical free-fall time of yrs, in analogy to Ogle et al. (2007). For this calculation we assume that the total cold gas mass of (Salomé et al., 2006) falls back from an average distance of 30 kpc into the potential well corresponding to a stellar mass of . This stellar mass is derived from the - relations at by (Bennert et al., 2011), using the from Section 8.2 as the black-hole mass.
As neither jet feedback nor gas accretion stands out as the dominant energy source in NGC 1275, it is likely that the observed properties of gas excitation and kinematics are a consequence of both processes. Rotating molecular discs, as found in the circum-nuclear region of NGC 1275, or on scales of 3 kpc in 3C 326 N (Nesvadba et al., 2011), suggest that accretion processes play a role. Since the radio jet cannot impart angular momentum on a gaseous disc, disc rotation is a sign of gas infall. This gas inflow may be associated with tidal galaxy-galaxy interactions, or with accretion from the halo. These processes have been discussed for the case of 3C 326 N (Ogle et al., 2007; Nesvadba et al., 2010). For NGC 1275, it is most likely that the gas inflows consist of gas which falls back from the radio jet bubbles (Salomé et al., 2008a). Such back flows of gas uplifted during the active jet phase are also seen in simulations (Sutherland & Bicknell, 2007). Tidally-induced gas inflows could result from an interaction with the high-velocity system. But this scenario is less likely, since the high-velocity system is still at a large distance from NGC 1275 (Gillmon et al., 2004).
Observational evidence suggests that turbulence is a common characteristic of the molecular gas component in radio MOHEGs. Nesvadba et al. (2011) found the molecular gas in the disc of 3C 326 N to be highly turbulent with line widths of FWHM . Broad H2 lines are also characteristic of the sample of radio galaxies with fast ionized/atomic outflows, studied by Guillard et al. (2012). Integrated over the full field-of-view, our NIFS data of NGC 1275 show an H2 1-0 S(1) line width of FWHM , which is comparable to the above values. A fraction of this line width is likely to be attributed to ordered streaming motions, which are characterized by small () and largely positive velocities (see Fig. 7). Since the models for the circum-nuclear disc in NGC 1275 (Section 8.2) provide a good representation of the data without including any significant intrinsic line width, the velocity dispersion of the H2 1-0 S(1) lines are likely to be (i.e. FWHM ). (The total widths of the H2 lines in the small-aperture spectra, listed in Table 1, are much larger than that, but are dominated by the disc rotation.) The fact that the dispersion-related line width in the disc is smaller than the total integrated line width in the NIFS field-of-view suggests that the accretion flow is energetically capable of producing the turbulent motions in the disc. Alternatively, the turbulence may be driven by the radio jet and its hot cocoon. Turbulent heating via radio jet feedback can affect a large volume if the gas is distributed in the form of clumps in a porous interstellar medium (Wagner & Bicknell, 2011).
Turbulent heating of the molecular gas component by the jet interaction is only compatible with the observed disc configurations if the jet is, at the same time, inefficient in expelling the molecular gas from the disc. Such a picture is also suggested by the observations by Guillard et al. (2012), who find that in radio galaxies with fast ionized and atomic outflows the bulk of the mid-infrared H2 emission does not participate in the outflow, despite showing signs of turbulent heating. Simulations by Sutherland & Bicknell (2007), which probe the effects of a jet interaction with an almost Keplerian and turbulently supported disc of a warm clumpy interstellar medium in an elliptical galaxy, show that the jet interaction is, indeed, inefficient in driving the gas out of the disc region. However, there is a significant gas transport from the inner to the outer portions of the disc, which will eventually leave the inner portions depleted. If the disc is porous, the mass transfer rates are lower than in the case of a homogeneous disc of gas.
We estimate the porosity of the circum-nuclear disc in NGC 1275 by comparing the observed mean density of H2 molecules in the central pc with the density expected for the corresponding gas component from the ideal equation of state. As shown in Section 8.1, we tentatively estimate the total molecular gas mass within a radius of pc to be . The corresponding mean number density of molecules in the central volume is , where is the proton mass and is approximated by the spherical volume enclosed by a radius of 50 pc. This value is similar to the clump density derived from the ideal equation of state, if we assume that the clumps are composed of cold molecular gas at a mean temperature of K and that they are in pressure equilibrium with the hot ISM pressure of , following the scenario by Wagner & Bicknell (2011). The similarity between the mean observed density and the estimated clump density from the ideal equation of state suggests that the cold molecular gas, if distributed in clumps, is likely to have a high filling factor. An independent measure of the actual gas density is provided by detection experiments for high-density gas tracers. Salomé et al. (2008b) report the detection of HCN(3-2) in the centre of NGC 1275, which indicates a gas density of at least . This value agrees with the mean gas density estimated above. But, as a lower limit for the actual gas density, it does not rule out the possibility of smaller filling factors. Detections of other high-density gas tracers are needed in order to obtain a better estimate of the filling factor.
The relative importance of accretion and jet feedback in exciting and heating the molecular gas in NGC 1275 and other radio MOHEGs is poorly constrained with the current data. Improved observational parameters for the molecular gas phase – e.g., from ALMA observations of high-density tracers – together with refined simulations are required in order to explore the effects of the jet interaction with the interstellar medium in these molecular-hydrogen-rich radio galaxies.
9 SUMMARY AND CONCLUSIONS
The paper is based on near-infrared integral field spectroscopy of NGC 1275, obtained with the NIFS instrument at Gemini North at a spatial resolution of arcsec. We have presented a scenario in which the shock-excited molecular hydrogen, traced via the near-infrared ro-vibrational H2 lines, enters into the circum-nuclear region in the form of one or more streamers and settles into a turbulent, clumpy or unstable accretion disc close to the nucleus, where energy dissipation via turbulence and shocks drives the further accretion process towards the core. The observed disc kinematics has been used as a tool to infer a direct estimate for the central mass enclosed by the disc via model data cubes of discs in Keplerian rotation. We have compared the results to other H2-luminous radio galaxies and discussed the relative importance of jet feedback and accretion as a mechanism for shock-excitation and heating of the molecular hydrogen.
In summary, the main results presented in this paper are:
-
•
The circum-nuclear H2 1-0 S(1) and [\textFe ii] 1.644 µm lines in NGC 1275 show evidence for a disc on pc scales, both in morphology and kinematics. The projected major kinematic axis of this disc is perpendicular to the projected axis of the radio jets.
-
•
A possible ionization structure within the disc is discussed by comparing the H2 1-0 S(1) and [\textFe ii] 1.644 µm emission with the \textHe i 2.058 µm and Br lines. The latter two lines are only found in a compact region around the core, but their kinematics is characterized by the same disc signature as seen in H2 1-0 S(1) and [\textFe ii] 1.644 µm. It is suggested that both the \textHe i 2.058 µm and Br emission lines arise at least partially from the inner parts of the disc, because they display a larger central velocity dispersion than the H2 1-0 S(1) line. Future higher angular resolution observations are required to fully explore this ionization structure.
-
•
The H2 surface-brightness profile in the inner 1 arcsec around the core is well represented by a PSF-convolved profile following an power law with an inner core radius of 0.17 arcsec. This type of surface-brightness profile is found to be in general agreement with an accretion model in which the line emission matches the net increase in binding energy of gas falling into the combined gravitational potential of a central massive object and an extended mass distribution.
-
•
In H2, the data reveal an elongated perturbation to the south-west of the nucleus, which is characterized by redshifted velocities. This perturbation is interpreted as the strongest of several molecular gas streamers, which are likely to be falling into the core.
-
•
The relative line strengths of the ro-vibrational H2 lines in the central 1 arcsec of NGC 1275 indicate thermal excitation of the molecular hydrogen via shocks. In agreement with previous studies, we find excitation temperatures of 1360 K and 4290 K for transitions with K and K, respectively. Any significant contribution from fluorescent excitation can be excluded based on the small ratio of the H2 2-1 S(1) 2.248 µm to the H2 1-0 S(1) 2.122 µm flux and its spatial uniformity over the nuclear region. Instead, the H2 excitation in NGC 1275 shows the same characteristics as shocked gas in the Orion molecular outflow.
-
•
The high electron temperature as well as the high [\textFe ii] 1.644 µm/\textH i Br 2.166 µm suggest that the [\textFe ii] lines in the integrated nuclear spectrum are excited by X-ray heating. Alternatively, the line emission can be excited by fast shocks. Models for a range of [\textFe ii] emission-line ratios are presented. They indicate a density of in the [\textFe ii] emitting region. The electron temperature in this region is less well constraint. Using less certain detections of [\textFe ii] lines at shorter wavelengths from previous publications, an electron temperature of K is estimated.
-
•
An estimate for the mass enclosed by the circum-nuclear H2 disc of NGC 1275 is derived by modelling the data via simulated NIFS data cubes. Assuming a disc inclination of , the enclosed mass is estimated to be . Interpreted as a direct measurement of the black-hole mass, this value is larger than previous black-hole mass estimates, but is consistent with the - relation within the rms scatter. A tentative estimate of the molecular gas mass in the central region of NGC 1275 results in , which is a non-negligible fraction of the enclosed mass. The enclosed mass may, therefore, represent an estimate for the upper limit of the black-hole mass.
-
•
Basic energy considerations show that the shock-excitation and turbulent heating of the molecular gas in NGC 1275 could be driven by the jet interaction, the accretion process, or a mixture of both. An order-of-magnitude estimate of the distribution of the cold molecular gas in the circum-nuclear disc of NGC 1275 indicates a high filling factor. Improved constraints on the properties of the molecular gas phase can be expected from future observations (e.g., ALMA).
ACKNOWLEDGMENTS
We are grateful to the anonymous referee for very useful comments and suggestions. We thank Alex Wagner for a helpful discussion. We acknowledge the tireless efforts of the NIFS team from The Australian National University, Auspace, and the Gemini Observatory who made the NIFS instrument reality. This work is based on observations obtained at the Gemini Observatory, which is operated by the Association of Universities for Research in Astronomy, Inc., under a cooperative agreement with the NSF on behalf of the Gemini partnership: the National Science Foundation (United States), the Science and Technology Facilities Council (United Kingdom), the National Research Council (Canada), CONICYT (Chile), the Australian Research Council (Australia), Ministério da Ciência, Tecnologia e Inovação (Brazil), and the Ministerio de Ciencia, Tecnología e Innovación Productiva (Argentina). J. S., P. J. M., and M. A. D. acknowledge the continued support of the Australian Research Council (ARC) through Discovery projects DP0984657, DP0664434, and DP0342844.
References
- Aldenius & Johansson (2007) Aldenius, M., & Johansson, S. 2007, A&A, 467, 753
- Alonso-Herrero et al. (1997) Alonso-Herrero, A., Rieke, M. J., Rieke, G. H., & Ruiz, M. 1997, ApJ, 482, 747
- Bennert et al. (2011) Bennert, V. N., Auger, M. W., Treu, T., Woo, J.-H., & Malkan, M. A. 2011, ApJ, 742, 107
- Bettoni et al. (2003) Bettoni, D., et al. 2003, A&A, 399, 869
- Brand et al. (1988) Brand, P. W. J. L., Moorhouse, A., Burton, M. G., et al. 1988, ApJ, 334, L103
- Colina (1993) Colina, L. 1993, ApJ, 411, 565
- Conselice, Gallagher & Wyse (2001) Conselice, C. J., Gallagher, J. S. III, & Wyse, R. F. G. 2001, AJ, 122, 2281
- Dopita et al. (1997) Dopita, M. A., et al. 1997, ApJ, 490, 202
- Donahue et al. (2000) Donahue, M., et al. 2000, ApJ, 545, 670
- Fabian (1994) Fabian, A. C. 1994, ARA&A, 32, 277
- Fabian et al. (2000) Fabian, A. C., et al. 2000, MNRAS, 318, L65
- Fabian et al. (2003a) Fabian, A. C., et al. 2003a, MNRAS, 344, L43
- Fabian et al. (2003) Fabian, A. C., Sanders, J. S., Crawford, C. S., et al. 2003b, MNRAS, 344, L48
- Fabian et al. (2008) Fabian, A. C., Johnstone, R. M., Sanders, J. S., et al. 2008, Nature, 454, 968
- Fabian et al. (2011) Fabian, A. C., Sanders, J. S., Williams, R. J. R., et al. 2011, MNRAS, 417, 172
- Ferland et al. (2009) Ferland, G. J., Fabian, A. C., Hatch, N. A., et al. 2009, MNRAS, 392, 1475
- Fischer et al. (1987) Fischer, J., Smith, H. A., Geballe, T. R., Simon, M., & Storey, J. W. V. 1987, ApJ, 320, 667
- Gillmon et al. (2004) Gillmon, K., Sanders, J. S., & Fabian, A. C. 2004, MNRAS, 348, 159
- Graham et al. (2011) Graham, A. W., Onken, C. A., Athanassoula, E., & Combes, F. 2011, MNRAS, 412, 2211
- Guillard et al. (2012) Guillard, P., Ogle, P. M., Emonts, B. H. C., et al. 2012, ApJ, 747, 95
- Kawara & Taniguchi (1993) Kawara, K., & Taniguchi, Y. 1993, ApJ, 410, L19
- Krabbe et al. (2000) Krabbe, A., et al. 2000, A&A, 354, 439
- Levinson et al. (1995) Levinson, A., Laor, A., & Vermeulen, R. C. 1995, ApJ, 448, 589
- Lim et al. (2008) Lim, J., Ao, Y., & Dinh-V-Trung 2008, ApJ, 672, 252
- Lim et al. (2012) Lim, J., Ohyama, Y., Chi-Hung, Y., Dinh-V-Trung, & Shiang-Yu, W. 2012, ApJ, 744, 112
- Lynds (1970) Lynds, R. 1970, ApJ, 159, L151
- McGregor et al. (2003) McGregor, P. J., et al. 2003, SPIE, 4841, 1581, eds. Iye, M. & Moorwood, A. F. M.
- Minkowski (1957) Minkowski, R. 1957, Proc. IAU Symp 4, ed. H. C. Van de Hulst, Cambridge U.Press: Cambridge, p107
- Mirabel, Sanders, & Kazès (1989) Mirabel, I. F., Sanders, D. B., & Kazès, I. 1989, ApJ, 340, L9
- Mouri (1994) Mouri, H. 1994, ApJ, 427, 777
- Mouri, Kawara, & Taniguchi (2000) Mouri, H., Kawara, K., & Taniguchi, Y. 2000, ApJ, 528, 186
- Nenkova et al. (2008) Nenkova, M., Sirocky, M. M., Ivezić, Ž., & Elitzur, M. 2008, ApJ, 685, 147
- Nesvadba et al. (2010) Nesvadba, N. P. H., Boulanger, F., Salomé, P., et al. 2010, A&A, 521, A65
- Nesvadba et al. (2011) Nesvadba, N. P. H., Boulanger, F., Lehnert, M. D., Guillard, P., & Salome, P. 2011, A&A, 536, L5
- Nisini et al. (2002) Nisini, B., Caratti o Garatti, A., Giannini, T., & Lorenzetti, D. 2002, A&A, 393, 1035
- Ogle et al. (2007) Ogle, P., Antonucci, R., Appleton, P. N., & Whysong, D. 2007, ApJ, 668, 699
- Ogle et al. (2010) Ogle, P., Boulanger, F., Guillard, P., et al. 2010, ApJ, 724, 1193
- Osterbrock, Shaw, & Veilleux (1990) Osterbrock, D. E., Shaw, R. A., & Veilleux, S. 1990, ApJ, 352, 561
- Pedlar et al. (1990) Pedlar, A., et al. 1990, MNRAS, 346, 477
- Pesenti et al. (2003) Pesenti, N., Dougados, C., Cabrit, S., et al. 2003, A&A, 410, 155
- Pradhan & Zhang (1993) Pradhan, A. K., & Zhang, H. L. 1993, ApJ, 409, L77
- Prieto (1996) Prieto, A. M. 1996, MNRAS, 282, 421
- Quinet et al. (1996) Quinet, P., Le Dourneuf, M., & Zeippen, C. J. 1996, A&AS, 120, 361
- Riffel, Rodríguez-Ardila, & Pastoriza (2006) Riffel, R., Rodríguez-Ardila, A., & Pastoriza, M. G. 2006, A&A, 457, 61
- Rodríguez-Ardila, Riffel & Pastoriza (2005) Rodríguez-Ardila, A., Riffel, R., & Pastoriza, M. G. 2005, MNRAS, 364, 1041
- Rubin et al. (1977) Rubin, V. C., Oort, J. H., Ford, W. K., Jr., & Peterson, C. J. 1977, ApJ, 211, 693
- Rudy et al. (1993) Rudy, R. J., Cohen, R. D., Rossano, G. S., et al. 1993, ApJ, 414, 527
- Sabra et al. (2000) Sabra, B. M., Shields, J. C., & Filippenko, A. V. 2000, ApJ, 545, 157
- Salomé et al. (2006) Salomé, P., Combes, F., Edge, A. C., et al. 2006, A&A, 454, 437
- Salomé et al. (2008a) Salomé, P., Revaz, Y., Combes, F., et al. 2008a, A&A, 483, 793
- Salomé et al. (2008b) Salomé, P., Combes, F., Revaz, Y., et al. 2008b, A&A, 484, 317
- Salomé et al. (2011) Salomé, P., Combes, F., Revaz, Y., et al. 2011, A&A, 531, A85
- Sanders & Fabian (2007) Sanders, J. S., & Fabian, A. C. 2007, MNRAS, 381, 1381
- Storchi-Bergmann et al. (2009) Storchi-Bergmann, T., et al. 2009, MNRAS, 394, 1148
- Sutherland & Bicknell (2007) Sutherland, R. S., & Bicknell, G. V. 2007, ApJS, 173, 37
- Takami et al. (2006) Takami, M., Chrysostomou, A., Ray, T. P., et al. 2006, ApJ, 641, 357
- Thompson (1995) Thompson, R. I. 1995, ApJ, 445, 700
- Wagner & Bicknell (2011) Wagner, A. Y., & Bicknell, G. V. 2011, ApJ, 728, 29
- Walker, Romney & Benson (1994) Walker, R. C., Romney, J. D., & Benson, J. M. 1994, ApJ, 430, L45
- Wilman, Edge & Johnstone (2005) Wilman, R. J., Edge, A. C. & Johnstone, R. M. 2005, MNRAS, 359, 755
- Wright (2006) Wright, E. L. 2006, PASP, 118, 1711
- Unger et al. (1990) Unger, S. W., Taylor, K., Pedlar, A., et al. 1990, MNRAS, 242, 33P
- Zhang & Pradhan (1995) Zhang, H. L., & Pradhan, A. Z. 1995, A&A, 293, 953