Associated 21-cm absorption towards the cores of radio galaxies
Abstract
We present the results of Giant Metrewave Radio Telescope (GMRT) observations to detect Hi in absorption towards the cores of a sample of radio galaxies. From observations of a sample of 16 sources, we detect Hi in absorption towards the core of only one source, the FR II radio galaxy 3C 452 which has been reported earlier by Gupta & Saikia (2006a). In this paper we present the results for the remaining sources which have been observed to a similar optical depth as for a comparison sample of compact steep-spectrum (CSS) and giga-hertz peaked spectrum (GPS) sources. We also compile available information on Hi absorption towards the cores of extended radio sources observed with angular resolutions of a few arcsec or better. The fraction of extended sources with detection of Hi absorption towards their cores is significantly smaller (7/47) than the fraction of Hi detection towards CSS and GPS objects (28/49). For the cores of extended sources, there is no evidence of a significant correlation between Hi column density towards the cores and the largest linear size of the sources. The distribution of the relative velocity of the principal absorbing component towards the cores of extended sources is not significantly different from that of the CSS and GPS objects. However, a few of the CSS and GPS objects have blue-shifted components 1000 km s-1, possibly due to jet-cloud interactions. With the small number of detections towards cores, the difference in detection rate between FR I (4/32) and FR II (3/15) sources is within the statistical uncertainties.
keywords:
galaxies: active – galaxies: evolution – galaxies: nuclei – galaxies: jets – radio lines: galaxies1 Introduction
| Source | Alt. | Redshift | S1.4 | P1.4 | Type | LAS | LLS | LAS | VLBI |
|---|---|---|---|---|---|---|---|---|---|
| name | name | mJy | 1025 | ref. | ref. | ||||
| (mJy) | (W Hz-1) | (′′) | (kpc) | ||||||
| (1) | (2) | (3) | (4) | (5) | (6) | (7) | (8) | (9) | (10) |
| J0209+3547 | 4C+35.03 | 0.0377 | 2087 | 0.70 | FR I | 83 | 61 | 0 | 1 |
| J0223+4259 | 3C 66B | 0.0213 | 6217 | 0.65 | FR I | 678 | 288 | 1 | 2 |
| J0313+4120 | S4 | 0.1340 | 487 | 2.38 | FR II | 570 | 1340 | 2 | 3 |
| J0334+3921 | 4C+39.12 | 0.0206 | 1183 | 0.12 | FR I | 402 | 165 | 1 | 2 |
| J0418+3801 | 3C 111 | 0.0485 | 15121 | 8.59 | FR II | 195 | 182 | 0 | 4 |
| J0656+4237 | 4C42.22 | 0.0590 | 937 | 0.80 | FR I | 67 | 76 | 0 | - |
| J0748+5548 | DA240 | 0.0357 | 2237 | 0.67 | FR II | 2040 | 1428 | 3 | 5 |
| J0758+3747 | 3C 189 | 0.0428 | 2637 | 1.16 | FR I | 144 | 120 | 0 | 2 |
| J1147+3501 | 0.0631 | 815 | 0.80 | FR I | 780 | 936 | 4 | 2 | |
| J1628+3933 | 3C338 | 0.0304 | 3595 | 0.78 | FR I | 112 | 67 | 0 | 2 |
| J1744+5542 | NGC6454 | 0.0312 | 810 | 0.18 | FR I | 200 | 123 | 5 | 3 |
| J1835+3241 | 3C 382 | 0.0579 | 5548 | 4.55 | FR II | 171 | 189 | 6 | 2 |
| J1836+1942 | PKS | 0.0161 | 1458 | 0.09 | FR I | 316 | 102 | 1 | - |
| J1842+7946 | 3C390.3 | 0.0555 | 11537 | 8.73 | FR II | 235 | 250 | 0 | 6 |
| J2245+3941 | 3C 452 | 0.0811 | 10383 | 17.25 | FR II | 256 | 386 | 7 | 2 |
| J2338+2701 | 3C465 | 0.0302 | 7590 | 1.63 | FR I | 487 | 290 | 1 | 7 |
Column 1: source name; column 2: alternative name; column 3: redshift ; column 4: flux density at 1.4 GHz in mJy; column 5: luminosity at 1.4 GHz; column 6: radio morphology i.e. FR I or FR II; columns 7 and 8: largest projected angular (LAS) and linear (LLS) size in arcsec and kpc respectively, where LAS has been estimated from the outer hotspots in the FR II sources, and from the outermost contours in the FR I sources; column 9: references for the LAS; column 10: references for the VLBI structure.
References for the largest angular sizes – 0: This paper; 1: NRAO VLA Sky Survey (NVSS; Condon et al. 1998); 2: de Bruyn (1989); 3: Willis, Strom & Wilson (1974); 4: Giovannini et al. (1999); 5: Bridle & Fomalont (1978); 6: Leahy & Perley (1991); 7: Gupta & Saikia (2006a)
All red-shift information is from NED (NASA Extragalactic Database) except for J1744+552 and J1842+7946. The redshift for J1744+552 has been taken from Bridle & Fomalont (1978) and for J1842+7946 has been taken from Eracleous & Halpern (2004).
Flux densities at 1.4 GHz are determined using the maps from NVSS ; Luminosities have been calculated from these flux densities assuming a spectral index of 1.
References for the VLBI structure: 1: Lara et al. (1997); 2: Giovannini et al. (2001); 3: Britzen et al. (2007); 4: Linfield (1987); 5: Saripalli et al. (1997); 6: Alef et al. (1996); 7: Venturi et al. (1995)
It is widely believed that the source of energy of active galactic nuclei (AGN) is the accretion of matter onto a supermassive black hole with an accretion disk, located in the centre of the galaxy. While there have been many theoretical and numerical studies of accretion flows (e.g. Hawley 2011), observational studies of the gaseous components in the circumnuclear regions could provide useful insights towards understanding the dynamics and properties of the gas that might be fuelling the AGN. At radio frequencies an important method of probing this region is via 21-cm Hi absorption towards compact radio sources, such as the cores of radio galaxies and quasars, and the compact steep-spectrum (CSS) and gigahertz peaked-spectrum (GPS) sources. The CSS and GPS objects (O’ Dea 1998) typically have sizes of 10 and 1 kpc respectively, and are believed to be the young (105 yr) progenitors of the larger radio galaxies and quasars which extend up to a few Mpc, with the largest sources being typically 108 yr old (Jamrozy et al. 2008; Konar et al. 2008). Such studies could also help us study the evolution of the gaseous component with the age of the radio source and also test consistency of these properties with the unified schemes for AGN (Pihlström, Conway & Vermeulen 2003; Gupta & Saikia 2006b; Curran & Whiting 2010).
Studies of Hi absorption towards radio galaxies and quasars have shown that the absorption lines are more often detected towards CSS and GPS objects, with previous studies (Pihlström, Conway & Vermeulen 2003; Gupta et al. 2006; Chandola, Sirothia & Saikia 2011) showing an apparent anti-correlation between the integrated optical depth and source size. For an assumed fixed value of the covering fraction and spin temperature this corresponds to an anti-correlation with the neutral hydrogen column density. Gupta & Saikia (2006b) found the 21-cm absorption detection rate to be higher towards the CSS and GPS sources identified with galaxies than with quasars. They find that there is a tendency for the detection rate as well as the column density for galaxies to increase with core prominence, a statistical indicator of the orientation of the jet axis to the line of sight. This can be understood in a scenario where radio sources are larger than the scale of the circumnuclear Hi disk so that the lines of sight to the lobes at very large inclinations do not intersect the disc. On the other hand, Curran & Whiting (2010) and more recently Allison et al. (2012) have investigated the effect of UV luminosity on the 21-cm absorption detection rate. They found that after excluding the sources with UV luminosities, 1023 W Hz-1, the 21-cm absorption detection rate for compact radio sources is only marginally higher than for other radio sources. Curran & Whiting suggest that higher 21-cm absorption detection rate amongst compact objects is probably due to their generally low UV luminosity rather than their compact sizes or orientation.
Compared with the studies of Hi absorption towards CSS and GPS objects, the extended radio sources have received less attention. However, there have been a few notable exceptions like van Gorkom et al. (1989), Morganti et al. (2001), and more recently Emonts et al. (2010). To understand any evolution in the Hi component of the circumnuclear gas as the radio source grows from the GPS and CSS scales to larger dimensions, it is necessary to probe the gas on similar scales from radio observations probing the compact regions with comparable optical depths. This can be achieved via 21-cm Hi observations towards the radio cores of large radio sources with resolutions of about a few arcsec or better so that the core is resolved from the more extended emission and can be unambiguously identified. Such observations will also enable us to determine any differences in the Hi properties of FR I and FR II sources. There have been suggestions that the mode of fuelling the nucleus and the structure of the torus/disk may be different for the FR I and FR II radio sources, with those in FR Is being geometrically thin (e.g. Morganti et al. 2001).
In this paper we present the results of 21-cm Hi absorption observations towards the cores of FR I and FR II radio galaxies with the Giant Metrewave Radio Telescope (GMRT), and combine our results with those in the literature to examine any evolution in the Hi properties in the circumnuclear region with source size. Possible differences between FR I and FR II radio galaxies, and the distribution of the velocities of the absorbing components relative to the systemic velocities have also been examined. The observations are described in Section 2. The discovery of 21-cm absorption towards the core of the FR II radio galaxy J2245+3941 (3C 452), which is a part of our sample, has been reported earlier (Gupta & Saikia 2006a). In this paper we present the results for the remaining fifteen sources. In Section 3 we combine our results with those of similar searches and discuss the statistical trends in gas properties with respect to radio-source characteristics. The results are summarized in Section 4.
2 Observations
| Source | Date | Obs. freq | BW | tint | Beam | Comp. | Peak flux | (Hi) | ||
|---|---|---|---|---|---|---|---|---|---|---|
| (MHz) | (MHz) | (hrs) | ( ∘) | (mJy/b) | (mJy/b) | (10 | (1020cm-2) | |||
| (1) | (2) | (3) | (4) | (5) | (6) | (7) | (8) | (9) | (10) | (11) |
| J0209+3547 | 2006 Jan | 1368.76 | 4 | 3.5 | 2.411.91 +20 | Core | 102 | 0.91 | 26.7 | 5.15 |
| J0223+4259 | 2006 Jan | 1390.84 | 4 | 4.6 | 2.642.25 83 | Core | 170 | 1.10 | 19.5 | 3.77 |
| J0313+4120 | 2004 Jan | 1252.56 | 8 | 3.0 | 2.622.15 53 | Core | 383 | 1.12 | 8.7 | 1.68 |
| J0334+3921 | 2006 Jan | 1391.75 | 4 | 4.9 | 2.701.99 +53 | Core | 304 | 0.85 | 8.4 | 1.62 |
| J0418+3801 | 2006 Jan | 1354.70 | 4 | 5.2 | 3.152.38 +34 | EHS | 1393 | 0.90 | 2.1 | 0.41 |
| Core | 1103 | 1.05 | 3.0 | 0.58 | ||||||
| WHS | 250 | 1.03 | 12.3 | 2.37 | ||||||
| J0656+4237 | 2010 Jan | 1341.27 | 4 | 4.9 | 3.632.80 +64 | Core | 224 | 0.53 | 6.9 | 2.95 |
| J0748+5548 | 2010 Jan | 1371.49 | 4 | 4.4 | 2.702.16 +25 | Core | 209 | 0.38 | 5.4 | 2.78 |
| J0758+3747 | 2006 Jan | 1362.06 | 4 | 5.2 | 3.122.07 +43 | Core | 184 | 1.01 | 16.5 | 3.19 |
| J1147+3501 | 2010 Jan | 1336.06 | 4 | 4.4 | 3.692.38 +38 | Core | 351 | 0.57 | 4.8 | 1.96 |
| J1628+3933 | 2010 Jan | 1378.56 | 4 | 4.8 | 3.422.17 +61 | EP | 67.6 | 0.93 | 41.4 | 7.99 |
| Core | 179 | 1.14 | 19.2 | 3.70 | ||||||
| WP | 69.5 | 0.76 | 32.7 | 6.32 | ||||||
| J1744+5542 | 2010 Jan | 1377.43 | 4 | 4.0 | 4.243.18 75 | Core | 313 | 1.18 | 11.4 | 2.20 |
| J1835+3241 | 2006 Mar | 1342.70 | 4 | 4.5 | 2.682.10 +35 | EHS | 203 | 1.05 | 15.6 | 3.01 |
| Core | 240 | 1.17 | 14.7 | 2.84 | ||||||
| WHS | 37 | 1.12 | 90 | 17.4 | ||||||
| J1836+1942 | 2004 Jan | 1397.84 | 4 | 2.0 | 3.042.10 70 | Core | 224 | 2.10 | 28.2 | 5.44 |
| J1842+7946 | 2010 Jan | 1345.72 | 4 | 4.9 | 3.882.32 +17 | NHS | 177 | 1.02 | 17.4 | 3.34 |
| Core | 165 | 1.15 | 18.9 | 4.02 | ||||||
| SHS | 839 | 1.90 | 6.9 | 1.31 | ||||||
| J2245+3941∗ | 2005 Dec | 1313.85 | 4 | 5.6 | 3.142.25 +52 | EHS | 94 | 1.10 | 35.1 | 6.77 |
| Core | 194 | 1.00 | 58.0 | 6.39 | ||||||
| WHS | 128 | 1.10 | 25.8 | 4.98 | ||||||
| J2338+2701 | 2004 Jan | 1378.74 | 4 | 4.0 | 2.892.24 50 | Core | 302 | 1.63 | 16.2 | 3.13 |
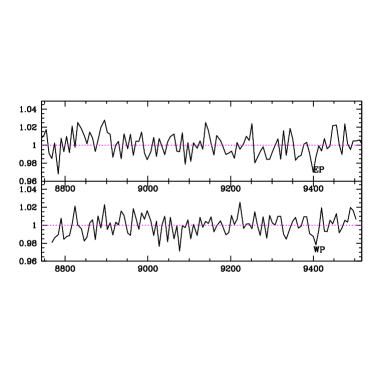
Column 1: source name; column 2: year and month of observations; column 3: redshifted 21-cm frequency; column 4: baseband bandwidth (BW); column 5: observing time in hr (excluding calibration overheads); columns 6, 7 and 8: restoring beam, radio component (EHS = eastern hotspot, WHS = western hotspot, NHS = northern hotspot, SHS = southern hotspot, EP = eastern peak, WP = western peak and Core= radio core) and peak brightness in mJy/beam for the continuum image made using line-free channels respectively; column 9: rms noise in the spectrum; column 10: optical depth estimate, and column 11: Hi column density in units of 1020 cm-2, assuming =100 K and a covering factor, of unity; upper limits are 3 values, assuming =100 km s-1.
∗ The 21-cm absorption towards J2245+3941 (3C 452) has velocity of 2.8 km s-1 relative to its optical systemic velocity.
Table 1 lists the 16 FR I and FR II radio galaxies which we observed with the GMRT over the period of 20042010. Table 1 also lists some of their observed properties. With the available observing time, these 16 were selected largely from the 3CR and B2 samples to have a core flux density at 1400 MHz 100 mJy with resolutions of a few arcsec or better so that the core could be distinguished from the more extended bridge/jet emission. The 16 sources observed with the GMRT consist of 10 FR I and 6 FR II radio sources. Their projected linear sizes range from 61 kpc to as large as 1.4 Mpc (71 km s-1 Mpc-1, 0.27, 0.73; Spergel et al. 2003).
The observations were made with a baseband bandwidth (BB BW) of 4 MHz (velocity range 800 km s-1) split into 128 channels (resolution 7 km s-1) , except for J0313+4120 for which a BB BW of 8 MHz (resolution 15 km s-1) was used (see Table 2). For the observations of J2245+3941 (3C 452) on 2005 Dec 11 the then new high-resolution mode (resolution 3.6 km s-1) of the GMRT correlator was used (cf. Gupta & Saikia 2006a). The expected redshifted 21-cm frequency was placed at the centre of the BB BW by tuning the local oscillator chain. The standard flux density and bandpass calibrators (3C 48, 3C 147 and 3C 286) were usually observed every three hours to correct for variations in amplitude and bandpass. Observations of the target source were preceded and followed by observations of a phase calibrator, a compact radio source, typically every 35 min.
The Astronomical Image Processing System (AIPS) package was used to reduce the data. After flagging bad data, including those affected by Radio Frequency Interference (RFI), and calibrating the data, a continuum image of the source was made by averaging 60 line-free channels. The images were made with the highest resolution, which was typically 2 arcsec with the GMRT at L-band, because of our interest in detecting absorption towards the compact components such as the radio cores. The data were self-calibrated to produce a satisfactory continuum image; after which the complex gains were applied to all the frequency channels and the continuum image was subtracted from the visibility data cube. Spectra were extracted at the pixels of maximum brightness in the cores and the hot-spots. This was done independently for both Stokes RR and LL to check for consistency. The two polarization channels were later combined to produce the final Stokes I spectrum which was shifted to the heliocentric frame. The results for all the 16 sources, including the radio galaxy J2245+3941 (3C 452) are summarised in Table 2.
| Source | Alt. | Redshift | S1.4 | P1.4 | LAS | LLS | LAS | VLBI | Type | (Hi) | Vshift | Ref. |
|---|---|---|---|---|---|---|---|---|---|---|---|---|
| name | name | 1025 | ref. | ref. | 1020 | |||||||
| (mJy) | (W Hz-1) | (′′) | (kpc) | (cm-2) | (km s-1) | |||||||
| (1) | (2) | (3) | (4) | (5) | (6) | (7) | (8) | (9) | (10) | (11) | (12) | (13) |
| J00370109 | 3C15 | 0.0730 | 4092 | 5.46 | 33.7 | 46 | 1 | - | FR II | 0.50 | M | |
| J0055+3021 | NGC315 | 0.0165 | 2371 | 0.15 | 3480 | 1152 | 2 | 1 | FR I | 7.0 | 462 | E |
| J00570123 | 3C29 | 0.0450 | 5354 | 2.60 | 139 | 121 | 1 | - | FR I | 9.39 | M | |
| J0107+3224 | 3C31 | 0.0169 | 4757 | 0.31 | 900 | 305 | 3 | 1 | FRI | 0.6 | E | |
| J01260120 | 3C40 | 0.0180 | 3879 | 0.29 | 339 | 122 | 1 | - | FR I | 4.50 | M | |
| J0308+0406 | 3C78 | 0.0287 | 7360 | 1.42 | 210 | 119 | 4 | 2 | FR I | 0.73 | M | |
| J0329+3947 | - | 0.0243 | 1419 | 0.20 | 386 | 186 | 5 | 3 | FRI | 2.8 | E | |
| J0331+0233 | 3C88 | 0.0302 | 5030 | 1.08 | 191 | 114 | 1 | - | FR II | 5.06 | M | |
| J04295349 | - | 0.0399 | 5830∗ | 2.21 | 276 | 215 | 6 | - | FR I | 11.46 | M | |
| J05194546 | PicA | 0.0351 | 66000∗ | 19.24 | 458 | 316 | 7 | 4 | FR II | 2.43 | M | |
| J06215241 | MRC | 0.0511 | 3400∗ | 2.15 | 47.7 | 47 | 1 | 5 | FR I | 3.60 | M | |
| J0927+2955 | - | 0.0253 | 297 | 0.04 | 747 | 376 | 8 | - | FRI | 69 | E | |
| J1006+3453 | 3C236 | 0.1005 | 4645 | 12.07 | 2307 | 4221 | 9 | 6 | FR II | 3.7 | 162 | G |
| J1111+2657 | NGC3563 | 0.0331 | 99 | 0.03 | 72 | 47 | 10 | - | FRI | 3.7 | E | |
| J1145+1936 | 3C264 | 0.0217 | 5494 | 0.60 | 540 | 234 | 11 | 7 | FR I | 1.54 | G | |
| J1230+1223 | M87 | 0.0044 | 153420 | 0.67 | 896 | 81 | 12 | 8,9 | FR I | 1.35 | G | |
| J12541233 | 3C278 | 0.0150 | 7622 | 0.39 | 128 | 38.7 | 13 | 10,11 | FR I | 12.32 | M | |
| J13214342 | NGC5090 | 0.0114 | 5860∗ | 0.17 | 770 | 177 | 9 | 5 | FR I | 2.70 | 4 | M |
| J1323+3133 | NGC5127 | 0.0162 | 741 | 0.04 | 688 | 223.6 | 10 | 1 | FRI | 4.9 | 33 | E |
| J1324+3622 | NGC5141 | 0.0174 | 886 | 0.06 | 52 | 18.15 | 14 | - | FRI | 3.0 | 134 | E |
| J13363356 | IC4296 | 0.0125 | 11960∗ | 0.43 | 1869 | 470.9 | 1 | 5 | FR I | 7.43 | M | |
| J1516+0701 | 3C317 | 0.0345 | 5608 | 1.57 | 41.4 | 28.0 | 1 | 5 | FR I | 1.74 | G | |
| J1632+8232 | NGC6251 | 0.0247 | 2201 | 0.31 | 3150 | 1547 | 15 | 12,13 | FR I | 2.51 | G | |
| J16447715 | MRC | 0.0427 | 6500∗ | 2.79 | 259.8 | 215.9 | 1 | - | FR II | 8.63 | M | |
| J17200058 | 3C353 | 0.0304 | 54835 | 11.84 | 252.9 | 151.7 | 1 | 12 | FR II | 42 | 100 | M |
| J1806+6949 | 3C371 | 0.0510 | 2138 | 1.35 | 280 | 275 | 16 | 14 | FR I | 2.90 | G | |
| J1952+0230 | 3C403 | 0.0590 | 5855 | 5.00 | 98.5 | 111 | 17 | - | FR II | 17.82 | M | |
| J2118+2626 | NGC7052 | 0.0156 | 212 | 0.01 | 149 | 46.6 | 18 | - | FRI | 2.4 | E | |
| J21576941 | PKS | 0.0283 | 30390∗ | 5.66 | 78.8 | 47.3 | 19 | 15 | FR II | 1.90 | M | |
| J22230206 | 3C445 | 0.0559 | 5405 | 4.10 | 570.0 | 611.0 | 20 | - | FR II | 8.06 | M | |
| J2231+3921 | 3C449 | 0.0171 | 2847 | 0.19 | 1500 | 514.5 | 3 | - | FRI | 1.2 | E |
Column 1: source name; column 2: alternative name; column 3: redshift; column 4: 1.4GHz flux density column 5: 1.4GHz luminosity in the rest frame of the source; columns 6 & 7: largest projected angular (LAS) and linear (LLS) size in arcsec and kpc respectively; column 8: references for the LAS; column 9: references for the VLBI structure; column 10: radio morphology classification; column 11: Hi column density or a 3 upper limit to it; column 12: the shift of the primary Hi component relative to the systemic velocity as measured from the optical emission lines, with a negative sign indicating a blue-shift, and column 13: references for the Hi observations.
References for the LAS: 1:Morganti et al. (1993); 2: Bridle et al. (1976); 3: Andernach et al. (1992); 4: Saikia et al. (1986); 5: Bridle et al. (1991); 6: Jones & McAdam (1992); 7: Perley, Roser & Meisenheimer (1997); 8: Ekers et al. (1981); 9: Mack et al. (1997); 10: Parma et al. (1986); 11: Gavazzi, Perola & Jaffe (1981); 12: Owen, Eilek & Kassim (2000); 13: Baum et al. (1988); 14: Fanti et al. (1986); 15: Perley, Bridle & Willis (1984); 16: Wrobel & Lind (1990); 17: Dennett-Thorpe et al. (1999); 18: Morganti et al. (1987); 19: Fosbury et al. (1998); 20: Leahy et al. (1997)
References for Hi observations: M: Morganti et al. (2001); G: van Gorkom et al. (1989); E: Emonts et al. (2010)
Flux densities at 1.4 GHz are determined using maps from NVSS except the sources with ∗, values for which are from Wall & Peacock (1985); Luminosities have been calculated from these flux densities assuming spectral index of 1.
References for the VLBI structure: 1: Giovannini et al. (2001) ; 2: Jones (1984); 3: Giovannini et al. (2005); 4: Tingay et al. (2000); 5: Venturi et al. (2000); 6: Schilizzi et al. (2001); 7: Lara et al. (1997); 8: Chang et al. (2010); 9: Kovalev et al. (2007); 10: Marecki et al. (2003); 11: Bondi et al. (2004); 12: Fomalont et al. (2000); 13: Jones et al. (1986); 14: Gabuzda et al. (2004); 15: Ojha et al. (2004)
| Source | Alt. | Red-shift | LAS | LLS | LAS | Type | (Hi) | Vshift | Ref. |
|---|---|---|---|---|---|---|---|---|---|
| name | name | Ref. | 1020 | ||||||
| (′′) | (kpc) | (cm-2) | (km s-1) | ||||||
| (1) | (2) | (3) | (4) | (5) | (6) | (7) | (8) | (9) | (10) |
| J0319+4130 | NGC1275 | 0.0176 | 198 | 70 | 1 | FR I | 2.34 | 2797 | YRS |
| J0840+2949 | 4C29.30 | 0.0647 | 520 | 639 | 2 | FR I | 47 | 84 | CSG |
| J09181205 | Hydra A | 0.0549 | 310 | 326 | 3 | FR I | 42 | 180 | D |
| J1219+0549 | NGC4261 | 0.0075 | 492 | 75 | 4 | FR I | 7.2 | 3 | J |
| J1247+6723 | 0.1073 | 671 | 1301 | 5 | FR II | 6.73 | 57 | S | |
| J13254301 | Cen A | 0.0018 | 30564 | 563 | 6 | FR I | 50.1 | 6 | VGH |
| J1352+3126 | 3C293 | 0.0450 | 216 | 189 | 7 | FR I | 78.9 | 3 | B |
| J1531+2404 | 3C321 | 0.0961 | 286 | 503 | 8 | FR II | 92.3 | 235 | CSDN |
| J1959+4044 | Cygnus A | 0.0561 | 127 | 137 | 9 | FR II | 25.4 | 165 | C |
Column 1: source name; column 2: alternative name; column 3: redshift; columns 4 & 5: largest projected angular (LAS) and linear (LLS) size in arcsec and kpc respectively; column 6 : references for the LAS; column 7: Hi column density; column 8: radio morphology classification; column 8: the shift of the primary Hi component relative to the systemic velocity as measured from the optical emission lines, with a negative sign indicating a blue-shift, and column 10: references for the Hi observations.
References for the structural information and LLS: 1: Pedlar et al. (1990); 2: Chandola, Saikia & Gupta (2010) 3: Ekers & Simkin (1983); 4: Condon & Broderick (1988); 5: Lara et al. 2001 ; 6: Junkes et al. (1993); 7: Bridle, Fomalont & Cornwell (1981); 8: Chandola et al. (2012); 9: Perley, Dreher & Cowan (1984).
References for Hi observations: D: Dwarakanath, Owen & van Gorkom (1995); J: Jaffe & McNamara (1994); S: Saikia, Gupta & Konar (2007); C: Conway & Blanco (1995); YRS: De Young, Roberts & Saslaw (1973); VGH: van der Hulst, Golisch & Haschik (1983); CSDN: Chandola et al. (2012); CSG: Chandola, Saikia & Gupta (2010); B: Beswick, Pedlar & Holloway (2002)

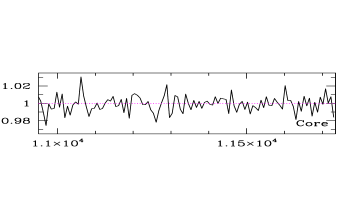
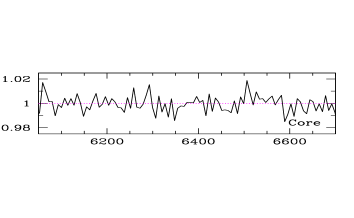
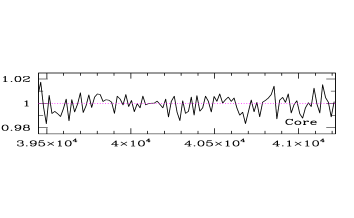
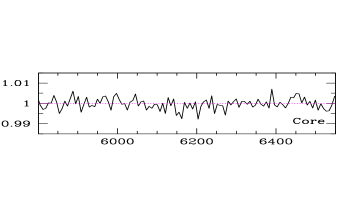
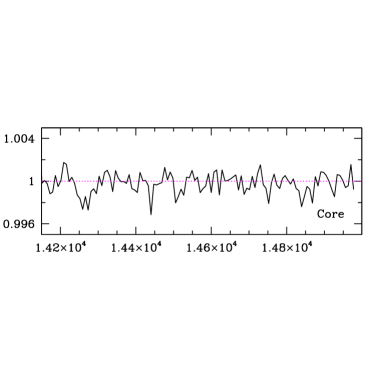
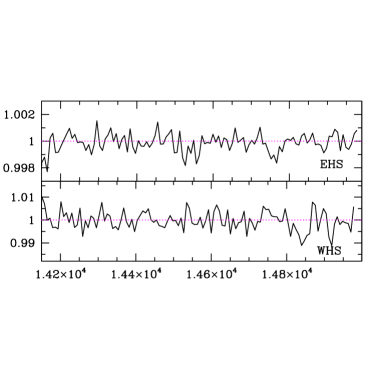
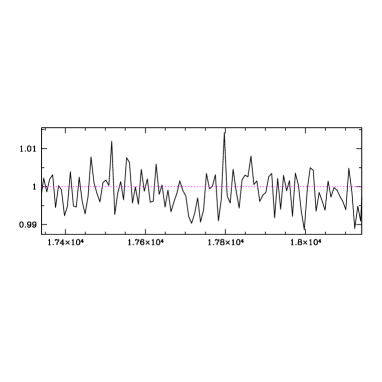
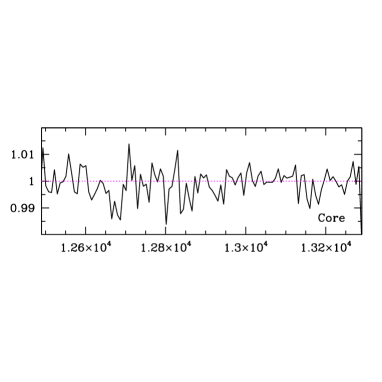
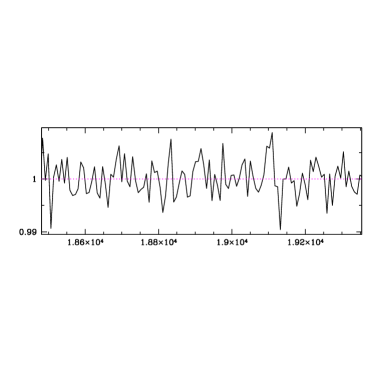
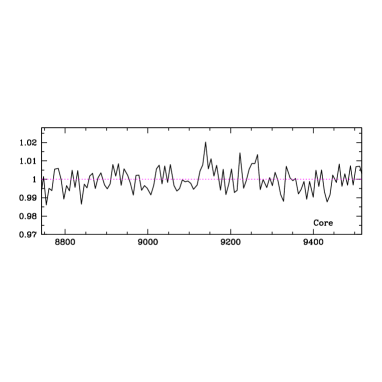
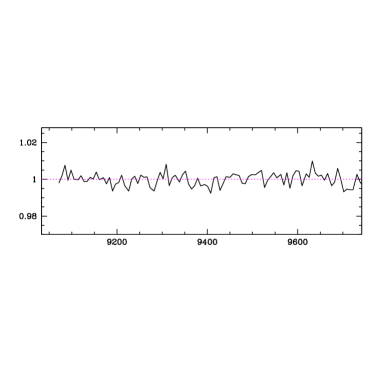
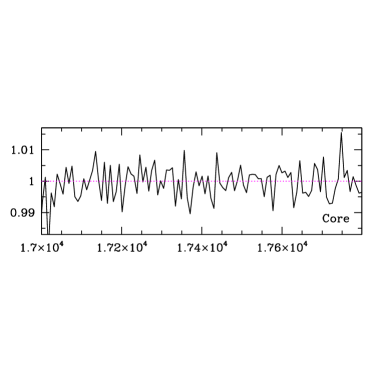
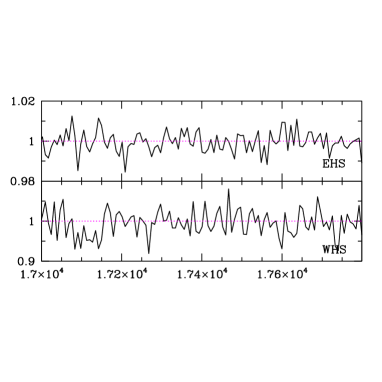
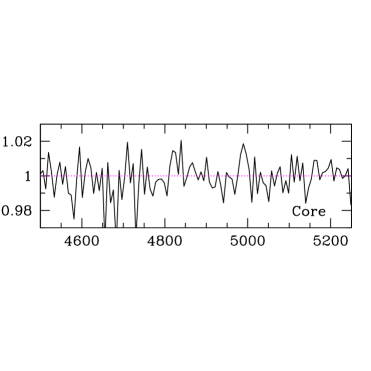
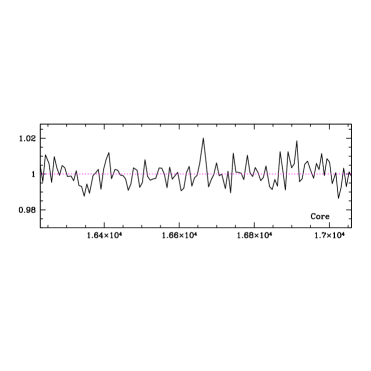
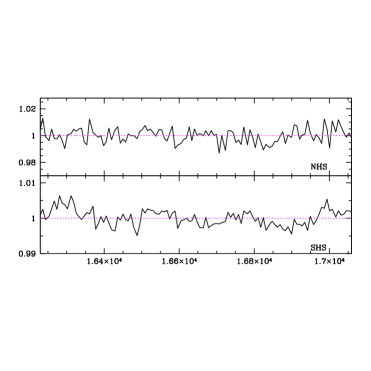
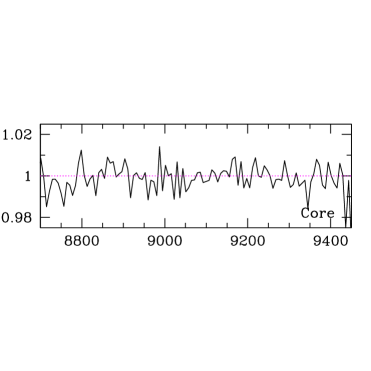
The final radio continuum images, i.e. the ones used for continuum subtraction, and the 21-cm Hi absorption spectra for the 15 galaxies with non-detections are presented in the Appendix (Figs. 519). The large-scale structure is seen in most of the images except for J0313+4120, J0748+5548, J1147+3501, J1744+5542 and J1836+1942 where the diffuse emission is largely resolved out in our GMRT images. For all sources the rms noise in the spectra, the column density for the lone detection, 3C452, and 3- upper limits to the optical depth towards all the other cores, and also towards the hotspots or peaks in 5 of the 16 sources are presented in Table. 2. The Hi column density, (Hi), has been estimated using the relation
| (Hi) | = | (1) |
and assuming =100 K and =1.0, where , and are the spin temperature, optical depth at a velocity and the fraction of background emission covered by the absorber respectively. In this paper wherever we mention Hi column density, it refers to the pseudo Hi column density with the above assumptions. The upper limits to (Hi) are 3- values and have been estimated, as stated above, assuming =100 K, =100 km s-1 and =1.0.
3 Discussion
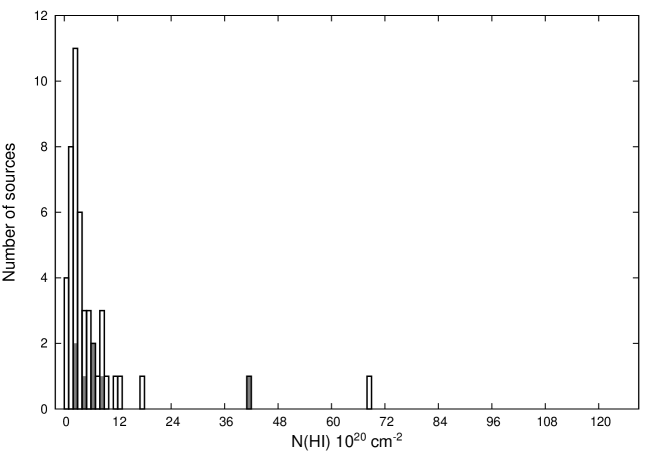
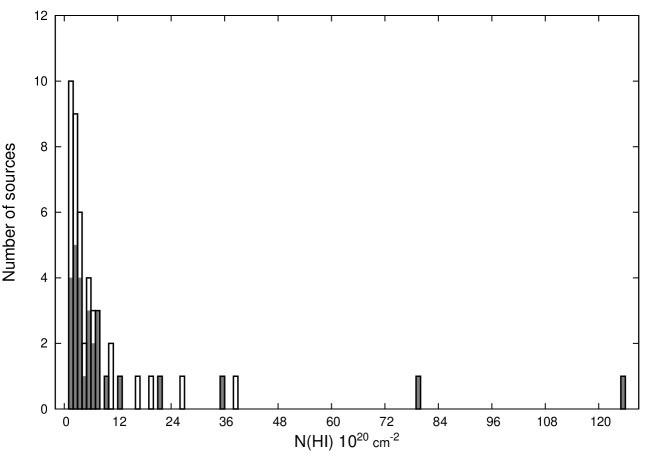
In order to estimate reliably the fraction of sources with 21-cm Hi detection, it is important to consider surveys of sources which report the detections as well as the non-detections. In our sample of 16 radio galaxies observed with the GMRT we detect 21-cm absorption associated with the core of only 1 radio galaxy i.e. J2245+3941 (3C 452) (Gupta & Saikia 2006a). To improve upon the statistics, we have considered the observations of large (15 kpc) sources by van Gorkom et al. (1989), Morganti et al. (2001) and Emonts et al. (2010) who have reported both the detections and non-detections in their samples, and have summarized their results in Table 3 which has a total of 31 sources. We have included only those sources which have been observed with few arcsec resolution (corresponding to a beam size of 15 kpc for our red-shift range) in order to minimise the effect of large scale structures on our estimates. We have also avoided inclusion of QSOs, BL Lacs, Spirals or Seyferts in the sample as we wanted to have a sample of radio galaxies with their hosts being ellipticals. Thus combining our observations of 16 sources listed in Table 1 and the 31 sources listed in Table 3, we obtain a sample of 47 radio sources, called the ‘cores sample’. We also list 9 sources in Table 4 for which Hi 21 cm absorption has been reported towards their core from observations with angular resolution of a few arcsec but not included in our ‘cores sample’ for statistical analysis since in these cases non-detections were not published.
3.1 Frequency of occurrence
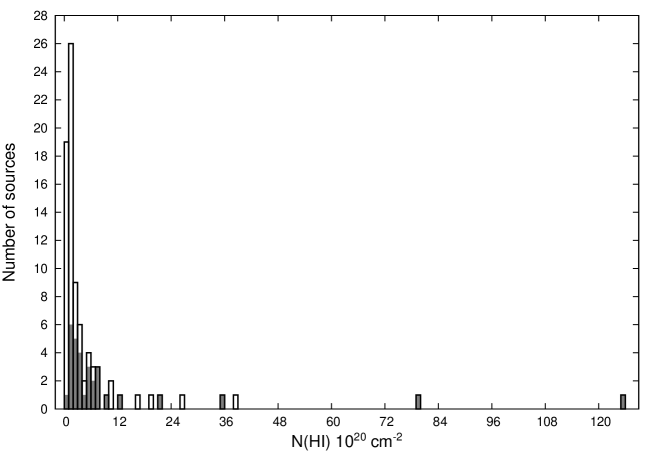
A comparison of the results of Hi 21-cm absorption observations towards the cores of radio galaxies with those obtained for CSS and GPS objects could help explore possible evolution of the content of Hi gas in the host galaxies of radio sources as the sources evolve. The column densities or upper limits to these in our ‘cores sample’ range from 1020 cm-2 to 1020 cm-2. The median column density sensitivity of our ‘cores sample’, including the upper limits is 1020 cm-2. For comparison, we consider the compilation of CSS and GPS sources from Gupta et al. (2006). From this compilation of 62 CSS and GPS sources we consider 60 sources. We exclude J1415+1320 and J1945+7055 as these were reported as individual detections. To enlarge this sample further we also consider 21-cm absorption searches based on samples of steep-spectrum sources reported in the literature since 2006. We consider measurements of 17 sources from Chandola, Sirothia & Saikia (2011), 5 compact sources (B0258+35, B0648+27, B1122+39, B1447+27, B1557+26) with steep spectrum from Emonts et al. (2010), and 2 sources from Carilli et al. (2007). The measurements of 10 compact sources with steep spectrum are available from Allison et al. (2012) but detailed size information is not available for these. So we are not able to include these in our sample. Thus we have a sample of 84 CSS and GPS sources. This sample has column densities or upper limits to these ranging from 1020 cm-2 to 1020 cm-2 with a median value of 1020cm-2 assuming that the values for the non-detections are close to the upper limits. To ensure that the sources are observed to similar sensitivity limits so that the distributions of column densities are similar for both the ‘cores’ and the ‘CSS and GPS’ samples, we considered all the sources from ‘CSS and GPS sample’ with a column density estimate or an upper limit to it which is at least 1.51020 cm-2. This leaves us with a sample of 49 CSS and GPS sources with a median column density sensitivity of 1020 cm-2, assuming again that the values for the non-detections are close to the upper limits.
The detection rate for the ‘cores sample’ is rather low (7/47; 15%; see Fig. 1 ) compared with the detection rate for compact CSS and GPS sources (28/49; 57%; see Fig. 2 lower panel). Considering the entire sample of 84 CSS and GPS objects, the detection rate (31/84; 37%; see Fig. 2 upper panel ) is again significantly higher than for the ‘cores sample’. All but one of the sources from ‘CSS and GPS sample’ with column density values 1.51020 cm-2 represent sensitive observations of CSS and GPS objects with no detection of Hi in absorption. We have also examined the VLBI-scale structure (references given in Table 1 and Table 3) of the cores of the larger sources (‘cores sample’) and find that they tend to have a core-jet structure where most of the flux density is from the VLBI-scale core component which is usually smaller than the CSS and GPS sources suggesting that the difference in Hi absorption detection rate is not due to different covering factors. Although it would be useful to confirm it from a larger sample, clearly the detection rate of Hi in absorption towards the cores of larger sources is smaller than for the CSS and GPS objects, suggesting an evolution in the gaseous content of the host galaxies .
It is also interesting to examine the Hi detection rate for FR I and FR II radio sources in case this reflects any differences in either the torus/disk or fuelling processes (e.g. Morganti et al. 2001; Emonts et al. 2010). In the ‘cores sample’ Hi is detected in absorption towards 4 out of 32 (13%) FR I objects, compared with 3 out of 15 (20%) for the FR II sources. Within statistical errors, there is no significant difference in the detection rate towards the cores for FR I and FR II radio sources. These have been observed with similar sensitivity.
3.2 Column density vs size
As mentioned earlier, the Hi column density in CSS and GPS objects appears to be anti-correlated with source size ( Pihlström, Conway & Vermeulen 2003; Gupta et al. 2006; Chandola, Sirothia & Saikia 2011), but shows no evidence of any dependence on either redshift or luminosity (Gupta et al. 2006). On sub-galactic scales, the observed anti-correlation has been interpreted by Pihlström, Conway & Vermeulen (2003) to be due to gas distributions with a radial power law density profile. It is also relevant to note here that Emonts et al. (2010) observed a sample of radio galaxies to detect Hi in emission and found an inverse relation between Hi mass and sources size.
In Fig. 3 we plot the 21-cm Hi column density towards the cores against the projected linear size in kpc for the sample of 47 radio galaxies. In this figure, we also plot an additional nine sources where Hi detection has been reported from observations with angular resolutions of a few arcsec for single sources (see Table 4), giving a total of 16 detections. The linear sizes range from tens of kpc to over a Mpc while the column densities vary from 0.5 1020 cm-2 to 691020 cm-2. There does not seem to be any significant relation between the Hi column density towards the cores and the largest projected linear sizes of the sources.
3.3 Relative velocity of absorbing gas
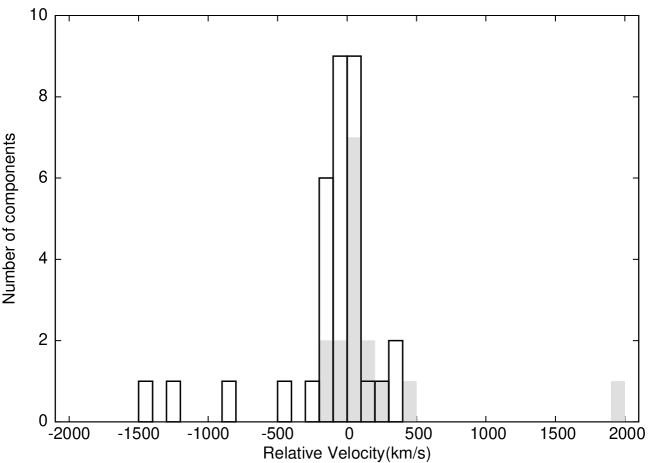
The relative velocity of the absorbing gas could be significantly blue shifted if it is due to gas which has been accelerated by interaction with the radio jet, while infalling material fuelling the central engine would appear red shifted. An important component of the unification scheme for FR II radio galaxies is the presence of a circumnuclear disk/torus. Hi gas associated with this and rotating around the nucleus may appear both blue and red shifted relative to the systemic velocity. It is worth noting that CSS and GPS objects often show complex line profiles with both blue- and red-shifted Hi absorption components.
We compare the relative velocity of the principal absorbing component for the 16 detections towards cores of larger sources with the 33 detections(including 2 sources from Gupta et al. (2006) which we left out earlier while doing statistical analysis of detection rates) towards CSS and GPS objects. While making these comparisons it is also relevant to note that different ionization lines may yield somewhat different systemic velocities. For example in 3C 452, the low-ionization forbidden emission lines are broader and more red-shifted than the high-ionization ones. The typical error in optical systemic velocity estimate for the sample is 90 km s-1. Fig. 4 shows that although a few CSS and GPS objects have large blue-shifted velocities of 1000 km s-1 possibly due to jet-cloud interactions, the distributions for the cores and CSS and GPS objects are not significantly different. Also one of the objects with the highly blue-shifted component, J1815+6127, has a large error of 900 km s-1 (Vermeulen & Taylor 1995) in its optical systemic velocity. The highly red-shifted component seen towards the core of NGC1275 in the Perseus cluster could be due to a gas cloud or galaxy in the intracluster medium moving towards NGC1275 (De Young, Roberts & Saslaw 1973).
4 Summary
We have presented the results from a search for 21-cm absorption towards the cores of 16 FR I and FR II radio galaxies. From our search we have reported earlier one new detection, i.e. towards the core of the radio galaxy J2245+3941 (3C 452) (Gupta & Saikia 2006a), and have now presented the upper limits on N(Hi) for the remaining 15 sources. We have combined our results with those of similar 21-cm absorption searches in the literature to obtain a larger sample, called the ‘cores sample’, of 47 radio galaxies, and have summarized our results here.
-
1.
The upper limits to the Hi column density towards the cores of large sources presented here range from 0.5 to 691020 cm-2.
-
2.
Considering observations of similar sensitivity, we find that the detection rate of Hi absorption towards the cores of larger (15 kpc) sources is only 15 per cent, compared with 57 per cent for CSS and GPS objects, suggesting an evolution in the gaseous content of the host galaxies as the radio sources age and grow in size.
-
3.
The Hi column density towards the core vs the largest linear size plot for the large sources shows no significant correlation between these parameters.
-
4.
The distribution of the relative velocity of the principal absorbing component towards the cores of large sources is not significantly different from that of the CSS and GPS objects, although a few of the CSS and GPS objects show large blue-shifted velocites (1000 km s-1) possibly due to jet-cloud interactions.
-
5.
For the ‘cores sample’, Hi absorption is detected towards 4 out of 32 (13%) FR I objects, and 3 out of 15 (20%) FR II sources. Although there have been suggestions of differences in the torus/disk structure and fuelling mechanisms between FR I and FR II sources, with the small number of detections there does not appear to be a significant difference in the detection rate between these two types of radio sources.
Acknowledgments
YC thanks Akash Pirya for his useful suggestions during this work. We thank the reviewer for his/her detailed comments which helped improve the manuscript, and the GMRT staff for their help with the observations. The GMRT is a national facility operated by the National Centre for Radio Astrophysics of the Tata Institute of Fundamental Research. We also thank the numerous contributors to the GNU/Linux group. This research has made use of the NASA/IPAC Extragalactic Database (NED) which is operated by the Jet Propulsion Laboratory, California Institute of Technology, under contract with the National Aeronautics and Space Administration.
References
- [] Allison J.R. et al., 2012, MNRAS, 423, 2601
- [] Alef W., Wu S. Y., Preuss E., Kellermann K.I., Qiu Y. H.,1996, A&A, 308, 376
- [] Andernach H., Feretti L., Giovannini G., Klein U., Rossetti E., Schnaubelt J., 1992, A&AS, 93, 331
- [] Baum S.A., Heckman T., Bridle A., van Breugel W., Miley G., 1988, ApJS, 68, 643
- [] Beswick R.J., Pedlar A., Holloway A.J., 2002, MNRAS, 329, 620
- [] Bondi M., Marchã M.J.M., Polatidis A., Dallacasa D., Stanghellini C., Antón S., 2004, MNRAS, 352, 112
- [] Britzen S. et al., 2007, A&A, 472, 763
- [] Bridle A.H., Davis M.M., Meloy D.A., Fomalont E.B., Strom R.G., Willis A.G., 1976, Nature, 262, 179
- [] Bridle A.H., Fomalont E.B., 1978, AJ, 83, 725
- [] Bridle A.H., Fomalont E.B., Cornwell T.J., 1981, AJ, 86, 1294
- [] Bridle A.H., Baum S.A., Fomalont E.B., Parma P., Fanti R., Ekers R.D., 1991, A&A, 245, 371
- [] Carilli C.L., Wang R., van Hoven M.B., Dwarakanath K., Chengalur J.N., Wyithe S., 2007, AJ, 133, 2841
- [] Chandola Y., Saikia D.J., Gupta N., 2010, MNRAS, 403, 269
- [] Chandola Y., Sirothia S.K., Saikia D.J., 2011, MNRAS, 418, 1787
- [] Chandola Y., Sirothia S.K., Saikia D.J., Gupta N., 2012, BASI, 40, 139
- [] Chang C.S., Ros E., Kovalev Y.Y., Lister M.L., 2010, A&A, 515, 38
- [] Condon J.J., Broderick J.J., 1988, AJ, 96, 30
- [] Condon J.J., Cotton W.D., Greisen E.W., Yin Q.F., Perley R.A., Taylor G.B., Broderick J.J. 1998, AJ, 115, 1693
- [] Conway J.E., Blanco P.R., 1995, ApJ, 449, L131
- [] Curran S.J.& Whiting M.T., 2010, ApJ, 712, 303
- [] de Bruyn A.G., 1989, A&A, 226, L13
- [] De Young D.S., Roberts M.S., Saslaw W.C., 1973, ApJ, 185, 809
- [] Dennett-Thorpe J., Bridle A.H., Laing R.A., Scheuer P.A.G., 1999, MNRAS, 304, 271
- [] Dwarakanath K.S., Owen F.N., van Gorkom J.H., 1995, ApJ, 442, L1
- [] Ekers R.D., Fanti R., Lari C., Parma P., 1981, A&A, 101, 194
- [] Ekers R.D., Simkin S.M., 1983, ApJ, 265, 85
- [] Emonts B.H.C. et al., 2010, MNRAS, 406, 987
- [] Eracleous M., Halpern J. P., 2004, ApJS, 150, 181
- [] Fanti C., Fanti R., de Ruiter H.R., Parma P., 1986, A&AS, 65, 145
- [] Fomalont E.B., Frey S., Paragi Z., Gurvits L.I., Scott W.K., Taylor A.R., Edwards P.G., Hirabayashi H., 2000, ApJS, 131, 95
- [] Fosbury R.A.E., Morganti R., Wilson W., Ekers R.D., di Serego A.S., Tadhunter C.N., 1998, MNRAS, 296, 701
- [] Gabuzda D.C., Murray É., Cronin P, 2004, MNRAS, 351, L89
- [] Giovannini G., Taylor G.B., Arbizzani E., Bondi M., Cotton W.D., Feretti L., Lara L., Venturi T., 1999, ApJ, 522, 101
- [] Giovannini G., Cotton W.D., Feretti L., Lara L., Venturi T., 2001, ApJ, 552, 508
- [] Giovannini G., Taylor G.B., Feretti L., Cotton W.D., Lara L., Venturi T., 2005, ApJ, 618, 635
- [] Gavazzi G., Perola G.C., Jaffe W., 1981, A&A, 103, 35G
- [] Gupta Neeraj, Salter C.J., Saikia D.J., Ghosh T., Jeyakumar S., 2006, MNRAS, 373, 972
- [] Gupta Neeraj, Saikia D.J., 2006a, MNRAS, 370, L80
- [] Gupta Neeraj, Saikia D.J., 2006b, MNRAS, 370, 738
- [] Hawley J.F., 2011, ASPC, 444, 63
- [] Jamrozy M., Konar C., Machalski J., Saikia D. J., 2008, MNRAS, 385, 1286
- [] Jaffe W., McNamara B.R., 1994, ApJ, 434, 110
- [] Jones D.L, 1984, ApJ, 287, 33
- [] Jones D.L. et al., 1986, ApJ, 305, 684
- [] Jones P.A., McAdam W.B., 1992, ApJS, 80, 137
- [] Junkes N., Haynes R.F., Harnett J.I., Jauncey D.L, 1993, A&A, 269, 29
- [] Konar C., Jamrozy M., Saikia D.J., Machalski J., 2008, MNRAS, 383, 525
- [] Kovalev Y.Y., Lister M.L., Homan D.C., Kellermann K.I., 2007, ApJ, 668, L27
- [] Lara L., Cotton W.D., Feretti L., Giovannini G., Venturi T., Marcaide J.M., 1997, ApJ, 474, 179
- [] Lara L., Cotton W.D., Feretti L., Giovannini G., Marcaide J.M., Márquez I., Venturi T., 2001, A&A, 370, 409
- [] Leahy J.P., Perley R.A., 1991, AJ, 102, 537
- [] Leahy J.P., Black A.R.S., Dennett-Thorpe J., Hardcastle M.J., Komissarov S., Perley R.A., Riley J.M., Scheuer P.A.G., 1997, MNRAS, 291, 20
- [] Linfield , 1987, ApJ, 317, 121
- [] Mack K.-H., Klein U., O’Dea C.P., Willis A.G., 1997, A&AS, 123, 423
- [] Marecki A., Barthel P.D., Polatidis A., Owsianik I., 2003, PASA, 20, 16
- [] Morganti R., Fanti C., Fanti R., Parma P., de Ruiter H.R., 1987, A&A, 183, 203
- [] Morganti R., Killeen N.E.B., Tadhunter C.N., 1993, MNRAS, 263, 1023
- [] Morganti R., Oosterloo T.A., Tadhunter C.N., van Moorsel G., Killeen N., Wills K.A., 2001, MNRAS, 323, 331
- [] O’Dea C.P., 1998, PASP, 110, 493
- [] Ojha R. et al., 2004, AJ, 127, 3609
- [] Owen F.N., Eilek J.A., Kassim N.E., 2000, ApJ, 543, 611
- [] Parma P., de Ruiter H.R., Fanti C., Fanti R., 1986, A&AS, 64, 135
- [] Pedlar A., Ghataure H.S., Davies R.D., Harrison B.A., Perley R., Crane P.C., Unger S.W., 1990, MNRAS, 246, 477
- [] Perley R.A., Bridle A.H., Willis A.G., 1984, ApJS, 54, 291
- [] Perley R.A., Dreher J.W., Cowan J.J., 1984, ApJ, 285, L35
- [] Perley, R.A., Roser H., Meisenheimer K., 1997, A&A, 328, 12
- [] Pihlström Y. M., Conway J.E., Vermeulen R.C., 2003, A&A, 404, 871
- [] Saikia, D.J., Subrahmanya C.R., Patnaik A.R., Unger S.W., Cornwell T.J., Graham D.A., Prabhu T.P., 1986, MNRAS, 219, 545
- [] Saikia D.J., Gupta N., Konar C., 2007, MNRAS, 375, L31
- [] Saripalli L., Patnaik A.R., Porcas R.W., Graham D.A., 1997, A&A, 328, 78
- [] Schilizzi R.T., Tian W.W., Conway J.E., Nan R., Miley G.K., Barthel P.D., Normandeau M., Dallacasa D., Gurvits L.I., 2001,A&A, 368, 398
- [] Spergel D.N. et al., 2003, ApJS, 148, 175
- [] Tingay S.J. et al., 2000, AJ, 119, 1695
- [] van der Hulst J.M., Golisch W.F., Haschick A.D., 1983, ApJ, 264, L37
- [] van Gorkom J.H., Knapp G.R., Ekers R.D., Ekers D.D., Laing R.A., Polk K.S., 1989, AJ, 97, 708
- [] Venturi T., Castaldini C., Cotton W.D., Feretti L., Giovannini G., Lara L., Marcaide J.M., Wehrle A.E., 1995, ApJ, 454, 735
- [] Venturi T., Morganti R., Tzioumis T., Reynolds J., 2000, A&A, 363, 84
- [] Vermeulen R. C., Taylor G.B., 1995, AJ, 109, 1983
- [] Wall J.V. & Peacock J.A., 1985, MNRAS, 216, 173
- [] Willis A.G., Strom R.G., Wilson A.S., 1974, Nature, 250, 625
- [] Wrobel J.M., Lind K.R., 1990, ApJ, 348, 135
Appendix A Maps and 21-cm spectra of the ‘cores sample’ from our GMRT observations.