Large Seebeck effect in the electron-doped FeAs2 driven by quasi one dimensional pudding-mold type band
Abstract
We investigate the thermoelectric propeties of the electron-doped FeAs2 both experimentally and theoretically. Electrons are doped by partially substituting Se for As, which leads to a metallic behavior in the resistivity. A Seebeck coefficient of about 200 V/K is reached at 300 K for 1% doping, and about 120 V/K even at 5% doping. The origin of this large Seebeck coefficient despite the metallic conductivity is analyzed from a band structure point of view. The first-principles band calculation reveals the presence of a pudding-mold type band just above the band gap, somewhat similar to NaxCoO2, but with a quasi-one-dimensional nature. We calculate the Seebeck coefficient using a tightbinding model that correctly reproduces this band structure, and this gives results close to the experimental observations. The origin of this peculiar band shape is also discussed.
pacs:
72.15.Jf, 63.20.dk, 71.20.-bI Introduction
Searching materials with good thermoelectric properties has been an issue of great interest both from the viewpoint of fundamental physics and application purposes. The efficiency of a thermoelectric material is often evaluated by the dimensionless figure of merit , where is the Seebeck coefficient, the electrical resistivity, the thermal conductivity, and being the temperatureMahan . in the formula is called the power factor, and in order to have this quantity large, both large Seebeck coefficient and small resistivity are required. However, it is usually difficult to have large Seebeck effect in metallic materials, so good thermoelectric materials are often found in narrow gap semiconductors.
The discovery of the large Seebeck effect in NaxCoO2Terasaki has provided a new avenue for searching good thermoelectric properties in materials with metallic resistivity with significantly amount of carriers. In fact, such a coexistence of metallic resistivity and large Seebeck coefficient have also been observed in e.g., CuRhO2Kuriyama ; Shibasaki2 , LiRh2O4Okamoto , LaRhO3Shibasaki1 , SrTiO3Okuda ; Ohta , and quite recently, in PtSb2Nishikubo . Theoretical studies on the origin of the large Seebeck effect in these materials have also been extensively performed Singh ; Wilson ; Maekawa ; Kuroki ; Usui ; Arita ; Usui_SrTiO3 ; Held ; Mori . In particular, Kuroki and Arita pointed out in Ref. Kuroki, that a peculiar band shape referred to as the “pudding-mold” type, which consists of a dispersive portion and a flat portion, can in general be favorable for the coexistence of large Seebeck coefficient and small resistivity. The quasi-two-dimensional pudding mold band has been proposed as an origin of the large power factor observed in NaxCoO2 and other materials. On the other hand, Mori et al. have recently studied the origin of the large Seebeck effect in PtSb2, and found a three dimensional “corrugated” flat band that gives rise to many Fermi surface pockets through the entire Brillouin zone when holes are doped.Mori This also gives rise to a coexisting large Seebeck coefficient and metallic resistivity in general.
In the present study, we focus on FeAs2 in an attempt to look for yet another material that exhibits large Seebeck effect despite the metallic resistivity. FeAs2 crystallizes in an orthorhombic Marcasite structure with Pnnm space group (No. 58). The structure is characterized by the edge-sharing FeAs6 octahedra, which are connected along the crystallographic axis ( axis) to form linear chains. The non-doped semiconductor FeAs2 has been investigated previously in Ref. PSun, in comparison with FeSb2, which exhibits a colossal thermoelectric effectBentien . A theoretical analysis has shown that the Seebeck coefficient of the non-doped FeAs2 can be understood quantitatively using the band structure obtained from the first-principles calculationKotliar . In the present study, we investigate the thermoelectric properties of the electron doped FeAs2 both experimentally and theoretically. By doping electrons by partially substituting Se for As, the resistivity exhibits a metallic behavior, but nonetheless we observe a fairly large Seebeck coefficient at 300 K of about 200V/K at 1% doping and 120 V/K even at 5% doping. We also analyze the origin of this experimental observation theoretically. It is found that the quasi-one-dimensional (q1D) version of the pudding-mold type band is present right above the band gap, and this peculiar band shape gives rise to the coexistence of the metallic resistivity and the large Seebeck coefficient. We also discuss the origin of this peculiar band shape using a simplified model. With the present study, we now have examples of materials that possess one- (FeAs2), two- (NaxCoO2, etc.), or three-dimensional (PtSb2) flat bands that give rise to the large Seebeck coefficient with the metallic resistivity. This reinforces the general efficiency of peculiar band shapes with partially flat dispersions.
II Experiment
II.1 Synthesis
Polycrystalline samples of Fe(As1-xSex)2 with nominal Se contents of = 0.0, 0.01, 0.025, and 0.05 were synthesized by a solid-state reaction in two steps. First, stoichiometric amount of starting materials Fe (99.9%), As (99.9999%), and Se (99.9%) were mixed and ground. They were heated in an evacuated quartz tube at 500∘C for 40 h and then at 700∘C for 40 h. Second, the product was powdered, pressed into pellets, and sintered at 800∘C for 12 h. The obtained samples were characterized by powder X-ray diffraction (XRD) and confirmed to be a single phase of Fe(As1-xSex)2. Electrical resistivity and Seebeck coefficient were measured using a Physical Property Measurement System (PPMS, Quantum Design) in the temperature range from 2 to 300 K.
II.2 Thermoelectric properties
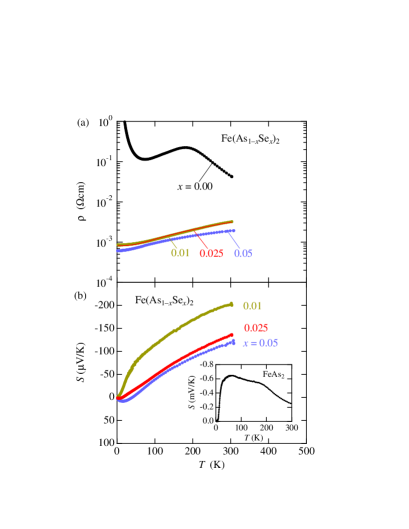
As shown in Fig. 1(a), non-doped FeAs2 exhibits a semiconducting behavior, consistent with the previous reports. PSun The Seebeck coefficient of the non-doped FeAs2 exhibits a large maximum value of 0.65 mV/K at approximately 60 K, as shown in the inset of Fig. 1(b), which is similar to the literature data. PSun Then, both the magnitude and temperature dependence of resistivity changed abruptly by substituting Se for As from semiconducting to metallic. The values on the order of 1 mcm and the positive temperature slope of suggest that a metallic sate is realized for Fe(As1-xSex)2 ( = 0.01, 0.025, and 0.05). The temperature dependence of is also changed abruptly by Se doping. But even in the metallic state, the Seebeck coefficient reaches a fairly large value of about 200 V/K at 300 K for the sample, as shown in Fig. 1(b). In this way, metallic is compatible with a large for Fe(As1-xSex)2. This combination of the resistivity and the Seebeck coefficient gives a maximum power factor of 14 W/cm K2 at approximately 200 K for the = 0.01 sample.
III Theoretical Analysis
III.1 Band structure
We now turn to the theoretical analysis. We perform first-principles band structure calculation using the Wien2k packageWien2k . The structural parameters adopted are given in Ref. FeAs2_structure, , in which the lattice constants are , and , space group is Pnnm, and the atomic positions are for Fe and for As. In the present study, we construct tightbinding models in order to calculate the Seebeck coefficient. To obtain a model that correctly reproduces the first-principles band structure, we construct maximally localized wannier functions (MLWFs) from the first-principles calculation result.wannier90 We focus on the electron doped case up to about the room temperature, so that we only have to consider the band structure above the band gap. The tight-binding Hamiltonian is written as
| (1) |
where denote the sites, and the orbitals, and is the hopping parameter obtained from MLWFs , and are the creation-annihilation operators. Here we first consider six orbitals (three orbitals per Fe) to reproduce the bands up to about 5eV above the Fermi energy. These orbitals have mainly character, although they are hybridized with As .
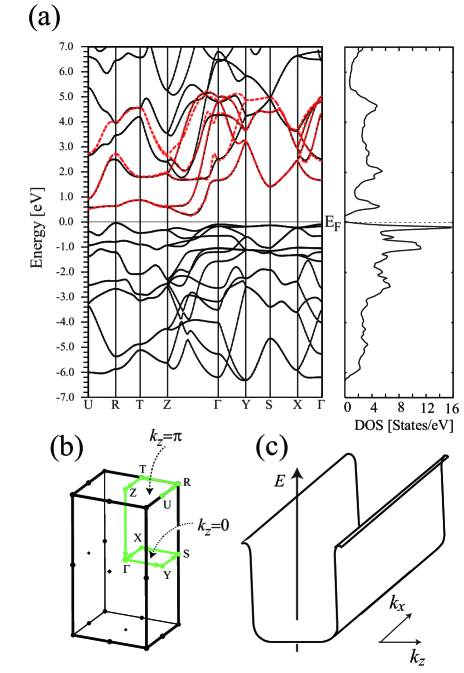
The first-principles band structure is shown in Fig.2(a) with the tight binding bands superposed. The band structure just above the band gap has a nearly flat dispersion along U-R-T-Z (see (b) for the symmetrical points in the Brillouin zone), namely, within the plane. In fact, the Wannier orbitals that are the origin of these bands are found to be elongated in the direction (see Fig.5). We will call these orbitals the “ orbitals” for simplicity (the maximally localized Wannier orbitals are obtained by projecting onto the orbital), although they are actually more complicated due to the hybridization with the As 4p orbitals. The quasi-one-dimensionality of the bands within the plane is partially because of the anisotropy of these orbitals, but to be more precise, there is another factor that restricts this quasi-one-dimensionality to near the plane, which will be discussed later. Furthermore, these bands are somewhat flat also along Z- (i.e., the direction) up to some intermediate point, then bend sharply into dispersive portions. In Fig.2(c), we show a schematic figure of this band structure. It has a flat portion at the bottom with a q1D nature, so it is a q1D version of the pudding-mold type band introduced in ref.Kuroki, as the band structure of NaxCoO2. This type of band structure is favorable for producing good thermoelectric properties when carriers are doped. The reason is because (i) even when a large amount of carriers are doped, the Fermi level sticks close to the band bottom due to the large density of states, (ii) for such a position of the Fermi level, there is a large difference between electron and hole group velocity, resulting in a large Seebeck coefficient, and (iii) small resistivity can be achieved owing to the large amount of doped carriers and the dispersive portion of the band near the Fermi level. The origin of such a peculiar band structure in FeAs2 will be discussed later.
III.2 Seebeck coefficient
Let us now move on to the Seebeck coefficient calculation. We first briefly introduce the method to calculate the Seebeck coefficient and the power factor.Wilson ; Mahan The Seebeck coefficient and the resistivity are calculated with Boltzmann’s equation using the tight-binding Hamiltonian. They are given as,
| (2) | |||
| (3) |
where is the elementary electrical charge(), is the temperature. and are given as
| (4) |
where is wave vector, is quasi-particle lifetime, is the -th energy eigenvalue at , is the group velocity tensor, is the Fermi distribution function, and is the chemical potential at . We simply denote , , and . We will approximate the quasiparticle life time as an (undetermined) constant in the present study, so that it cancels out in the Seebeck coefficient calculation, while not in the resistivity. Thus the absolute value of the power factor is not determined and will be normalized by a certain value.
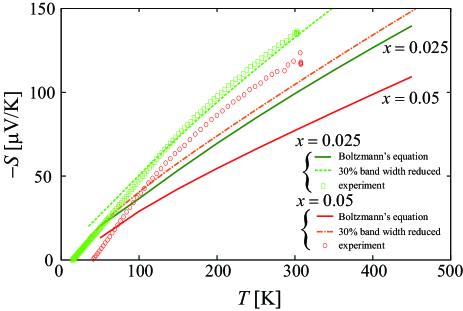
The calculated Seebeck coefficient as a function of the temperature is shown in Fig.3. The results at K give V/K at , and V/K at . The theoretical result is about 20% smaller than the experimental values at and K. This discrepancy from the experiment may be due to the constant lifetime approximation, or the band width renormalization due to the electron correlation effects that are not considered in the first-principles band calculation. As for the latter possibility, it has been known from the comparison between the band calculation and the angle-resolved photoemission studies that the bandwidth of the electron materials can be reduced by as much as 60% , and taking this effect into account in the Seebeck coefficient calculation reproduces quantitatively the experimental results of NaxCoO2Kuroki . The Seebeck coefficient is underestimated also in other cases of electron systems such as SrTiO3Usui_SrTiO3 , due to the band width renormalization effect. If we assume that the band width is reduced by 30% from the first-principles result, the calculated Seebeck coefficient is in good agreement with the experimental result as shown in Fig.3(dotted line). The band width renormalization effect is not so strong as in NaxCoO2, indicating that the electron correlation effects are not so large in this material.
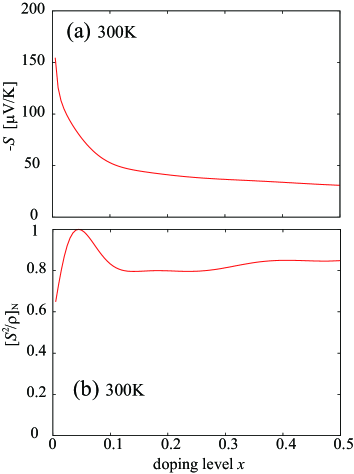
In Fig.4, we show the doping level dependence of the Seebeck coefficient and the normalized power factor (normalized by the maximum value) at K. This result shows that the Seebeck coefficient keeps relatively large values of about V/K even at a (hypothetically) large doping rate , so that (assuming a constant quasiparticle life time) the power factor is roughly constant. This peculiar doping level dependence of the power factor is a consequence of the pudding-mold type band.
III.3 Origin of the pudding-mold type band
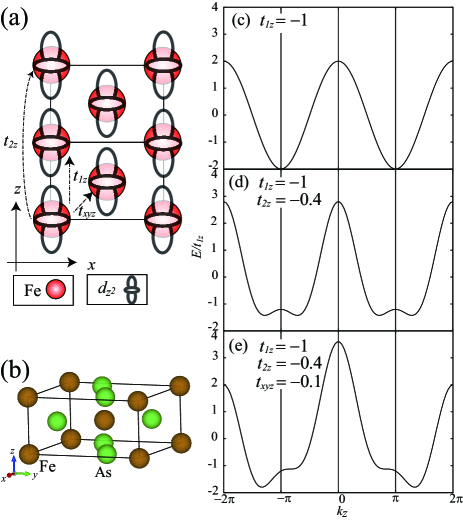
As seen from our theoretical analysis, the large Seebeck coefficient in the electron-doped FeAs2 is a consequence of the q1D pudding-mold type band. In this section, we focus on the origin of this peculiar band structure. For simplicity, we first consider a unit cell that contains only one Fe site per unit cell. This corresponds to expanding (unfolding) the Brillouin zone. By taking this unit cell, we consider a simplified tight-binding model, where only the hoppings and along direction, and to the position are considered (Fig.5(a), see Fig.5(b) for the correspondence with the actual lattice structure). The hoppings in the and directions can be neglected for the band originating from the orbital. In this model, the energy is given as
| (5) | |||||
When , the third term in the right hand side vanishes due to , and the band dispersion loses and dependence. This is the explanation of the q1D nature of the band structure in the plane. We now focus on the band structure along the direction. When we consider only , the band shape is free-electron-like at the bottom of the band(Fig.5(c)). Adding the distant hopping , the shape of the band becomes flat near the band edge around (corresponding to the Z point), so that the q1D pudding-mold-type band is formed (Fig.5(d)). Further considering , the band becomes asymmetric with respect to (Fig.5(e)).

To compare this simple band structure to a more realistic one, we construct, again exploiting the MLWF’s, a two orbital model that considers only the orbital in the original unit cell that contains two Fe. Although this model does not perfectly reproduce the original band structure as in the six orbital model presented in the above, it still captures the essential features. In this model, eV, , , and the distant hoppings are also contained. The band structure of the two orbital model is shown in Fig.6(a) compared with the band structure of Fig.5(c) refolded into the original Brillouin zone (Fig.6(b)). The band structure of the simplified model is roughly similar to that of the two orbital model especially near the band bottom, so that the essence of the origin of this peculiar band structure can be understood by the simplified model. To be precise, the magnitude of and is different between the two models because the simplified model considers only three hoppings, while the more realistic two orbital model takes into account the distant hoppings as well. The bottom line here is that the origin of the q1D pudding-mold type band is the overlapping feature of the orbitals, where a relatively large second neighbor hopping is present.
IV Conclusion
In the present work, we have studied the thermoelectric properties of the electron-doped FeAs2. A large Seebeck coefficient is observed despite the metallic behavior of the resistivity. First-principles band calculation reveals the presence of a q1D pudding-mold type band just above the band gap, which mainly originates from the Fe 3dz2 orbital. orbital. Using a tightbinding model that correctly reproduces this band structure, we have calculated the Seebeck coefficient. The results are close to the experimental observation, and the electron correlation effects are found to be small. The q1D nature of the pudding-mold type band comes from the combination of the orbital and the lattice structure. Given the present study, we now have examples of materials that possess one-, two-, or three-dimensional flat bands that give rise to the large Seebeck coefficient in a metallic system. Therefore, the present findings in the electron-doped FeAs2 reinforces the general efficiency of peculiar band shapes with partially flat dispersion.
References
- (1) For a general review on the theoretical aspects as well as experimental observations of thermopower, see, G.D. Mahan Good Thermoelectrics, Solid State Physics 51, 81 (1997).
- (2) I. Terasaki, Y. Sasago and K. Uchinokura, Phys. Rev. B 56 R12685 (1997).
- (3) H. Kuriyama, M. Nohara, T. Sasagawa, K. Takubo, T. Mizokawa, K. Kimura, and H. Takagi, in Proc. 25th International Conference on Thermoelectrics (IEEE, Piscataway, 2006).
- (4) S.Shibasaki, W.Kobayashi, and I.Terasaki: Phys. Rev. B 74, 235110 (2006).
- (5) Y.Okamoto, S.Niitaka, M.Uchida, T.Waki, M.Takigawa, Y.Nakatsu, A.Sekiyama, S.Suga, R.Arita, H.Takagi, Phys. Rev. Lett. 101, 086404 (2008).
- (6) S. Shibasaki, Y. Takahashi, and I. Terasaki, J. Phys. Cond. Matt. 21, 115501 (2009) .
- (7) T. Okuda, K. Nakanishi, S. Miyasaka, and Y. Tokura, Phys. Rev. B 63, 113104 (2001).
- (8) H. Ohta, K. Sugiura, and K. Koumoto, Inorg. Chem. 47, 8429 (2008).
- (9) Y. Nishikubo, S. Nakano, K. Kudo, and M. Nohara, Appl. Phys. Lett. 100, 252104 (2012).
- (10) D.J. Singh, Phys. Rev. B 61, 13397 (2000).
- (11) K. Mori, H. Usui, H. Sakakibara, and K. Kuroki, AIP Advances 2, 042108 (2012).
- (12) P. Wissgott, A. Toschi, H. Usui, K. Kuroki, and K. Held, Phys. Rev. B 82, 201106 (2010).
- (13) G.B. Wilson-Short, D.J. Singh, M. Fornari and M. Suewattana, Phys. Rev. B 75, 035121 (2007).
- (14) W. Koshibae and S. Maekawa, Phys. Rev. Lett. 87, 236603 (2001), W. Koshibae, K. Tsutsui, and S. Maekawa, Phys. Rev. B 62, 6869 (2000).
- (15) R. Arita, K. Kuroki, K. Held, A.V. Lukoyanov, S. Skornyakov, and V.I. Anisimov, Phys. Rev. B 78, 115121 (2008).
- (16) H. Usui, R. Arita, and K. Kuroki, Journal of Physics Condensed Matter : an Institute of Physics Journal 21, 064223 (2009).
- (17) H. Usui, S. Shibata, and K. Kuroki, Phys. Rev. B 81, 205121 (2010).
- (18) K. Kuroki and R. Arita, J. Phys. Soc. Jpn. 76, 083707 (2007).
- (19) P. Sun, N. Oeschler, S. Johnsen, B.B. Iversen, and F. Steglich, Appl. Phys. Express 2 091102 (2009).
- (20) A. Bentien, S. Johnsen, G. K. H. Madsen, B. B. Iversen, and F. Steglich, Europhysics Letters 80, 17008 (2007).
- (21) J.M. Tomczak, K. Haule, T. Miyake, A. Georges, and G. Kotliar, Phys. Rev. B 82, 085104 (2010).
- (22) P. Blaha, K. Schwarz, G. K. H. Madsen, D. Kvasnicka, and J. Luitz,Wien2k: An Augmented PlaneWave + Local Orbitals Program for Calculating Crystal Properties (Vienna University of Technology,Wien, 2001). Here we take RKmax = 7, 512 k-points, and adopt the exchange correlation functional introduced by J. P. Perdew, K. Burke, and M. Ernzerhof, [Phys. Rev. Lett. 77, 3865 (1996)].
- (23) H. D. Lutz, M. Jung, and G. Wschenbach, Zeitschrift Fr Anorganische Und Allgemeine Chemie 554, 87 (1987).
- (24) N. Marzari and D. Vanderbilt, Phys. Rev. B 56, 12847 (1997); I. Souza, N. Marzari, and D. Vanderbilt, Phys. Rev. B 65, 035109 (2001). The Wannier functions are generated by the code developed by A. A. Mostofi, J. R. Yates, N. Marzari, I. Souza, and D. Vanderbilt, (http://www.wannier.org/).