A X–ray observation of one orbit of the supergiant fast X–ray transient IGR J16479–4514
Abstract
We report on a 250 ks long X–ray observation of the supergiant fast X–ray transient (SFXT) IGR J16479–4514 performed with in 2012 February. During this observation, about 80% of the short orbital period (Porb3.32 days) was covered as continuously as possible for the first time. The source light curve displays variability of more than two orders of magnitude, starting with a very low emission state (10-13 erg cm-2 s-1; 1–10 keV) lasting the first 46 ks, consistent with being due to the X–ray eclipse by the supergiant companion. The transition to the uneclipsed X–ray emission is energy dependent. Outside the eclipse, the source spends most of the time at a level of 6-7 erg cm-2 s-1 punctuated by two structured faint flares with a duration of about 10 and 15 ks, respectively, reaching a peak flux of 3-4 erg cm-2 s-1, separated by about 0.2 in orbital phase. Remarkably, the first faint flare occurs at a similar orbital phase of the bright flares previously observed in the system. This indicates the presence of a phase-locked large scale structure in the supergiant wind, driving a higher accretion rate onto the compact object. The average X–ray spectrum is hard and highly absorbed, with a column density, NH, of 1023 cm-2, clearly in excess of the interstellar absorption. There is no evidence for variability of the absorbing column density, except that during the eclipse, where a less absorbed X–ray spectrum is observed. A narrow Fe Kα emission line at 6.4 keV is viewed along the whole orbit, with an intensity which correlates with the continuum emission above 7 keV. The scattered component visible during the X–ray eclipse allowed us to directly probe the wind density at the orbital separation, resulting in w=710-14 g cm-3. Assuming a spherical geometry for the supergiant wind, the derived wind density translates into a ratio 10-17 M⊙/km which, assuming terminal velocities in a large range 500–3000 km s-1, implies an accretion luminosity two orders of magnitude higher than that observed. As a consequence, a mechanism should be at work reducing the mass accretion rate. Different possibilities are discussed.
keywords:
X–rays: individual (IGR J16479–4514)1 Introduction
IGR J16479–4514 is a hard X–ray transient discovered by on 2003, August 8–10 (Molkov et al., 2003) in the energy range 18–50 keV. Several X–ray flares were caught by /IBIS, displaying variable durations (from 0.5 to 50 hr) and peak fluxes (from 20 to about 600 mCrab, 20–60 keV; Sguera et al. 2005, 2006, 2008, Walter & Zurita Heras 2007, Ducci et al. 2010). Recurrent outbursts were also observed by the satellite (Kennea et al. 2005, Markwardt & Krimm 2006, Romano et al. 2008, La Parola et al. 2009, Bozzo et al. 2009).
The proposed counterpart (2MASS J16480656-4512068, Walter et al. 2006) was confirmed by an accurate localization obtained with (Ratti et al. 2010) and classified as a late O-type supergiant with a spectral type O8.5I located at a distance of 4.9 kpc (Rahoui et al. 2008, Chaty et al. 2008) or a O9.5 Iab star located at 2.8 kpc (Nespoli et al., 2008). The optical identification confirmed the initial classification of IGR J16479–4514 as a member of the new sub-class of high mass X–ray binaries, the supergiant fast X–ray transients (SFXTs), at first suggested only based on the short duration of its hard X–ray activity (Sguera et al., 2006).
IGR J16479–4514 is an eclipsing SFXT (Bozzo et al., 2008b) and the one with the narrowest orbit, showing an orbital period of 3.32 days (Jain et al., 2009), later refined to 3.3193 days (Romano et al., 2009).
X–ray long-term monitoring outside outbursts revealed that the source spends most of its time at a reduced level of X–ray emission (1033-1034 erg s-1), from 2 to 3 orders of magnitude less than the flare peaks, while for the remaining 19% of the time, it is undetected, compatibly with being in eclipse (Sidoli et al. 2008, Romano et al. 2009).
The nature of the compact object is unclear (as in about a half of the members of the SFXTs class; for a recent review see Sidoli 2010) but there is indirect evidence based on the spectral similarity with accreting pulsars suggesting that the X–ray source is a neutron star (NS).
Here we report on the first X–ray observation which continuously (except that during the interruptions because of the satellite orbit) covers most of an orbital cycle of IGR J16479–4514. Our main goal is to investigate the variability of the X–ray properties along a single orbital cycle.
2 Observations and Data Reduction
IGR J16479–4514 was observed by Suzaku (Mitsuda et al., 2007) between 2012 February 23 and 26. The observation (Obs ID 406078010) was performed with the source located at the X–ray Imaging Spectrometer (XIS; Koyama et al. 2007) nominal position. The XIS consists of four telescopes with a spatial resolution of about 2 arcmin coupled to four CCD cameras operating in the 0.2–12 keV energy range and with field of view ( pixels; arcsec pixel-1; Koyama et al. 2007). At the time of our observation only the two front illuminated (FI) XIS0 and XIS3 (effective area: 330 cm2 at 1.5 keV), and the back-illuminated (BI) XIS1 (effective area: 370 cm2 at 1.5 keV) were operating. The three detectors were operated in Normal Mode with no window or burst option (all the pixels on the CCD are read out every 8 seconds). The other instrument aboard Suzaku is the Hard X-ray Detector (HXD; Takahashi et al. 2007), which consists of PIN silicon diodes (HXD-PIN; 10–70 keV) and Gd2SiO5Ce (GSO; 50–600 keV) scintillators. The HXD was operated in the standard mode, with a time resolution of 61 s. The HXD is a collimated instrument and the PIN in particular has a field of view (FWHM: ).
Data reduction and analysis employed version 19 of the Suzaku Software included in the HEAsoft software package and followed the procedures described in the Suzaku ABC Guide.111heasarc.gsfc.nasa.gov/docs/suzaku/analysis/abc/ . Following standard practices, we excluded times within 436 s of Suzaku passing through the South Atlantic Anomaly and we also excluded the data when the line of sight was elevated above the Earth’s limb by less than , or was less than from the bright-Earth terminator. Moreover, we excluded time windows during which the spacecraft was passing through the low cut-off rigidity of below 6 GV.
For the XIS we considered only events with GRADE = 0,2–4,6 and removed hot and flickering pixels using sisclean; for the spectral analysis, the response matrices were generated with xisrmfgen and using ray-tracing simulations with xissimarfgen. With all the aforementioned data selection criteria applied, the resulting total effective exposure is roughly 136 ks for each XIS. The XIS events of IGR J16479–4514 were accumulated in each of the three XIS cameras within a circular region (3 arcmin radius) centred on the target, while the backgrounds were estimated from an annulus with radii 5 and 7 arcmin. During the observation, the standard criterion for the attitude determination requiring that the residuals are less than could not be fullfilled, with residuals still remaining at about for about 20 hours, in the temporal window from February 25 01:00 through 22:00, but still smaller than the point spread function (PSF) for usual point-like source analysis.
In the HXD-PIN (no significant emission was detected in the GSO) the net exposure time, after dead-time correction (live time: 92.8%) is 141.9 ks. To subtract non-X-ray background (NXB) events that are included in the HXD-PIN we used the ‘tuned’ NXB synthesized background (Fukazawa et al., 2009). After subtracting the synthesized NXB from the HXD-PIN data, we also subtracted contributions of the cosmic X-ray background (CXB) using the model reported in Gruber et al. (1999) and of the Galactic Ridge X–ray emission (GRXE; Valinia & Marshall 1998).
To ensure applicability of the statistics, the net XIS spectra were rebinned such that at least 20 counts per bin were present. All spectral uncertainties and upper-limits are given at 90% confidence for one interesting parameter. Data were analysed using ftools version 6.11.1 and xspec version 12. In the spectral fitting we used the photoelectric absorption model phabs in xspec with the interstellar abundances of Wilms et al. (2000) and cross section table set of Balucinska-Church & McCammon (1992). The three joint XIS0, XIS1 and XIS3 spectra were fitted together, including constant factors to allow for normalization uncertainties between the instruments. For the timing analysis photon arrival times were corrected to the Solar System barycenter.
3 Analysis and Results
3.1 Light curves
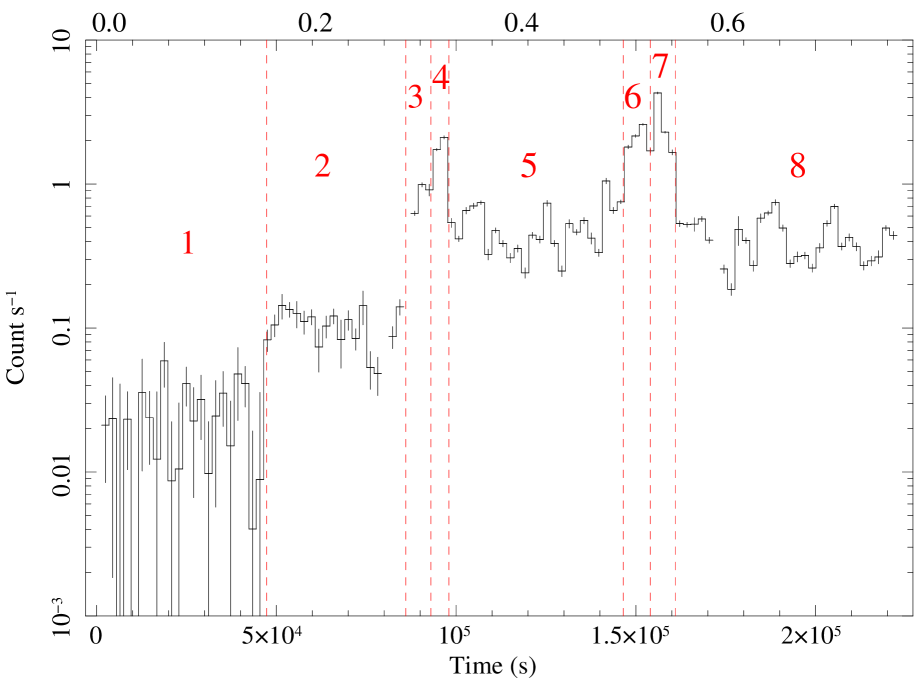
The XIS barycentred and background-subtracted light curve of IGR J16479–4514 in the energy range 0.2–10 keV, is shown in Fig. 1, while the hardness ratio (HR) between net counts extracted in the hard (above 3 keV) and the soft (below 3 keV) energy bands is reported in Fig. 2, both versus time (upper panel) and in dependence of the source intensity (lower panel). Numbers in Fig. 1 indicate time intervals which show different source intensity behaviour. At the beginning of the observation a very low intensity state is present (n. 1), consistent with being the X–ray eclipse produced by the companion star. Indeed, folding the light curve on the refined orbital period Porb=286792 s (Romano et al., 2009) and assuming the epoch 54547.05418 (MJD) as orbital phase =0 (Bozzo et al., 2009), we obtain the orbital phases reported as top x-axis in Fig. 1. The uncertainty on the epoch of =0 can be estimated in about =, obtained extrapolating the error on the orbital period to the time of the observation (432 orbital cycles between the epoch 54547.05418 MJD and the observations).
The observation did not cover the ingress time, so we are unable to determine the exact eclipse duration. We can at least constrain it to be between 46 ks (the duration of the eclipse at hard X–rays) and 143 ks (that is, 0.5 in phase, assuming a perfectly edge-on system with a tight orbit). An eclipse duration of about 0.6 days (52 ks) as proposed by Jain et al. 2009 could imply that we might be seeing almost the full duration of the eclipse. After the eclipse (time interval n. 2) an intermediate level of emission is observed, lasting about 38 ks, during which the soft X–ray intensity below 3 keV is indistinguishable from the emission during eclipse (Fig. 2), while at harder energies the source appears uneclipsed, although with a reduced intensity with respect to the uneclipsed emission displayed in the intervals n. 5 and n. 8.
Two flares are present peaking at 2 counts s-1 and 4 counts s-1 in the time intervals n. 4 and n. 7, respectively. Intervals n. 3 and n. 6 can be considered the rise to these two flare peaks, while intervals n. 5 and n. 8 are characterized by a very variable, intra-flare emission, which covers about 40% of the orbital cycle.
 |
 |
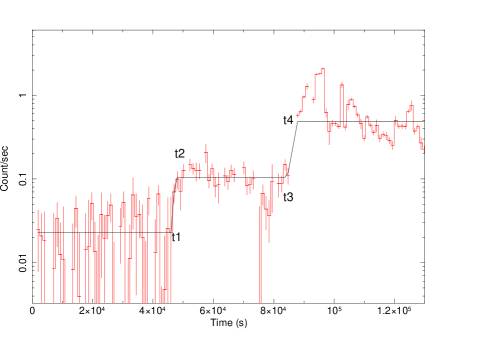
The X–ray light curve shows two sharp transitions from the eclipse towards the uneclipsed X–ray emission. To better estimate the time of the eclipse, we simply modeled the light curve with two ramp-and-step functions, characterized by seven parameters: the count rates of the three “steps” in the light curve and the four times, ti, displayed in Fig. 3. The fit resulted in the following times measured from the beginning of the observation: t1= ks, t2= ks, t3= ks, t4= ks. The time t1 corresponds to the date 55981.5131 (MJD).
3.2 Timing Analysis
Barycentred light curves with 8 seconds bin time were produced for each unit of the X-ray Imaging Spectrometer (XIS0, XIS1, XIS3) in three energy bands (0.2–3, 3–10, 0.2–10 keV). We considered two time ranges: i) the entire duration of the observation (interval from 1 to 8 in Fig. 1) and ii) the part of the observation excluding the eclipse and the transition to the uneclipsed emission (time intervals from 3 to 8 in Fig. 1). In order to search for spin periodicities in the XIS light curves, we used the Lomb-Scargle periodogram method by means of the fast implementation of Press & Rybicki (1989) and Scargle (1982), which is generally preferred for data set with gaps and unequal sampling. Periodicities were searched in the frequency range from i) 0.000013 Hz or ii) 0.000022 Hz (after which the sensitivity is reduced due to the finite length of the light curves) to 0.0625 Hz (corresponding to the Nyquist frequency of the data set). No significant and unambiguous evidence for coherent modulation was found in the periodograms.
3.3 Spectroscopy
We first analysed the joint XIS spectra extracted from the entire observation, corresponding to a net integration time of 136 ks. The net source count rates (0.2–10 keV) in the three XIS were the following: 0.157 count s-1 (XIS0), 0.144 count s-1 (XIS1) and 0.165 count s-1 (XIS3). Adopting an absorbed power-law model resulted in a flat spectrum (photon index, , of 1.35), a strong absorption (NH1023 cm-2) and in positive residuals around 6.4 keV (Fig. 4). Adding a narrow Gaussian line to the power-law continuum, we obtain a better fit, resulting in a line energy of keV, compatible with being produced by Fe Kα fluorescence. The spectral parameters of the average X–ray spectrum are listed in Table LABEL:tab:av_spec. The average flux, F, of 1.1610-11 erg cm-2 s-1 (corrected for the absorption), translates into an X–ray luminosity of 1034 erg s-1 (assuming a distance of 2.8 kpc, Nespoli et al. 2008). Note however that, given the large uncertainty in the distance determination (Nespoli et al., 2008), this luminosity can range from 1.71033 erg s-1 (at 1.1 kpc) to 8.21034 erg s-1 (at 7.7 kpc).
 |
 |
The hard X-ray spectrum extracted from the HXD-PIN field of view (FOV) is much brighter than the extrapolation at higher energies of the XIS power-law best-fit. Indeed, the HXD-PIN flux (1.510-10 erg cm-2 s-1, after taking into account CXB and GRXE) in the energy range 15–25 keV is 15 times greater than that calculated extrapolating at high energies the power-law best fit to the XIS spectrum. Note however that this latter extrapolated flux should be considered as a conservative upper limit, since IGR J16479–4514 typically shows a spectral cut-off above 10 keV. This implies a strong contamination by other X–ray sources in the FOV, probably a residual contamination by the Z-track low-mass X-ray binary GX340+0, located at about 34 arcmin from IGR J16479–4514, and/or an unknown bright hard X–ray transient. For this reason, we will not discuss it further.
| Parameter | Power-law | Power-law + Gaussian line |
|---|---|---|
| NH | ||
| Fline | 7.4 | |
| EW (eV) | 70 | |
| Eline (keV) | ||
| Unabs. Flux | 1.16 | 1.16 |
| LX | 1.09 | 1.09 |
| /dof | 1.018/ 2172 | 0.991/2169 |
The hardness ratio is variable (Fig. 2) especially during eclipse, where the emission appears softer and/or less absorbed, so we next explored the variability of the spectral parameters in dependence of the orbital phase performing a time-selected spectroscopy extracting counts from the same intervals indicated in Fig. 1. During the eclipse a remaining detectable flux is present, as typical in eclipsing high mass X–ray binaries, mainly produced by Thomson scattering into the line of sight of the direct component by free electrons residing in the supergiant wind (Haberl, 1991). We fit the spectra with an absorbed power-law model, resulting in a less absorbed and softer spectrum during the eclipse compared to the other time intervals (Table LABEL:tab:spec). The absorption during the eclipse is consistent with the interstellar reddening observed to the optical counterpart (Nespoli et al., 2008), while that measured outside the eclipse is significantly higher, and consistent, within the uncertainties, with being constant, at about NH1023 cm-2. The X–ray emission is harder when the source is brighter (X–ray flares), a typical behaviour observed in SFXTs and in accreting pulsars.
We next added a narrow Gaussian line to the single power-law model, resulting in the parameters reported in Table LABEL:tab:spec and shown in Fig. 5. The resulting continuum power-law parameters are fully compatible, within the uncertainties, with those derived without the Gaussian line, so we do not report them again in Table LABEL:tab:spec. The energy of the narrow line indicates Kα emission from neutral (or almost neutral) iron. Its equivalent width (EW) has been calculated with respect to the power-law continuum, and its large value during the eclipse is due to the fact that it has been calculated with respect to the scattered component. The direct eclipsed X–ray emission is unknown, given the large source variability. The intensity of the fluorescence Fe Kα line is correlated with the unabsorbed hard X–ray flux (above 7 keV), at least outside the eclipse (Fig. 6).
Finally, we adopted a power-law model together with a Gaussian line, but now fixing the power-law photon index to 1.35, the value obtained from the average spectrum. The fits are acceptable and the resulting values of the absorbing column density show now some variability, again with the less absorbed spectrum seen during the eclipse. More complex models are not required by the count statistics of the data and result in unconstrained spectral parameters.
| 1 | 2 | 3 | 4 | 5 | 6 | 7 | 8 | |
| Power-law | ||||||||
| NH | ||||||||
| Obs. Flux (1-10 keV) | 0.014 | 0.13 | 1.23 | 2.9 | 0.7 | 3.6 | 4.2 | 0.6 |
| Unabs. Flux (1-10 keV) | 0.045 | 0.22 | 1.9 | 4.7 | 1.2 | 5.9 | 6.8 | 1.1 |
| LX | 0.042 | 0.21 | 1.8 | 4.4 | 1.1 | 5.5 | 6.4 | 1.0 |
| /dof | 1.672/48 | 1.047/64 | 0.836/88 | 1.092/227 | 0.922/634 | 1.001/435 | 0.887/518 | 1.130/656 |
| Power-law + Gaussian line | ||||||||
| Fline (10-5 ph cm-2 s-1) | 1.9 | |||||||
| EW (eV) | a | 280 | 130 | 40 | 60 | 80 | 80 | 50 |
| Eline (keV) | 6.4 (fixed) | 6.38 | 6.34 | 6.32 | ||||
| /dof | 1.576/45 | 0.934/61 | 0.771/85 | 1.097/226 | 0.910/631 | 0.973/432 | 0.861/515 | 1.118/653 |
| Unabs. Flux (7–10 keV) | 0.0009 | 0.05 | 0.60 | 1.40 | 0.30 | 1.63 | 1.97 | 0.26 |
| Power-law + Gaussian line | ||||||||
| NH | ||||||||
| 1.35 fixed | 1.35 fixed | 1.35 fixed | 1.35 fixed | 1.35 fixed | 1.35 fixed | 1.35 fixed | 1.35 fixed | |
| /dof | 1.920/46 | 0.923/62 | 0.799/86 | 1.118/227 | 0.913/632 | 0.963/433 | 0.870/516 | 1.132/654 |
a The large EW during eclipse is calculated with respect to the scattered power-law continuum.


4 Discussion
The long observation we have reported on here, allows us to investigate the properties of a SFXT as continuously as possible within one single orbital cycle for the first time. This has been made possible by the short orbital period of IGR J16479–4514 which is the SFXT with the shortest orbit known to date. The X–ray source shines with an average low luminosity LX1034 erg s-1, (if a distance of 2.8 kpc is assumed) and no bright flares (exceeding LX1036 erg s-1) have been caught during this observation. Nevertheless, a high amplitude variability is observed, spanning more than two orders of magnitude (including the X–ray eclipse). The absence of signatures from highly ionizing illuminating continuum further confirms a low source X–ray luminosity.
We can distinguish several types of variability on different timescales, especially evident in the energy range 3–10 keV. On long timescales of tens of ks we observe three main intensity states: the end of the eclipse by the supergiant companion (which we covered for about 46 ks), a transition phase to the uneclipsed emission (time interval n.2 in Fig. 1, lasting 38 ks) and the intra-flare low luminosity emission which covers most of the remaining orbit (40%), lasting around 110 ks (time intervals n.5 and n.8).
X–ray flares with different durations are present: two main low luminosity flares, lasting 10–15 ks, with a complex and structured shape, punctuate the orbit, reaching peak luminosities of 4.4 and 6.41034 erg s-1 (at 2.8 kpc), separated by about 0.2 in orbital phase. Their 0.2–10 keV spectra are harder than the intra-flare X–ray emission, as usually observed in SFXTs and accreting pulsars. Even in the part of the orbit in-between the two main low luminosity flares, the source exhibits a large intensity variability on timescale of 1000 s. This low luminosity flaring activity had already been unveiled in SFXTs (and in IGR J16479–4514) thanks to /XRT long term monitoring observations (Sidoli et al., 2008).
In the softer light curve the X–ray eclipse appears longer and there is no evidence for the presence of the transition phase (time interval n.2) clearly present in the hard light curve. Thus the eclipse egress appears to be energy dependent. This behaviour is similar to that reported by Jain et al. (2009) from the shape of the IGR J16479–4514 folded light curves observed with and with /BAT, where the X–ray eclipse seems more evident at higher energies and with sharper transitions. There is also a similarity of the IGR J16479–4514 temporal variability near eclipse egress with what has been observed in the HMXB 4U1700–37 (van der Meer et al. 2005 and references therein), showing a variable eclipse duration and a similar egress phase. The long duration (38 ks) of this phase roughly corresponds to a region as large as the companion radius (although a precise determination of both the donor radius and of the system inclination is lacking), probing the innermost structure of the supergiant wind.
On shorter timescales of around 1000 s we observe two sharp transitions, indicated in Fig.3 by the four contacts ti: (1) from the eclipse to time interval n. 2, which shows an intermediate level between the eclipse remaining flux and the un-eclipsed flux, and (2) from time interval n. 2 to the first flare. Given that the compact object is point-like with respect to the supergiant companion, the first short transition likely probes the transition out off behind the stellar atmosphere, which, assuming an orbital velocity of a few hundreds km s-1, results in a linear size of around a few 1010 cm. The second sharp transition is interestingly coincident with the rising phase to the first X–ray flare, suggesting a possible physical connection (see the discussion below).
An iron line is detected along the orbit, with a line energy of 6.4 keV, indicative of neutral iron or an ionization state lower than Fe xviii (Kallman & McCray, 1982). A correlation is observed between the iron fluorescent line flux and the illuminating unabsorbed flux above 7 keV, as expected (Inoue, 1985) outside the eclipse (Fig. 6). The line flux observed during eclipse does not show evidence for a reduction, within the large uncertainties, with respect to the value detected during the intra-flare emission, so most of the fluorescing matter is located far away from the compact object. Note that we calculate the equivalent width of the line with respect to a single power-law continuum. If the fluorescing matter is optically thin to the illuminating continuum, the luminosity of the iron Kα line depends on the spectrum and X–ray luminosity of the central source, on the covering fraction of the illuminated matter and iron abundance (e.g. Sako et al. 1999). Given the large uncertainties on the EW (especially huge during the eclipse phase) and the variability of the covering factor along the orbital phase, also considering the likely presence of different large-scale structures in the supergiant wind which can be obvious, although unknown, sites of fluorescing material, it is not possible to gain further constraints on the properties of the reprocessing wind (also the supergiant surface becomes a reprocessor only visible at certain orbital phases).
Considering the spectroscopy, a more physical description of the X–ray spectrum in an eclipsing HMXB involves the presence of two power-law continua, accounting for the direct and scattered component with the latter produced by Thomson scattering by free electron in the companion wind and/or on the supergiant surface (Haberl, 1991). Both the direct and the scattered components should have the same spectral slope, since Thomson scattering is energy independent. This implies that the only way to disentangle these two components is the different absorptions, the scattered component being less absorbed than the direct one. During the X–ray eclipse, where the direct component is unseen, the X–ray emission should only be due to scattering. Indeed, fitting this spectrum with a power-law with a photon index fixed at the average slope of =1.35, the eclipse shows the lowest absorption, consistent with the interstellar value (Nespoli et al., 2008). Unfortunately, given the high absorption (local and interstellar) and the low statistics, we could not find better contraints to the spectral parameters adopting more complex models.
Also the egress X–ray emission (n. 2) in IGR J16479–4514 is likely dominated by the scattered component, given the high EW of the iron line compared to that measured during the out-of-eclipse emission (time intervals from n. 3 to n. 8). A possibility is that most of the direct X–ray emission in this orbital region is blocked by a large scale wind structure, as that invoked to explain the periodically recurrent outbursts in the SFXT IGR J11215–5952 (Sidoli et al., 2007), or by dense shells or other kind of inhomogeneities present in hot massive stars winds (see, e.g., Oskinova et al. 2012 or Lobel & Blomme 2008). This implies that most of the X–ray emission in this time interval is scattered X–ray emission, which is less absorbed because mainly produced by less dense wind material located off the orbital plane and farther away from the companion star. This could explain why the observed column density in time interval n. 2 is not larger than in the remaining (fully out-of-eclipse) part of the orbit.
The likely presence of large scale structures in the supergiant wind is also suggested by the orbital phase of the first flare, which is compatible (within the uncertainties, see Sect. 3.1) with the location along the orbit of other bright flares observed in the past in IGR J16479–4514 (0.36; Bozzo et al. 2009). This suggests that the flares are triggered by a higher accretion rate during the passage inside a phase-locked denser wind component, like the one predicted by Sidoli et al. (2007). This seems to be also indicated by the fact that, interestingly, the egress X–ray emission (n. 2) ends with the sharp transition to the first X–ray flare (see Sect. 3.1). If this explanation is correct, after the first flare, the compact object lies in-between the observer and the dense wind structure, with the direct X–ray emission finally dominating the observed X–rays along the remaining part of the orbit.
The second flare, spaced by about 0.2 in phase, could be reconciled by the crossing of a similar wind component, if the orbit is eccentric (as in the light curves simulated by Ducci et al. 2009), or by the compact object approaching the periastron passage. Unfortunately, we lack any information about the other orbital parameters (e.g. eccentricity) to be able to confirm this hypothesis.
The absorbing column density is always in excess of the interstellar reddening and does not show evidence for variability along the orbit (if also the slope of the power-law is mantained free), except that during the eclipse. On the other hand, if the power-law slope is fixed to the value of the average spectrum (=1.35), variability is present, with more absorption during the low luminosity flares.
The only known orbital parameter is the period of 3.32 days. We did not observe the eclipse ingress, so we cannot constrain the companion radius, Ropt. On the other hand, Ropt can be estimated from the supergiant spectral type and requiring that the star does not overflow its Roche lobe. The spectral type of the supergiant (O8.5I or O9.5I) suggests a mass in the range Mopt=30–34 and a radius of 22-23 R⊙ (Martins et al., 2005). A further constraint on the stellar size comes from the fact that the companion should not overlflow its Roche lobe radius (Eggleton, 1983). This suggests a donor mass around Mopt=35 and a stellar radius Ropt=20 R⊙. Adopting these values, the orbital period translates into an orbital separation of about 2.21012 cm.
We can use the X–ray eclipse to probe the supergiant properties, as follows (see, e.g., Lewis et al. 1992). The average total intensity during the eclipse is about 5% of the out-of-eclipse, intra-flare X–ray intensity, so the wind density can be obtained as = , where is the Thomson scattering cross section and a is the orbital separation, which we assume as the characteristic path lenght through the system. This results in a wind density at the orbital separation, , of 710-14 g cm-3. The mass continuity equation can be used to derive the ratio between the wind mass-loss rate and the terminal velocity, as =4 ) , assuming a spherical geometry for the outflowing wind and a velocity gradient for the wind velocity, , of 1 (Castor et al., 1975). This results in a ratio =710-17 M⊙/km. For terminal velocities in the range 500–3000 km s-1, the mass loss rate is in the range =1–710-6 M⊙/yr. Assuming direct accretion from the wind, the accretion rate can be estimated as =, where Racc is the accretion radius. This accretion rate translates into an X–ray luminosity LX=3–151036 erg s-1 for the range of parameters estimated before, which is two orders of magnitude greater than that we observe.
Given the high wind density we have calculated, it is unlikely that the low luminosity in IGR J16479–4514 is due to the direct wind accretion. Our findings seems to agree with the recent results by Oskinova et al. (2012), who have demonstrated that simple Bondi-Hoyle accretion from a clumpy wind over-predicts the observed X–ray variability in HMXBs. This suggests the presence of some mechanism able to damp the strong X–ray variations implied by the structured supergiant winds (Oskinova et al., 2012). This can be due to the details (still poorly known) of the interaction of the accretion flow with the shocks in the accretion wake, leading, for example, to a transitional case of accretion regime, intermediate between Roche Lobe Overflow and direct accretion (as originally proposed for the SFXT IGR J16418–4532, given its short orbital period (Sidoli et al., 2012), which displays a similar X–ray intensity variability).
The role of the magnetospheric surface in reducing the accretion rate onto the NS in SFXTs have been studied by several authors (Bozzo et al. 2008a, Ducci et al. 2010, Shakura et al. 2012b). Bozzo et al. (2008) have invoked magnetar-like NS with slow pulsations, to halt the accretion most of the time and allow only a residual flow of matter (producing 1034 erg s-1) by means of Kelvin-Helmholtz instability. Shakura et al. (2012a) have proposed that the low X–ray luminosity state (1034 erg s-1) sometimes observed in persistent accreting pulsars and in SFXTs could be due to subsonic quasi-spherical accretion onto slowly rotating pulsars, where the accretion of matter is mediated by a quasi-static shell above the NS magnetosphere. In this case, the accretion rate from the quasi-static shell depends on the ability of the plasma to enter the magnetosphere by means of plasma cooling. These authors suggest that transitions between low-luminosity states to bright flaring activity in SFXTs could be due to transitions between two different regimes of plasma cooling: from thermal plasma cooling to Compton cooling dominated regime. Unfortunately, none of these models can be confirmed to date, since both the pulsation period and the magnetic field in IGR J16479–4514 (and in most of SFXTs) are unknown.
5 Conclusion
The new observations we have reported here allowed us to perform an in-depth investigation of the properties of the SFXT IGR J16479–4514 along one orbital cycle, and to obtain the following results:
-
•
the source spends most of the observation with an average out-of-eclipse (intra-flares) X–ray luminosity of 1034 erg s-1, with several kinds of variabilities on different timescales, but with no bright flares (exceeding 1036 erg s-1) during the observed orbital cycle. Given long-term monitoring performed with previous missions, this is very likely the most typical appearence of an orbital cycle in this SFXT;
-
•
the absorbing column density does not show evidence for variability, within the uncertainties, except from during the X–ray eclipse;
-
•
the remaining flux during the X–ray eclipse, produced by Thomson scattering, allowed us to estimate the wind density at the orbital separation, resulting in =710-14 g cm-3;
-
•
assuming a circular orbit and a spherical geometry for the supergiant wind, the derived wind density translates into a ratio 10-17 M⊙/km. Since the accretion luminosity implied by this ratio, assuming terminal velocities in the range 500–3000 km s-1, is at least two orders of magnitude higher than that observed, we can conclude that a mechanism mediating the accretion onto the putative neutron star in the system is likely to be at work to reduce the mass accretion rate.
Acknowledgments
This work is based on data from observations with . This work was supported by the grant from PRIN-INAF 2009, “The transient X–ray sky: new classes of X–ray binaries containing neutron stars” (PI: L. Sidoli). AB received funding from NASA grant 11-ADAP11-0227. LS is grateful to Angela Bazzano and Tim Oosterbroek for very helpful comments and suggestions. PE thanks Sara Motta for fruitful discussions. This research has made use of the IGR Sources page maintained by J. Rodriguez & A. Bodaghee (http://irfu.cea.fr/Sap/IGR-Sources/).
References
- Balucinska-Church & McCammon (1992) Balucinska-Church M., McCammon D., 1992, ApJ, 400, 699
- Bozzo et al. (2008a) Bozzo E., Falanga M., Stella L., 2008a, ApJ, 683, 1031
- Bozzo et al. (2009) Bozzo E., Giunta A., Stella L., Falanga M., Israel G., Campana S., 2009, A&A, 502, 21
- Bozzo et al. (2008b) Bozzo E., Stella L., Israel G., Falanga M., Campana S., 2008b, MNRAS, 391, L108
- Castor et al. (1975) Castor J. I., Abbott D. C., Klein R. I., 1975, ApJ, 195, 157
- Chaty et al. (2008) Chaty S., Rahoui F., Foellmi C., Tomsick J. A., Rodriguez J., Walter R., 2008, A&A, 484, 783
- Ducci et al. (2009) Ducci L., Sidoli L., Mereghetti S., Paizis A., Romano P., 2009, MNRAS, 398, 2152
- Ducci et al. (2010) Ducci L., Sidoli L., Paizis A., 2010, MNRAS, 408, 1540
- Eggleton (1983) Eggleton P. P., 1983, ApJ, 268, 368
- Fukazawa et al. (2009) Fukazawa Y. et al., 2009, PASJ, 61, 17
- Gruber et al. (1999) Gruber D. E., Matteson J. L., Peterson L. E., Jung G. V., 1999, ApJ, 520, 124
- Haberl (1991) Haberl F., 1991, A&A, 252, 272
- Inoue (1985) Inoue H., 1985, Space Science Reviews, 40, 317
- Jain et al. (2009) Jain C., Paul B., Dutta A., 2009, MNRAS, 397, L11
- Kallman & McCray (1982) Kallman T. R., McCray R., 1982, ApJS, 50, 263
- Kennea et al. (2005) Kennea J. A., Pagani C., Markwardt C., Blustin A., Cummings J., Nousek J., Gehrels N., 2005, Astron. Tel., 599, 1
- Koyama et al. (2007) Koyama K. et al., 2007, PASJ, 59, 23
- La Parola et al. (2009) La Parola V. et al., 2009, Astron. Tel., 1929, 1
- Lewis et al. (1992) Lewis W., Rappaport S., Levine A., Nagase F., 1992, ApJ, 389, 665
- Lobel & Blomme (2008) Lobel A., Blomme R., 2008, ApJ, 678, 408
- Markwardt & Krimm (2006) Markwardt C. B., Krimm H. A., 2006, Astron. Tel., 816, 1
- Martins et al. (2005) Martins F., Schaerer D., Hillier D. J., 2005, A&A, 436, 1049
- Mitsuda et al. (2007) Mitsuda K. et al., 2007, PASJ, 59, 1
- Molkov et al. (2003) Molkov S., Mowlavi N., Goldwurm A., Strong A., Lund N., Paul J., Oosterbroek T., 2003, Astron. Tel., 176, 1
- Nespoli et al. (2008) Nespoli E., Fabregat J., Mennickent R. E., 2008, A&A, 486, 911
- Oskinova et al. (2012) Oskinova L. M., Feldmeier A., Kretschmar P., 2012, MNRAS, 421, 2820
- Rahoui et al. (2008) Rahoui F., Chaty S., Lagage P.-O., Pantin E., 2008, A&A, 484, 801
- Ratti et al. (2010) Ratti E. M., Bassa C. G., Torres M. A. P., Kuiper L., Miller-Jones J. C. A., Jonker P. G., 2010, MNRAS, 408, 1866
- Romano et al. (2009) Romano P. et al., 2009, MNRAS, 399, 2021
- Romano et al. (2008) Romano P. et al., 2008, ApJL, 680, L137
- Sako et al. (1999) Sako M., Liedahl D. A., Kahn S. M., Paerels F., 1999, ApJ, 525, 921
- Sguera et al. (2005) Sguera V. et al., 2005, A&A, 444, 221
- Sguera et al. (2008) Sguera V. et al., 2008, A&A, 487, 619
- Sguera et al. (2006) Sguera V. et al., 2006, ApJ, 646, 452
- Shakura et al. (2012a) Shakura N., Postnov K., Hjalmarsdotter L., 2012a, ArXiv e-prints
- Shakura et al. (2012b) Shakura N., Postnov K., Kochetkova A., Hjalmarsdotter L., 2012b, MNRAS, 420, 216
- Sidoli (2010) Sidoli L., 2010, in 25th Texas Symposium on Relativistic Astrophysics
- Sidoli et al. (2012) Sidoli L., Mereghetti S., Sguera V., Pizzolato F., 2012, MNRAS, 420, 554
- Sidoli et al. (2008) Sidoli L. et al., 2008, ApJ, 687, 1230
- Sidoli et al. (2007) Sidoli L., Romano P., Mereghetti S., Paizis A., Vercellone S., Mangano V., Götz D., 2007, A&A, 476, 1307
- Takahashi et al. (2007) Takahashi T. et al., 2007, PASJ, 59, 35
- Valinia & Marshall (1998) Valinia A., Marshall F. E., 1998, ApJ, 505, 134
- van der Meer et al. (2005) van der Meer A., Kaper L., di Salvo T., Méndez M., van der Klis M., Barr P., Trams N. R., 2005, A&A, 432, 999
- Walter & Zurita Heras (2007) Walter R., Zurita Heras J., 2007, A&A, 476, 335
- Walter et al. (2006) Walter R. et al., 2006, A&A, 453, 133
- Wilms et al. (2000) Wilms J., Allen A., McCray R., 2000, ApJ, 542, 914