A large-scale study of the World Wide Web:
network correlation functions with scale-invariant boundaries
Abstract
We performed a large-scale crawl of the World Wide Web, covering Million domains, including all high-traffic sites of the Internet. We present a study of the correlations found between quantities measuring the structural relevance of each node in the network (the in- and out-degree, the local clustering coefficient, the first-neighbor in-degree and the Alexa rank). We find that some of these properties show strong correlation effects and that the dependencies occurring out of these correlations follow power laws not only for the averages, but also for the boundaries of the respective density distributions. In addition, these scale-free limits do not follow the same exponents as the corresponding averages. In our study we retain the directionality of the hyperlinks and develop a statistical estimate for the clustering coefficient of directed graphs.
We include in our study the correlations between the in-degree and the Alexa traffic rank, a popular index for the traffic volume, finding non-trivial power-law correlations. We find that sites with more/less than about links from different domains have remarkably different statistical properties, for all correlation functions studied, indicating towards an underlying hierarchical structure of the World Wide Web.
pacs:
89.20.Hh 89.75.-kI Introduction
The emergence of the World Wide Web (WWW) belongs arguably to the most relevant events of the present time. The interest in this system and in networks in general permeated through all the society, including physics. This led, at the turn of the century, to a large amount of studies of what with the time came to be known as “network science”. Most studies of the WWW were performed, however, in the early 2000s Broder et al. (2000a); Barabási and Albert (1999); Dogorostev and Mendes (2003) and large-scale studies of the WWW are rather hard to find nowadays, despite the immense growth of the Internet in the last 10 years.
A remarkable finding of the first generation studies of the WWW is the emergence of scale-free degree distributions, which can be explained potentially from the view of preferential attachment, although the exponents obtained are not universal Dogorostev and Mendes (2003). Generally, one can assume that the growth process of a complex network will be influenced by inter-node correlations and that these dependencies will be reflected in the resulting network topology. However, such correlations are not easy to detect and characterize, and have not been studied in depth. It is expected that a simple rule as preferential attachment cannot completely reproduce the structures found in real-world networks, and therefore more complicated models have been developed to replicate the behavior Krapivsky et al. (2000); Dorogovtsev et al. (2000); Pastor-Satorras et al. (2001); Song et al. (2005); Caldarelli et al. (2002).
Correlations between different properties are generally used as a proxy to study the internal structure of the network. For instance, Vespagnani studied correlations between the in-degree of a node and that of a first neighbor of said node Pastor-Satorras et al. (2001), showing a scale free property (recently modeled by Takagi Takagi (2012)), Barabasi and Albert studied the local clustering coefficient as a function of the in-degree Ravasz and Barabási (2003), in order to obtain information regarding the hierarchical structuring of the network. However, real-world data about said correlations is not abundant.
In the present work we study the complete dominant core of the WWW by crawling Million domains, including all domains with the largest traffic (all domains with an Alexa rank of one Million or less are included). Collapsing the data, by neglecting link multiplicities, we study the network of inter-domain hyperlinks (not webpages), containing about half a Billion directed edges. We find non-trivial correlations between in- and out-degree, between the in-degree and the local clustering coefficient and between the degrees of neighboring sites. In addition to evaluate averaged quantities, we study the full density plots, finding novel scaling features for the boundaries of several correlation functions. We present, in addition, a formula for the clustering coefficient of random directed graph characterized by given arbitrary in- and out-degree sequences. Finally we present an analysis of the correlations between the number of in-links and the Alexa rank of a domain.

II Theory
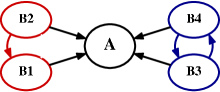
For directed graphs we have to distinguish between the distribution and of the in- and the out-degrees and , respectively. There are, in addition, two kinds of nearest neighbors, in-neighbors and out-neighbors. Site B1 in Fig. 1 is a nearest in-neighbor of site A and a nearest out-neighbor of site B2. Alternatively one could call B1 an ancestor of A and a descendent of B2 Gros (2008). For bi-directional links, as between B3 and B4 in Fig. 1, in-neighbors are also out-neighbors. The total number of in-links equals the total number of out-links, the in- and out-degree coordination numbers
| (1) |
are hence identical.
II.1 Clustering coefficient model for directed graphs
In order to calculate the relevance of correlations between in- and out- degree in the structure of the network, we have developed a statistical model of the clustering coefficient for given distributions of in- and out- degree which are uncorrelated.
We define with
| (2) |
the excess distribution Newman and Park (2003) of outgoing links of a nearest in-neighbor. The normalization constant is just the coordination number , see (1). Equivalently we define via
| (3) |
the degree distribution (not excess) of incoming links of a nearest in-neighboring site. Here is the probability that a site has out-links and in-links (joint distribution function), with the usual relations
| (4) | |||||
| (5) |
for the marginal distribution functions. The normalization constant in (3) is given by the coordination number ,
For the clustering coefficient (the ‘hat’ symbol stands here for the clustering coefficient of a directed graph) we now consider two in-neighbors, having respectively, with probabilities and , in-links and excess out-links (as stubs).
We now assume that the distributions and of the two neighbors are independent of each other. The probability, for a graph with nodes, that a given pair of in- and out-stubs are connected is then , where is the total number of in- or out-stubs, and hence
Transforming now into a sum over sites, every site being characterized by an in-degree and out-degree , one obtains
| (6) |
which coincides with the usual expression Gros (2008) for non-directed graphs (apart from a factor instead of in the first factor), by taking for . A fully-connected network results in under this formula.
We note that the expression (6) for may actually violate the sum rule , due to the neglect of inter-site degree correlations, when applied to a real-world graph. As an example consider a network composed out of a single star, like the site C in Fig. 1, but with bi-directional edges. For a un-directed (and loopless) star the degree sequence is
with an intensive coordination number . The statistical formula (6) for the clustering coefficient would, one the other hand, diverge
in the thermodynamic limit . A substantial deviation of from the true clustering coefficient is hence a measure for the strength of inter-site degree correlations, the expression (6) being valid for graphs with vanishing inter-node correlations.
III Results
Using the crawlers of the former file search engine FindFiles.net Gros et al. (2012) we crawled, mostly in 2011, Million domains (of type http://www.domain.com) with a total of Million subdomains (of type http://subdomain.domain.com). These Million domains have 223 Million hyperlinks in between them, linking in addition to 50 Million other sites. For the network analysis we neglected these 50 Million external sites, as we did not crawl them separately. The network of 223 Million inter-domain directed links has an average degree of 32 and Million of the Million domains are isolated in the sense that they have no in-links, they cannot be reached from the core of the World Wide Web. A further one Million sites have just a single hyperlink directed to them.
The crawling strategy started from the set of the about 32 Million subdomains referred-to in Wikipedia and DMOZ (all languages), with further systematic additional extensions. We included, in particular, the one Million domains with the largest traffic volume, in terms of the Alexa rank. This data set, which we denote with FF-2011, hence corresponds essentially to the complete relevant part of the World Wide Web, in terms of traffic volume.
III.1 In- and out-degree distributions
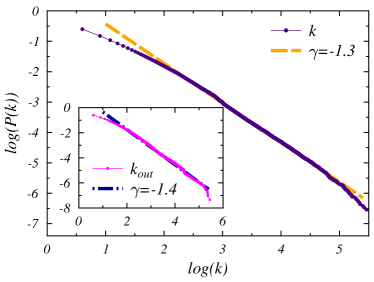
The degree distribution of hyperlinks have been observed to follow a power law , with an exponent close to the limiting case (when the mean degree would diverge in the thermodynamic limit) Barabási and Albert (1999); Albert et al. (1999); Albert and Barabási (2002); Dogorostev and Mendes (2003). In Fig. 2 we present the complementary cumulative distribution functions Markovic and Gros (2013) for both the in-degree and the out-degree.
Over a range of about 2.5-3 orders of magnitude, the data can be approximated quite nicely by power law distributions, with exponents and respectively for the in- and the out-degree. These results confirm earlier studies Barabási et al. (2000); Broder et al. (2000b); Gros et al. (2012) finding consistently . The absolute magnitude of the values reported for the scaling exponents vary slightly from study to study, either because of the evolution of the Internet with time passing, or due to the size of the respective databases.
III.2 Correlations between in- and out-degree
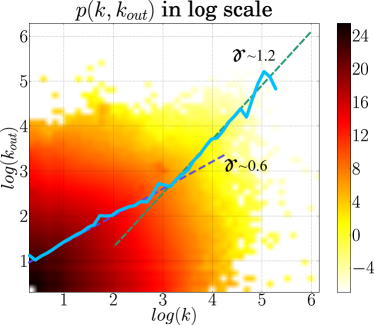
In Fig. 3, the density distribution of nodes having an in-degree and an out-degree , is presented, together with the average out-degree , for sites having an in-degree . In- and out-degree do not seem to be particularly correlated, on a first sight. However, the average out-degree shows two regimes with approximated power-law scaling, for and , with exponents and respectively. In the case that the joint distribution would factorize, , the mean out-degree
| (7) |
would functionally follow the in-degree distribution , where is the average (in- and out-) degree of our Internet data. However, as shown in Fig. 2, the marginal in-degree distribution , falls approximately like , viz substantially faster than (7) would imply. In- and out-degree are hence non-trivially correlated. We will discuss the nature of the respective correlations in more detail further below when discussing the distribution of local clustering coefficients.
III.3 Mean clustering coefficient
The local clustering coefficient is given by the number of linked nearest neighbors of site , relative to the total number of possible links between the neighbors. For directed graphs there are in- and out-neighbors and various possible 3-site loops, as illustrated in Fig. 1, also known as network motifs Milo et al. (2002); Alon (2007). Here we examine the in-clustering coefficient. For a given site the in-clustering coefficient is given by the average number of links in between the in-neighbors of site . In Fig. 1, the sites (B1,A,B2) form an in-loop of site A, contributing to , while the sites (B4,A,B3) contribute two in-loops. We focus on the in-clustering coefficient since the number of in-links is a measure for the importance of a site, contributing to its traffic volume.
We find, for the FF-2011 network data, a mean clustering coefficient of . This is, for two reasons, a surprising high value. Firstly the connection probability is very low, being just . Secondly a quite large number of sites, 0.27%, has a vanishing local clustering , and only a small fraction, 0.3%, of domains, mostly with small degrees, have a maximal local clustering coefficient of unity.
We can assess the impact of correlations on the formation of local loops by considering identical degree sequences for the in- and out- degree, as extracted from the FF-2011 network data, but considering various types of correlations between the in- and out- degree of each node.
- •
-
•
For a network having the same degree distributions and for the in- and the out-degree as the actual network, but without correlations between these degrees, viz assuming a joint probability distribution , the clustering coefficient obtained by Eq. (6) would amount to .
-
•
A network where the in- and out- degrees are anticorrelated (nodes with largest in-degree are mapped to the smallest out-degree), would amount to an even lower .
-
•
For a network with a maximally correlated distribution of in- and out- degree (nodes with the largest in-degree being mapped to the largest out-degree), would result again in a higher-than-unity clustering coefficient , when using Eq. (6).
We hence conclude that the in- and out-degree are quite strongly correlated positively for the World Wide Web.
III.4 Distribution of local clustering coefficients
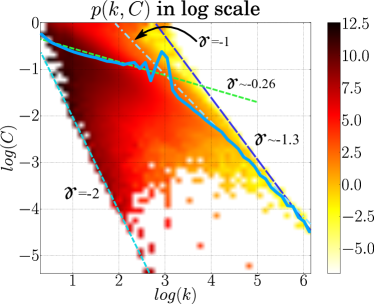
In Fig. 4, the density of pairs is shown in a log-log scale, where is the in-degree and the local clustering coefficient. The density distribution has upper and lower cutoffs scaling approximatively like , with and . The lower limit has a simple explanation. The lowest non-zero local clustering coefficient is realized when just a single loop exist out of the possible triangles,
| (8) |
when setting the number of loops to one. The exponent of the upper limit, , implies, compare (8), that the number of local loops scales like . We have presently no explanation for this scaling behavior.
The average value of , as a function of in-degree , follows mostly a power law for small , with an exponent . For larger the exponent changes toward for the mean local clustering coefficient. This last exponent is in agreement with previous observations found in Ravasz and Barabási (2003), and are a fingerprint for a hierarchical network structure. The change in behavior at the point is also observable in the correlation between the in-degree and the degree of nearest neighbors, as we will show in the next sections.
There is a group of nodes with very high clustering coefficients around the region (close to where the upper limit with the slope intersects the abscissa), which somewhat falls of the line. After analyzing some of the domains involved in this region, we conclude that this group of nodes does not represent the intrinsic network structure of the WWW, belonging most probably to link farms. These nodes are however responsible for the jumps in at .
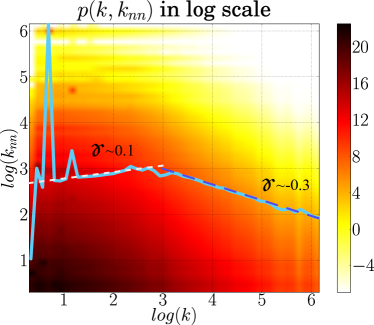
III.5 Nearest-neighbor degree correlations
In Fig. 5, the density of pairs is shown, where is the in-degree of a first neighbor, and the in-degree. The dots with higher densities for low values are relatively large groups of linked domains which share exactly the same pairs of in-degree and first-neighbor in-degree. The domains do not seem to be particularly related although we do not discard the possibility that they may belong to link farms, as they clearly stand out of the general behavior of the density distribution.
When analyzing the average as a function of the in-degree , we observe a very weak increase for small until . We can fit this increase fairly good with a power law of exponent . This behavior would be in agreement with the one observed in the canonical Barabasi-Albert model Barabási and Albert (1999); Albert et al. (1999), though it differs with with a 1998 WWW network study Albert et al. (1999).
In the range from to we observe a change in the behavior of the average , as it starts decaying with increasing . This decay follows a power-law as well, with an exponent of about . This decay is closer to the results found in Albert et al. (1999) for a subset of the 1998 Internet data and the fitness model developed therein (which decays with ). However, the decay is observed in our results for much higher degree than in Albert et al. (1999), which has data limited to . We speculate that this difference is due to the size of the network studied, although it might be possible that the evolution of the WWW in the last 10 years is responsible for the structural change.
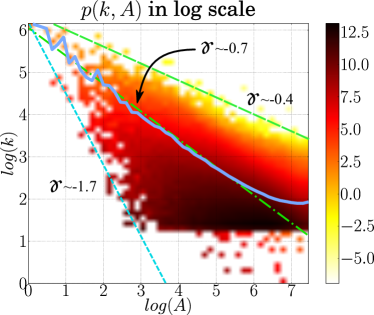
III.6 Correlations between in-degree and Alexa index
We have analyzed the correlations of the Alexa rank ale (a) with respect to the in-degree . The Alexa rank is arguably one of the most popular measures of the traffic received by an Internet site, and so, its relevance. The ranking is proprietary, so the general public does not have access to the specifics of its calculation, although according to the official information, it is derived from the traffic observed, with data partly retrieved from users who installed the Alexa add-on to their web browser ale (b). In this ranking, the site with the most traffic has rank , the following largest rank and so on. The rank does not provide any information about the precise amount of traffic, such that a larger index does not give any indication of how much less traffic does that site receives, but rather only that it receives less traffic than the sites with smaller .
In Fig. 6, we present the density of domains as a function of its in-degree and Alexa rank . We only analyze the Alexa rank for sites having an in-degree , with a few exceptions, due to constraints in retrieving the Alexa rank data. We observe a distribution limited from above and below by two power laws with exponents and . The lower limit is however less pronounced, due to the lack of samples.
The solid line in Fig. 6 shows the average in-degree , for sites having and Alexa rank . We observe a very marked power law decay
| (9) |
The exponents are not the inverse of each other, since and are distinct averages. There is a saturation at for the scaling regime, presumable due to our constraint for the Alexa index. We find this scaling particularly interesting, since the Alexa rank is not derived directly from the topology of the network but rather from the traffic generated by users. For site administrators the relatively weak decay (9) implies that the traffic generated by in-coming hyperlinks can be a relevant contribution to the overall traffic volume.
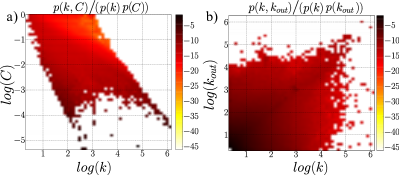
III.7 Normalization Studies
We have performed a visualization study of the data discussed hitherto by considering relative joint distribution functions, which are obtained by dividing a given joint probability distribution by the product of the respective marginal distributions,
In the absence of correlations, viz when , the respective density plots would be homogeneous and flat.
In Fig. 7a, we show the relative density for pairs of in-degree and local clustering coefficient . The distribution is quite homogeneous and the upper and lower limits of the distribution are exalted in comparison with the plot of the bar joint distribution presented in Fig. 4.
In Fig. 7b, we present the relative joint density for the correlation between in- and out-degree. The distribution is considerably more homogeneous than the respective bare probability density shown in Fig. 3. However, a substantial enhancement remains for small in- and out- degrees.
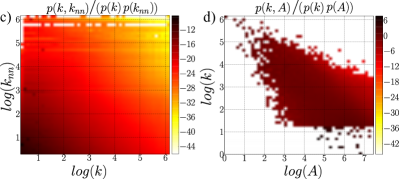
From the shape of the joint nearest-neighbor degree distribution presented in In Fig. 5, it would be tempting to think that its shape is mostly determined by the marginal distributions, i.e. that , and that therefore and would be essentially decorrelated. This is, however, not the case, as we can see in Fig. 7c. In this plot the correlations are seen more clearly in terms of the relative joint distribution We can observe that the resulting relative distribution still shows a stronger correlation when both in-degree and the in-degree of the neighbor are small.
In Fig. 7d, we present the relative density distribution of for sites having an Alexa rank and an in-degree . As for the case of the clustering coefficient , the distribution maintains the very marked upper and lower limits, being otherwise essentially only slightly more uniform than the orginal data shown in Fig. 6.
IV Links from distinct domains
The present study shows that many properties of the WWW are characterized by non-trivial correlations. We observe that the joint probability distributions, for several of the properties tested, follow power-law scaling for the respective averages. Additionally, the distributions have, in many instances, density distributions which are limited by power laws. The power law limiting functions do not share exponents neither with that of the marginal distributions, nor with the respective average value of the property studied. Interestingly one also observes power-law scaling for a seemingly unrelated quantity, the Alexa traffic rank, which decays as a function of in-degree and also the average in-degree decays moderately weakly as a function of the Alexa rank.
We found that the statistical properties of the World Wide Web differ remarkably for domains receiving more/fewer than about hyperlinks from different domains. The change in behavior is observed for the correlations between in- and out-degree, between in-degree and local clustering coefficient and between in-degree and the in-degree of neighbors. This observation points towards an underlying hierarchical structure of the WWW, with the “elite” of the Internet domains, receiving links from more than one thousand different domains, being made-up by about sites.
V Acknowledgements
We would like to acknowledge the support of the German Science Foundation (DFG).
References
- Broder et al. (2000a) A. Broder, R. Kumar, F. Maghoul, P. Raghavan, S. Rajagopalan, R. Stata, A. Tomkins, and J. Wiener, Computer Networks 33, 309 (2000a).
- Barabási and Albert (1999) A.-L. Barabási and R. Albert, Science 286, 509 (1999).
- Dogorostev and Mendes (2003) S. N. Dogorostev and J. F. F. Mendes, Evolution of Networks (Oxford University Press, 2003).
- Krapivsky et al. (2000) P. L. Krapivsky, S. Redner, and F. Leyvraz, Phys. Rev. Lett. 85, 4629 (2000).
- Dorogovtsev et al. (2000) S. N. Dorogovtsev, J. F. F. Mendes, and A. N. Samukhin, Phys. Rev. Lett. 85, 4633 (2000).
- Pastor-Satorras et al. (2001) R. Pastor-Satorras, A. Vázquez, and A. Vespignani, Phys. Rev. Lett. 87, 258701 (2001).
- Song et al. (2005) C. Song, S. Havlin, and H. A. Makse, Nature 433, 392 (2005).
- Caldarelli et al. (2002) G. Caldarelli, A. Capocci, P. De Los Rios, and M. A. Muñoz, Phys. Rev. Lett. 89, 258702 (2002).
- Takagi (2012) K. Takagi, World Journal of Mechanics 2, 171 (2012).
- Ravasz and Barabási (2003) E. Ravasz and A.-L. Barabási, Phys. Rev. E 67, 026112 (2003).
- Gros (2008) C. Gros, Complex and Adaptive Dynamical Systems, a Primer. (Springer, New York, 2008).
- Newman and Park (2003) M. Newman and J. Park, Physical Review E 68, 036122 (2003).
- Gros et al. (2012) C. Gros, G. Kaczor, and D. Marković, The European Physical Journal B-Condensed Matter and Complex Systems 85, 1 (2012).
- Albert et al. (1999) R. Albert, H. Jeong, and A.-L. Barabasi, Nature 401, 130 (1999).
- Albert and Barabási (2002) R. Albert and A.-L. Barabási, Rev. Mod. Phys. 74, 47 (2002).
- Markovic and Gros (2013) D. Markovic and C. Gros, (to be published) (2013).
- Barabási et al. (2000) A. Barabási, R. Albert, and H. Jeong, Physica A: Statistical Mechanics and its Applications 281, 69 (2000).
- Broder et al. (2000b) A. Broder, R. Kumar, F. Maghoul, P. Raghavan, S. Rajagopalan, R. Stata, A. Tomkins, and J. Wiener, Computer networks 33, 309 (2000b).
- Milo et al. (2002) R. Milo, S. Shen-Orr, S. Itzkovitz, N. Kashtan, D. Chklovskii, and U. Alon, Science Signalling 298, 824 (2002).
- Alon (2007) U. Alon, Nature Reviews Genetics 8, 450 (2007).
- ale (a) URL www.alexa.com.
- ale (b) URL http://www.alexa.com/company/technology.