]Author to whom the correspondence should be addressed
Translocation of stiff polymers through a nanopore driven by binding particles
Abstract
We investigate the translocation of stiff polymers in the presence of binding particles through a nanopore by two-dimensional Langevin dynamics simulations. We find that the mean translocation time shows a minimum as a function of the binding energy and the particle concentration , due to the interplay of the force from binding and the frictional force. Particularly, for the strong binding the translocation proceeds with a decreasing translocation velocity induced by a significant increase of the frictional force. In addition, both and have an notable impact on the distribution of the translocation time. With increasing and , it undergoes a transition from an asymmetric and broad distribution under the weak binding to a nearly Gaussian one under the strong binding, and its width becomes gradually narrower.
I Introduction
The translocation of proteins and nucleic acids through a nanopore is of essential importance to life, representative examples including the passage of messenger RNA through nuclear pores, post-translational transport of proteins across the endoplasmic reticulum membrane, and virus injection Alberts . In a seminal experiment, Kasianowicz et al. Kasianowicz have shown that single-stranded DNA and RNA can transverse the water-filled -hemolysin channel, which is signaled by a blockade in the channel ionic current. Since then, polymer translocation through nanopores has garnered high-profile attention for its far-reaching technological potential, such as rapid DNA sequencing, gene therapy and controlled drug delivery Kasianowicz ; Branton ; Turner ; Gerland .
In addition to its biological and technological relevance, polymer translocation is also an important issue purely from the view of polymer physics. Compared to an unconstrained case, the passage of a polymer through a nanopore greatly reduces its degrees of freedom and thus requires a force to overcome the energy barrier. One of the main forms of such driving forces both in vivo and in vitro is the trans-membrane force. In biological cells, it comes from the trans-membrane electrical potential, while this is achieved by an electric field mainly falling off the pore in experiments, making use of the simple fact that biopolymers, such as ssDNA, are negatively charged. This particular type of translocation has been investigated extensively through experiments Kasianowicz ; Li ; Storm ; Wanunu and theoretical works Muthukumar ; Sung ; Lubensky ; Sebastian ; Klafter ; Ambj ; Kantor ; Luo2 ; Hatlo . Another mechanism utilizes a chemical potential gradient across the membrane. Examples include translocation of chains under different solvent conditions Liao ; Weiss ; Bhattacharya , and that under the chemical potential gradient due to the binding particles (BPs) on the two sides of the membrane Sung ; Matlack ; Matlack1 ; Brunner ; Simon ; Salman ; Farkas ; Schneider ; Peskin ; Glick ; Zandi ; Paolo ; Elston ; Liebermeister ; Metzler1 ; Metzler2 ; Metzler3 ; Abdolvahab1 ; Abdolvahab2 ; Abdolvahab3 ; Orsogna ; Krapivsky ; Yu . In what follows, we concentrate on polymer translocation in the presence of BPs. Particularly, the chemical potential gradient in this work is induced by the binding particles which only exists on the side of the membrane, as shown in Fig. 1.
As to the translocation mechanism in the presence of BPs, two model have been proposed. Simon et al. Simon suggested that the translocation of chains is a simple thermal ratchet process, i.e., the role of BPs bound to the translocating chain is only to prevent it from moving backward, called the Brownian ratcheting mechanism. Later, based on the results from Brownian molecular dynamics simulations, Zandi et al. Zandi considered that the binding of BPs onto the chain can provide a mechanical force capable of pulling the chain through the pore, namely, the translocation is a force-driven process. Additionally, some important aspects associated with this problem have been investigated successively, including the “parking lot effect” due to the size difference between BPs and chain monomers Metzler1 ; Metzler2 ; Metzler3 ; Abdolvahab1 ; Abdolvahab2 ; Abdolvahab3 , the sequence dependence Abdolvahab1 ; Abdolvahab2 ; Abdolvahab3 , and the chain flexibility Yu .
Although the studies mentioned above have provided a plenty of creative insights into the translocation driven by BPs, the underlying translocation dynamics even for a stiff polymer still remains unclear. In previous simulations by Zandi et al. Zandi , the chain length used is fixed at , which is too short, and the binding energy is fixed at . Therefore, it is very necessary to understand the influence of the binding energy , the particle concentration , as well as the chain length on the translocation dynamics.
To this end, we investigate the dynamics of a stiff polymer translocation through a nanopore in the presence of BPs using Langevin dynamics simulations. In section II, We briefly elaborate our model and the simulation technique. In section III, we present our results and corresponding discussions. Finally, we give a summary in section IV.
II Model and methods
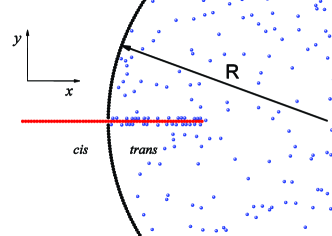
The model geometry we consider throughout this work is illustrated in Fig. 1, where a stiff polymer chain, modeled as a bead-spring chain of Lennard-Jones (LJ) particles with the Finite Extension Nonlinear Elastic (FENE) potential, is translocating through a nanopore in the presence of BPs. Covalently bonded monomers between nearest neighbor beads along the chain interact via the FENE potential:
| (1) |
where is the distance between consecutive monomers, is the spring constant and is the maximum allowed separation between connected monomers. We employ a short-range repulsive LJ potential to incorporate the excluded volume interactions between chain segments:
| (2) |
Here, is the diameter of a bead, is the depth of the potential, and is the distance between monomers.
Mobile BPs with the same size as chain segments are modeled as particles freely diffusing within a circular cell of the radius with a pore of width , and they repel each other during the simulation via the same short-range repulsive LJ potential (Eq. 2). The circular cell, consisting of one monolayer stationary LJ particles, is repulsive for BPs to prevent their overflow. The affinity between chain monomers and BPs is achieved by exerting an attractive LJ potential with a cutoff and the binding energy . The particle concentration is defined as the particle number density in the cell, . Note that, in our simulations, the chain is treated as a completely straight one so that we neglect the bending of the chain due to the binding of particles. In addition, the pore is considered to be completely inert, namely, having no impact on the chain other than to permit its one-dimensional fluctuations in and out of the cell.
In the Langevin dynamics simulations, each mobile particle is subjected to conservative, frictional and random forces, respectively:
| (3) |
Here, for chain monomers and for BPs, is the particle’s mass, which is assumed to be the same for the monomer and the binding particle, is the particle’s frictional coefficient, is the particle’s velocity, and is the random force which satisfies the fluctuation-dissipation theorem Chandler . The system energy, length and mass scales are determined by the LJ parameters , and bead mass , leading to the corresponding time scale and force scale , which are order of ps and pN, respectively. The reduced parameters for all simulations in the present work are chosen to be , , and . Those chosen parameters give rise to an effective bond length of around 0.96.
The Langevin equation is integrated in time by the method proposed by Ermak and Buckholz Ermak in one dimension for the chain, and in two dimensions for the binding particles. This integral scheme was also used by Zandi et al. Zandi . In this way, fluctuations of chain monomers along the axis are forbidden so that the polymer can only move along the axis, and such a polymer chain is considered to be a rod-like chain. This integral scheme means that we project any force on the rod along the -axis and just neglect the -component. The approximation of neglecting -components of the forces does not change the results. Moreover, if the pore is long enough, the transverse motion of the rod is not allowed.
Initially, the first monomer is placed just at the enter of the pore () and is kept fixed, and the rest of the chain and BPs are under thermal collisions described by the Langevin thermostat to reach the equilibrium state of the system. Then, the first monomer is released and both the forward and backward movements of the chain are possible. If the first monomer returns to the cis side, it would be regarded as an unsuccessful trial. A trial is considered to successful as the last monomer exits the pore ( for the first time) and such a trial is called translocation. The translocation time is defined as the time interval between the release of the first monomer and the exit of the last monomer. Typically, we perform 1000 successful runs to get an ensemble average in order to reduce statistical errors.
III Results and discussions
In our simulations, we find that the translocation probability , which is defined as the fraction of runs leading to successful translocation at given conditions, increases with increasing the binding energy and the particle concentration . For example, at a given , we observe =0.02, 0.20 and 0.44 for , 4.5 and 7.5, respectively. In addition, at a fixed , increases from 0.02 for to 0.14 for .
III.1 Mean first passage time as a function of the translocation coordinate s
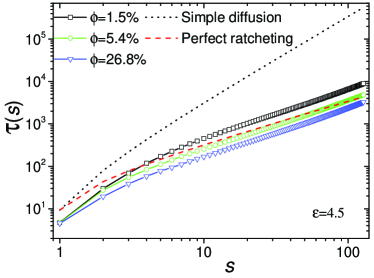
We define as the mean first passage time for s monomers exiting the pore. Fig. 2 show for chain length , binding energy and different particle concentrations . To make a comparison, we also calculate the times needed for s monomers exiting the pore by the simple diffusion and the perfect ratcheting motion, denoted as and , respectively. Note that, due to the initialization condition, is the time for the first monomer to first arrive the pore exit. Thus, (the black dotted line), and (the red dashed line), with being the diffusion coefficient of the whole chain.
As expected, is significantly longer than the mean first passage time for different particle concentrations. At a low particle concentration (), the translocation is slower than the perfect ratcheting motion. However, with increasing from to , the whole curve lies under , demonstrating that the translocation is faster than the perfect ratcheting motion. This behavior is a little different from the theoretical prediction where the perfect ratcheting result is considered as the lower limit to the translocation time Metzler2 . The reason may be from the non-equilibrium effect of the translocation process. We should point out that our results are in agreement with the numerical findings by Zandi et al. Zandi , where the translocation in the presence of BPs is further attributed to a force-driven process.
Interestingly, at a moderate , the translocation is faster than the the perfect ratcheting motion at first, but the opposite is the case after . This dynamical behavior indicates a striking chain length dependence in this issue. Zandi et al. Zandi have not observed this phenomenon possibly due to the too short chain used in their simulations ().
III.2 Influence of and on the translocation time
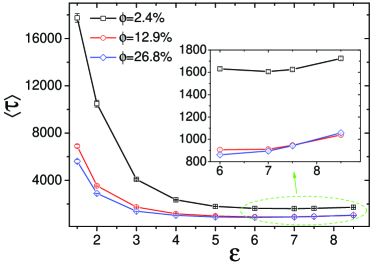
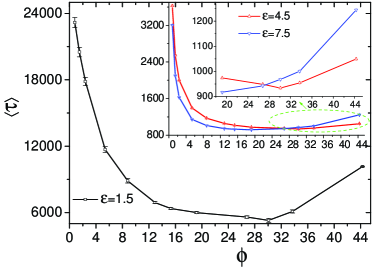
Next, we examine the influence of and on the translocation dynamics by measuring the mean translocation time . Fig. 3 shows that for low, moderate and high , decreases rapidly at first, and then slowly approaches a minimum with increasing . Afterwards, a slight but non-negligible increase is observed, see the inset of Fig. 3. Furthermore, the decay rate gradually diminishes before reaching the minimum. A similar effect of on is observed as shown in Fig. 4.
To understand these behaviors, we first consider the relevant timescales and the force from binding. There are three relevant timescales: the time for a chain to diffuse a distance of a binding site length , with being the diffusion coefficient of a monomer; the typical time that a binding site keeps vacant, and the characteristic time that a binding site stays occupied. The typical time , where is the average distance between BPs in solution in two dimensions and is the diffusion coefficient of BPs. Taking into account the same size for a binding particle and a monomer, we have . The relationship between and meets Metzler1 . Here, is a relevant measure of the effective binding strength, is the equilibrium binding constant with being the typical binding particle area. Then, three dynamical regimes were divided according to three relevant timescales Metzler1 ; Metzler2 : the diffusive regime for slow binding (), the reversible binding regime for fast binding and unbinding (), and the irreversible binding regime for fast binding but slow unbinding ().
For the reversible binding, by calculating the binding partition function, Ambjörnsson et al. Metzler1 ; Metzler2 have obtained the force (in units of ) exerted on the chain by BPs. Considering the univalent binding and the cooperativity effects between BPs bound to the chain, for large translocation coordinate , the finite size corrections become irrelevant and remains a constant value. is given as
| (4) |
Here, is a cooperativity parameter. In the present work, since BPs bound to the chain interact repulsively, if , and for all values Metzler1 . Evidently, increases with and , and thus Eq. (4) indicates that increases with the binding energy and the particle concentration . This is the reason that increases with increasing and . For irreversible binding, however, BPs do not have time to unbind during the translocation, which leads to the thermodynamic evaluation of the force inapplicable.
Our results shown in Figs. 3 and 4 can be qualitatively explained from the perspective of the forces acting on the chain during the translocation, including the force from binding and the frictional force . The initially sharp descent of with increasing and is dominated by a substantial increase in . However, the increases in and also simultaneously lead to a larger . As a result, rises because segments with bound BPs have a higher friction coefficient than free segments Simon , which partially counteracts the favorable factor for the translocation caused by the increasing . This fact is also the origin of the gradual reduction in the decay rate.
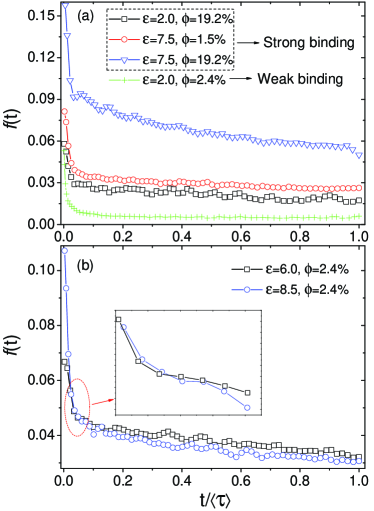
To further understand why has a minimum as a function of and , we have calculated the polymer flux through the nanopore during the translocation Here, , defined as the differentiation of the average translocation coordinate with respect to the time, characterizes the instantaneous speed of the translocation process, namely, the number of segments passing through the pore per unit time.
When the binding is weak, it is reasonable to deem that the effect of BPs’ binding on the friction coefficient of the chain is negligible because the unbinding of bound BPs is quite fast. Therefore, the translocation under this case would be in steady state. However, as the binding gets too strong, becomes the prominent factor, leading to a gradually decreasing translocation velocity, as seen in Fig. 5(a).
With the two competing effects caused by increasing and operative, we speculate that too strong binding is in favor of the translocation in its primary stage, and it then results in a more significant increase in and the ensuing more dramatic decrease in the translocation velocity. Fig. 5(b) shows that at a given , the polymer flux of the translocation under is indeed larger than that of the weaker one () at the beginning, but with a faster decay rate. Finally, about of the translocation under the stronger binding proceeds with a slower velocity, and consequently a longer translocation time is required.
Zandi et al. Zandi showed that the mean translocation time decreases monotonically with the particle concentration increasing from to . In contrast, our results indicate that the mean translocation time has a minimum as a function of which increases from to . The difference is due to the too short chain length used in their simulations. As a result, the translocation has not entered into the frictional force-dominant regime.
III.3 Distribution of the translocation time
Previous studies have shown that translocation driven by a transmembrane electric field Kantor ; Luo3 ; Luo4 or a constant pulling force exerted on the first monomer Luo5 has a qualitatively different shape of the distribution of translocation time compared to that of the unbiased translocation case Luo4 ; Chuang . Now that the polymer translocation in the presence of BPs is a force-driven process and the driving force is a function of the binding energy and the particle concentration , it is natural to wonder whether changes in and will have similar effects on the distribution of the translocation time.
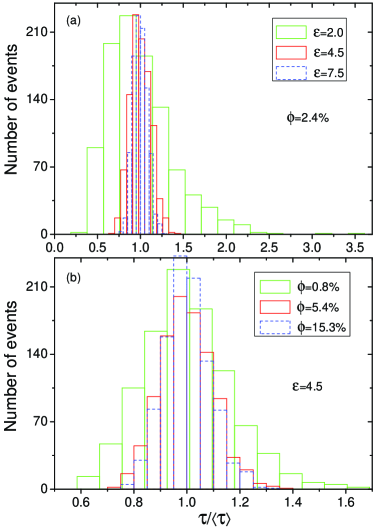
As sketched in Fig. 6(a), the distribution for is asymmetric and broader, while the histogram obeys nearly Gaussian distribution as increases. Fig. 6(b) shows that at a relatively large binding energy , almost all of the histograms approach nearly Gaussian distributions, even under a fairly low . And the width of the distribution becomes narrower as the binding gets stronger. These results can be ascribed to the simple fact that increases with increasing and , and are qualitatively similar to the observations reported by previous studies Luo4 ; Kantor ; Luo5 . What’s more, the distribution of the translocation time is more sensitive to than in that has a more significant effect on the effective binding strength . At a smaller , we could still observe the transition from an asymmetric distribution to a nearly Gaussian one as increases.
Most recently, it has been demonstrated that the probability density function (PDF) of the translocation time is solely determined by the dimensionless Péclet number, denoted as , Abdolvahab3 . It is a dimensionless parameter comparing drift strength and diffusivity. The PDF changes from a broad distribution in the diffusion dominated regime at small to a significantly narrower distribution in the regime of drift domination at large . We calculate the effective Péclet number, as follows, , , , , , and . Obviously, for the broader distribution is smaller than these for significantly narrower distributions. Therefore, our results about the distribution of the translocation time are qualitatively in agreement with the findings in Ref. Abdolvahab3, .
IV Conclusions
In this work, we have investigated the translocation of stiff polymers through a nanopore in the presence of BPs by performing 2D Langevin dynamics simulations. We show that under a certain and , the translocation is faster than the perfect ratcheting motion at first, but the opposite is the case for the late stage of the translocation process. This indicates the striking chain length dependence of the translocation dynamics. By scanning a large range of the parameter spaces, we find that there exist an optimal and an optimal for the translocation. Then, a qualitative explanation is given from the perspective of the forces acting on the chain. Finally, both and have an notable impact on the distribution of the translocation time. Specifically, with increasing and , it undergoes a transition from an asymmetric and broad distribution under the weak binding to a nearly Gaussian one under the strong binding, and its width becomes gradually narrower.
Acknowledgements.
This work is supported by the National Natural Science Foundation of China (Grant Nos. 21225421, 21074126, 21174140, J1030412) and the “ Hundred Talents Program ” of CAS.References
- (1) B. Alberts et al., Molecular Biology of the Cell (Garland, New York, 1994).
- (2) J. J. Kasianowicz, E. Brandin, D. Branton, and D. W. Deamer, Proc. Natl. Acad. Sci. U.S.A. 93, 13770 (1996).
- (3) A. Meller, L. Nivon, and D. Branton, Phys. Rev. Lett. 86, 3435 (2001); A. Meller, J. Phys.: Condens. Matter 15, R581 (2003); M. Wanunu, J. Suntin, B. McNally, A. Chow, and A. Meller Biophys. J. 95, 1193 (2008)
- (4) S. W. Turner, M. Cabodi, and H. G. Craighead, Phys. Rev. Lett. 88, 128103 (2002).
- (5) U. Gerland, R. Bundschuch, and T. Hwa, Phys. Biol. 1, 19 (2004).
- (6) J. L. Li, D. Stein, C. McMullan, D. Branton, M. J. Aziz, and J. A. Golovchenko, Nature 412, 166 (2001).
- (7) A. J. Storm, C. Storm, J. Chen, H. Zandbergen, J.-F. Joanny, and C. Dekker, Nano Lett. 5, 1193 (2005).
- (8) M. Wanunu, W. Morrison, Y. Rabin, A. Y. Grosberg, and A. Meller, Nat. Nanotechnol. 5, 160 (2010).
- (9) W. Sung, and P. J. Park, Phys. Rev. Lett. 77, 783 (1996).
- (10) D. K. Lubensky, and D. R. Nelson, Biophys. J. 77, 1824 (1999).
- (11) M. Muthukumar, J. Chem. Phys. 111, 10371 (1999); Phys. Rev. Lett. 86, 3188 (2001); J. Chem. Phys. 118, 5174 (2003).
- (12) K. L. Sebastian, Phys. Rev. E 61, 3245, (2000); K. L. Sebastian, and A. K. R. Paul, Phys. Rev. E 62, 927, (2000); K. L. Sebastian, J. Am. Chem. Soc. 122, 2972, (2000).
- (13) O. Flomenborn, and J. Klafter, Phys. Rev. E 68, 41910 (2003).
- (14) T. Ambjörnsson, S. P. Apell, Z. Konkoli, E. A. Di Marzio, and J. J. Kasianowicz, J. Chem. Phys. 117, 4063 (2002).
- (15) K. Luo, T. Ala-Nissila, S. C. Ying, and A. Bhattacharya, Phys. Rev. Lett. 99, 148102 (2007); ibid 100, 058101 (2008); K. Luo, T. Ala-Nissila, S. C. Ying, and R. Metzler, Europhys. Lett. 88, 68006(2009).
- (16) M. M. Hatlo, D. Panja, and R. van Roij, Phys. Rev. Lett. 107, 068101 (2011).
- (17) Y. Kantor and M. Kardar, Phys. Rev. E 69, 021806 (2004).
- (18) D. Wei, W. Yang, X. Jin, and Q. Liao, J. Chem. Phys. 126, 204901 (2007).
- (19) F. Kapahnke, U. Schmidt, D. W. Heermann, and M. Weiss J. Chem. Phys. 132, 164904 (2010).
- (20) C. Lörscher, T. Ala-Nissila, and A. Bhattacharya, Phys. Rev. E 83, 011914 (2011).
- (21) K. E. S. Matlack, W. Mothes, and T. A. Rapoport, Cell 92, 381 (1998).
- (22) K. E. S. Matlack, B. Misselwitz, K. Plath, and T. A. Rapoport, Cell 97, 553 (1999).
- (23) W. Neupert, and M. Brunner, Nat. Rev. Mol. Cell. Biol. 3, 555 (2002).
- (24) H. Salman, D. Zbaida, Y. Rabin, D. Chatenay, and M. Elbaum, Proc. Natl. Acad. Sci. U.S.A. 98, 7247 (2001).
- (25) K. Farkas, I. Derényi, and T. Vicsek J. Phys.: Condens. Matter 15, S1767 (2003).
- (26) S. M. Simon, C. S. Peskin, and G. F. Oster, Proc. Natl. Acad. Sci. U.S.A. 89, 3770 (1992).
- (27) H. J. Schneider, J. Berthold, M. Bauer, K. Dietmeier, B. Guiard, M. Brunner, and W. Neupert, Nature 371, 768 (1994).
- (28) C. S. Peskin, S. M. Simon, and G. F. Oster, Biophys. J. 65, 316 (1993).
- (29) B. Glick, Cell 80, 11 (1995).
- (30) T. C. Elston, Biophys. J. 79, 2235 (2000); ibid 82, 1239 (2002).
- (31) R. Zandi, D. Reguera, J. Rudnick, and W. M. Gelbart, Proc. Natl. Acad. Sci. U.S.A. 100, 8649 (2003).
- (32) P. de los Rios, A. Ben-Zvi, O. Slutsky, A. Azem and P. Goloubinoff, Proc. Natl. Acad. Sci. U.S.A. 103, 6166 (2006).
- (33) W. Liebermeister, T. A. Rapoport, and R. Heinrich, J. Mol. Biol. 305, 643 (2001).
- (34) T. Ambjörnsson, and R. Metzler, Phys. Biol. 1, 77 (2004).
- (35) T. Ambjörnsson, M. A. Lomholt, and R. Metzler, J. Phys.: Condens. Matter 17, S3945 (2005).
- (36) R. Metzler and K. Luo, Eur. Phys. J. Special Topics 29, 423 (2010).
- (37) R. H. Abdolvahab, F. Roshani, A. Nourmohammad, M. Sahimi, and M. R. R. Tabar, J. Chem. Phys. 129, 235102 (2008).
- (38) R. H. Abdolvahab, M. R. Ejtedadi, and R. Metzler, Phys. Rev. E 83, 011902 (2011).
- (39) R. H. Abdolvahab, R. Metzler, and M. R. Ejtedadi, J. Chem. Phys. 135, 245102 (2011).
- (40) M. R. D’Orsogna, T. Chou, and T. Antal, J. Phys. A: Math. Theor. 40, 5575 (2007).
- (41) P. L. Krapivsky and K. Mallick, J. Stat. Mech. (2010) P07007.
- (42) W. Yu and K. Luo, J. Am. Chem. Soc. 133, 13565 (2011).
- (43) D. Chandler, Introduction to Modern Statistical Mechanics; Oxford University Press, New York, 1987; M. P. Allen, and D. J. Tildesley, Computer Simulation of Liquids; Oxford University Press: Oxford, U.K., 1987.
- (44) D. L. Ermak and H. Buckholz, J. Comput. Phys. 35, 169 (1980).
- (45) K. Luo, T. Ala-Nissila, and S. C. Ying, J. Chem. Phys. 124, 114704 (2006).
- (46) I. Huopaniemi, K. Luo, T. Ala-Nissila, and S. C. Ying, J. Chem. Phys. 125, 124901 (2006).
- (47) I. Huopaniemi, K. Luo, T. Ala-Nissila, and S. C. Ying, Phys. Rev. E 75, 016912 (2007).
- (48) J. Chuang, Y. Kantor, and M. Kardar, Phys. Rev. E 65, 011802 (2002).