11email: mblanco@iaa.es, mar@iaa.es, jfg@iaa.es 22institutetext: Instituto de Astronomía y Meteorología, Av. Vallarta No. 2602, Col. Arcos Vallarta, 44130 Guadalajara, Jalisco, Mexico
22email: gerardo@astro.iam.udg.mx 33institutetext: Universidad de Vigo, Departamento de Física aplicada, Facultad de Ciencias, Campus Lagoas-Marcosende s/n, 36310 Vigo, Spain
33email: lfm@iaa.es 44institutetext: Consejo Superior de Investigaciones Científicas (CSIC), Madrid, Spain 55institutetext: European Southern Observatory (ESO), Karl Schwarschild Str. 2, Garching bei München, Germany
55email: elagadec@iaa.es 66institutetext: Laboratoire Lagrange, UMR7293, Université de Nice Sophia-Antipolis, CNRS, Observatoire de la Côte d’Azur, 06300 Nice, France
66email: olga.suarez@unice.fr
VISIR-VLT high resolution study of the extended emission of four obscured post-AGB candidates††thanks: Based on observations collected at the European Organisation for Astronomical Research in the Southern Hemisphere, Chile. Program: 087.D-0367(A).
Abstract
Context. The onset of the asymmetry of planetary nebulae (PNe) is expected to occur during the late Asymptotic Giant Branch (AGB) and early post-AGB phases of low- and intermediate-mass stars. Among all post-AGB objects, the most heavily obscured ones might have escaped the selection criteria of previous studies detecting extreme axysimmetric structures in young PNe.
Aims. Since the most heavily obscured post-AGB sources can be expected to descend from the most massive PN progenitors, these should exhibit clear asymmetric morphologies. High-resolution observations of these sources should reveal marked bipolar morphologies, confirming the link between progenitor mass and nebular morphology.
Methods. We have obtained VISIR-VLT mid-IR images of a sample of four heavily obscured post-AGB objects barely resolved in previous Spitzer IRAC observations in order to analyze their morphology and physical conditions across the mid-IR. The images obtained in four different mid-IR filters have been deconvolved, flux calibrated, and used to construct RGB composite pictures as well as color (temperature) and optical depth maps that allow us to study the morphology and physical properties of the extended emission of the sources in our sample.
Results. We have detected extended emission from the four objects in our sample and resolved it into several structural components that are greatly enhanced in the temperature and optical depth maps. The morphologies of the sample, as well as their physical conditions, reveal the presence of asymmetry in three young PNe (IRAS 155345422, IRAS 170094154, and IRAS 184540001), where the asymmetries can be associated with dusty torii and slightly bipolar outflows. The fourth source (IRAS 182291127), a possible post-AGB star, is better described as a rhomboidal detached shell.
Conclusions. The heavily obscured sources in our sample do not show extreme axisymmetric morphologies. This is at odds with the expectation of highly asymmetrical morphologies in post-AGB sources descending from massive PN progenitors, which is otherwise supported by observations of bright mid-IR unobscured sources. The sources presented in this paper may be sampling critical early phases in the evolution of massive PN progenitors, before extreme asymmetries develop.
Key Words.:
techniques: high angular resolution – Stars: post AGB –circumstellar matter – planetary nebulae: general1 Introduction
Evolved low- and intermediate-mass stars () undergo heavy mass-loss episodes during the red giant and Asymptotic Giant Branch (AGB) phases. At the tip of the AGB, these stars will eject most of their stellar envelopes in a short time until they evolve into post-AGB stars, the immediate precursors of planetary nebulae (PNe). PNe display an impressive variety of morphologies, from spherical to the most complex shapes: bipolars and multipolars with point-symmetric structures and collimated jets moving at high velocities. It has been suggested that asymmetric PNe are the rule, rather than the exception (Manchado et al. 2000; Schwarz et al. 1993). The shaping mechanism of complex PNe is a matter of intense debate and is not yet completely understood (Balick & Frank 2002)

It has been claimed that the short transition between the AGB and post-AGB phase contains the clues to understand the transformation of the spherical stellar envelope into an asymmetric PN (Sahai & Trauger 1998). AGB stars are surrounded by thick and compact circumstellar envelopes rich in dust; this makes their detection almost impossible at optical wavelengths, whereas their infrared emission is strong. As they evolve into the post-AGB phase, the temperature of the stellar cores increases and the envelopes become optically thin, although it must be noted that there are sources at this stage and even young PNe that are significantly obscured because they preserve optically thick envelopes (e.g., IRAS 173473139, de Gregorio-Monsalvo et al. 2004). Observational studies of the reflection, thermal dust and ionized emission around proto-PNe and young PNe (Sahai & Trauger 1998; Sahai et al. 2007; Ueta et al. 2000; Lagadec et al. 2011; Sahai et al. 2011) typically detect the existence of extreme axisymmetric morphologies, with highly collimated bipolar lobes and equatorial rings or torii. On the other hand, spherical and elliptical morphologies seem to be rare among the objects in this transition phase.
Infrared surveys (e.g., 2MASS, IRAS, and AKARI) have contributed to the study of objects in the late AGB and early post-AGB stages, providing the first insights on this short transition phase (e.g., García-Lario et al. 1997; Jiménez-Esteban et al. 2006; Cox et al. 2011). Recently, Ramos-Larios et al. (2009, hereafter RL09 and RL12, respectively); Ramos-Larios et al. (2012, hereafter RL09 and RL12, respectively) have investigated a sample of heavily obscured post-AGB and PNe candidates selected according to their IRAS colors and the lack of an optical counterpart (Suárez et al. 2006) using near-IR and Spitzer IRAC GLIMPSE images, and MSX, AKARI, and IRAS photometric data. RL09 and RL12 have gathered a small sample of four objects that are resolved in Spitzer IRAC GLIMPSE images, namely IRAS 155345422, IRAS 170094154, IRAS 182291127, and IRAS 184540001. The spatial resolution of these images (2″), however, is not adequate to investigate the angularly small structures typical of sources in these evolutionary phases (Suárez et al. 2011; Lagadec et al. 2011). Mid-IR observations using the new generation of ground-based telescopes provide a unique opportunity to resolve the extended emission detected in these four highly obscured post-AGB objects in their transition to the PN phase.
In this paper we present mid-IR VISIR-VLT high angular resolution observations of these four sources. The images have been used to describe their morphologies, to analyze their innermost structures, and to derive color (temperature) and optical depth maps. We next describe the sample in Sect. 2, the observations and data reduction in Sect. 3, and present the results in Sect. 4. The results are discussed in Sect. 5 and a short conclusion is provided in Sect. 6.
2 The sample
RL09 and RL12 reported the detection of extended emission in Spitzer IRAC images of four post-AGB source candidates, namely IRAS 155345422, IRAS 170094154, IRAS 182291127, and IRAS 184540001. According to the spectral energy distribution (SED) classification scheme of post-AGB sources introduced by van der Veen et al. (1989), the SEDs of these four sources shown in Figure 1 can be assigned to Type II for IRAS 155345422 (peak at 25 m and gradual fall-off to shorter wavelengths, although we note that its SED also suggests a near-IR excess at 2–5 m), to Type III for IRAS 182291127 and IRAS 184540001 (peak at 25 m and steep fall-off to shorter wavelengths with a plateau between 1 and 4 m), and to Type IV for IRAS 170094154 (with a main peak at 25 m and a secondary peak blue-wards). These SEDs are suggestive of two dust components, cold dust in the thermal IR and hot dust obscuring the central star in the near-IR.
Besides the information provided by RL09 and RL12, there is no detailed study available in the literature for these sources. Based on their IRAS colors, IRAS 155345422 is classified as a PN candidate (Preite-Martinez 1988), as recently confirmed by Parker et al. (2012) by means of spectroscopy, whereas IRAS 184540001 is classified as a post-AGB star (García-Lario et al. 1997). We note that the IRAS selection criteria for these sources (Suárez et al. 2006) may overlap with those of Young Stellar Objects (YSOs), although RL09 noted that these four objects are not located near star forming regions, neither they have been classified as YSOs in the literature. The lack of CO line emission in IRAS 155345422 and IRAS 170094154, and the detection of narrow (0.8 km s-1) CO line emission toward IRAS 184540001 (Urquhart et al. 2008, RMS Survey) are inconsistent with a YSO nature. Based on the IRAS colors of the sample, we can also discard a possible symbiotic star nature, as these have typically values of the IRAS [12][15] color 0.8 (Kenyon et al. 1988), whereas the sources in our sample present values 2. Moreover, our sources do not present variability in near-IR observations (RL09 and RL12), thus we can disregard an eruptive nature, as for instance in circumstellar shells around luminous blue variable sources (e.g., IRAS 185760341, Buemi et al. 2010).
The detection of radio continuum emission in IRAS 155345422, IRAS 170094154, and IRAS 184540001 (Urquhart et al. 2008) confirms that ionization is already present, implying that these three sources may have already entered the PN phase. Indeed, Br emission from ionized material has been detected in IRAS 155345422 (RL12) and in IRAS 170094154 (Van de Steene et al. 2000). For IRAS 155345422, this emission is found to be extended and to display a bipolar morphology (RL12). We are thus confident on the PN nature of IRAS 155345422, IRAS 170094154, and IRAS 184540001.
As for IRAS 182291127, the absence of filamentary diffuse emission in the mid-IR, which is characteristic of YSOs, and the similarities between its SED and that of IRAS 184540001 can be used as additional arguments for a post-AGB classification.
3 Observations and data reduction
| Object | Date of | Integration time | Standard star | FWHM | ||||||
|---|---|---|---|---|---|---|---|---|---|---|
| (J2000.0) | observation | N band | Q band | PAH1 | SiC | [Ne ii] | Q1 | |||
| (s) | (s) | (″) | (″) | (″) | (″) | |||||
| IRAS 155345422 | 15h57m2111 | –54∘30′464 | 2011-05-25 | 600 | 900 | HD 133550 | 0.28 | 0.37 | 0.35 | 0.46 |
| IRAS 170094154 | 17h04m296 | –41∘58′389 | 2010-05-24 | 300 | 450 | HD 163376 | 0.31 | 0.36 | 0.38 | 0.48 |
| IRAS 182291127 | 18h25m450 | –11∘25′56 | 2010-06-14 | 600 | 600 | HD 169916 | 0.34 | 0.51 | 0.42 | 0.49 |
| IRAS 184540001 | 18h48m015 | +00∘04′47 | 2010-06-22 | 840 | 1320 | HD 168723 | 0.28 | 0.35 | 0.35 | 0.49 |
High angular resolution observations (Program ID: 087.D-0367(A), PI: M.A. Guerrero) were obtained with the mid-IR imager VISIR (Lagage et al. 2004) attached to the Cassegrain focus of Melipal (UT3) at the VLT. The sources have been observed through four different filters, PAH1 (=8.54 m, =0.42 m), SiC (=11.85 m, =2.34 m) and [Ne ii] (=12.82 m, =0.21 m) in the N band, and the Q1 filter (=17.65 m, =0.83 m) in the Q band. The observations of standard stars were performed after every science ObsBlock to correct for PSF artifacts and flux calibration purposes. The date of observation, the integration time, and the FWHM of the standard star observed subsequently are summarised in Table 1. The pixel scale is 0075 and the field of view (FoV) is 192192.
The data were taken using several exposures with short DIT (Detector Integration Time) depending on the flux of the source and the required S/N. The observation mode used was the so-called NORMAL with a perpendicular chop-throw of 8″. The chopping and nodding standard technique was used to help in the removal of the background signal. In the NORMAL mode used for these observations, all frames taken at a chopping position are added immediately at the end of the exposure, resulting in a data cube of reduced size. The data reduction was carried out following standard procedures of Gasgano-VISIR pipeline (version 3.4.4), in which flat fielding correction, bad pixel removal, source alignment, and co-addition of frames are executed to produce a combined image for each filter. The resulting FoV is 8″.
In order to improve the spatial resolution of the raw images, we deconvolved each of them using its PSF observation according to two different deconvolution algorithms: Maximum likelihood (number of iterations 5) and Richardson-Lucy (number of iterations 10). The precise algorithm and number of iterations was determined by the quality of the raw image, so that the spatial resolution of the deconvolved image was improved but no artifacts were introduced. The maximum likelihood algorithm was used to deconvolve the images of IRAS 170094154, IRAS 182291127 and IRAS 184540001, whereas the Richardson-Lucy algorithm was used for IRAS 155345422. The final images are presented in Figure 2.
| Object | PAH1 (8.54 m) | SiC (11.9 m) | [Ne ii] (12.8 m) | Q1 (17.7 m) |
|---|---|---|---|---|
| (mJy) | (mJy) | (mJy) | (mJy) | |
| IRAS 155345422 | 181.60.1 | 768.50.1 | 1461.90.1 | 1891.90.2 |
| IRAS 170094154 | 9054.50.5 | 4212.20.1 | 3280.20.2 | 506745 |
| IRAS 182291127 | 659.780.02 | 270.250.04 | 270.790.03 | 4101.80.1 |
| IRAS 184540001 | 184.340.03 | 167.610.02 | 225.170.03 | 30961 |
The final images have been flux calibrated using fluxes of the PSF stars (Cohen et al. 1999). For the flux calibration we have performed aperture photometry (Table 2). We note that the angular extent of IRAS 155345422 and IRAS 170094154 is similar to the final FoV of 8″. As the background aperture may include emission from these objects, their fluxes listed in Table 2 should be regarded as lower limits of the real fluxes.
4 Results
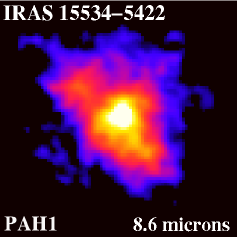
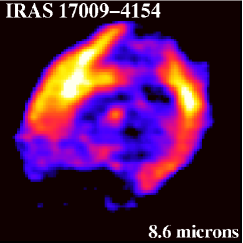
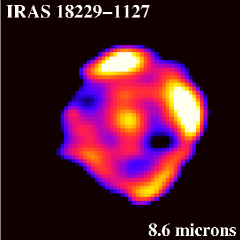
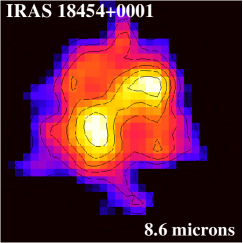
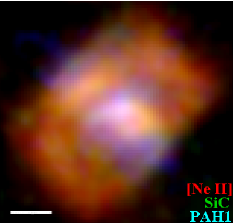
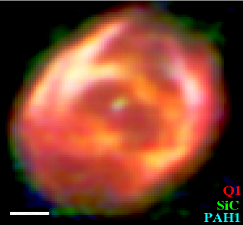

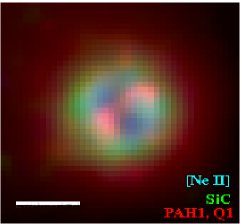
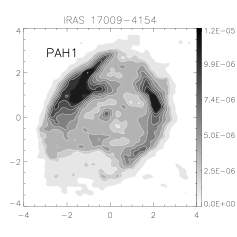
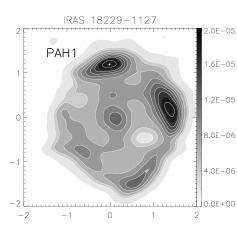
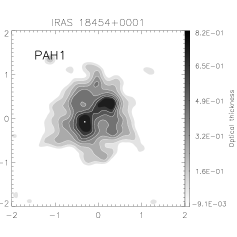
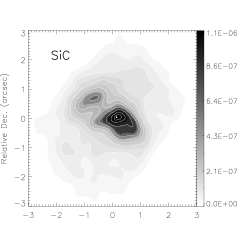
The VISIR-VLT images presented in Figure 2 reveal with unprecedented detail the extended emission from these four sources. These images also disclose notable variations among the morphological features shown in images obtained through different filters which we interpret to be related to the spectral features registered by these filters. The emission in the PAH1 filter may include the PAH1 feature at 8.6 m associated with C-rich dust, as well as thermal continuum emission. The broad SiC filter includes thermal dust emission, silicate features, the PAH2 feature at 11.3 m, and emission lines such as [Ne ii] and [S iv]. The [Ne ii] filter is fine tuned to the [Ne ii] emission from ionized gas, but it may also include the contribution from dust emission. Finally, the Q1 filter maps the continuum emission of the thermal dust at 17.7 m.
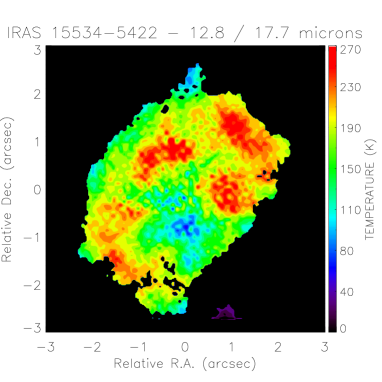
Considering that the thermal emission of the dust represents the major contribution to the emission in the mid-IR we have applied the procedure described by Dayal et al. (1998), we have generated color maps (also known as temperature maps) using pairs of flux calibrated images in different wavelengths for the four objects in our sample (Figure 3). This procedure relies on the relation between the intensity of the thermal dust continuum at a given wavelength () with the temperature and optical depth under the assumption of the optically thin emission of the warm dust component. As the extinction produced by cool dust component along the line of sight can be considered to be similar at the mid-IR wavelengths of the different filters used in this work, we can further assume that its effects on the ratio maps are negligible. Since variations in the temperature produced by the emission properties of the dust appear as color variations in the maps, the temperature of the dust can be approximated by the following expression:
| (1) |
where and are the two wavelengths used for the estimation of the temperature, and and are the measured intensities at these two wavelengths. This method assumes that the variation of the emissivity () can be represented by a power law () and it has been proven to provide a good estimate of the spatial distribution of the cold and warm dust across the source studied (Dayal et al. 1998; Meixner et al. 1999; Ueta et al. 2001; Lagadec et al. 2005), being helpful to reveal or enhance morphological features.
In order to derive the color maps shown in Figure 3, we have used the Q1 image in conjunction with one N-band image, as the longer wavelength range provides a better leverage of the continuum slope which is determined by the thermal dust temperature. We have also avoided images in those filters that may present important contributions of spectral features others than the continuum. Therefore, the SiC images have not been used, as they may include multiple contributions from emission lines and dust features.
Once the value of the temperature is estimated, we can construct optical depth maps using the Planck function under the same assumption. Therefore, the optical depth at a certain wavelength can be derived using the following expression:
| (2) |
where is the intensity at the wavelength analyzed. Using these maps, we are able to estimate the column density variations across the nebula to assess whether the emission is optically thin at the observed wavelength range.
We next describe in detail the morphology, temperature and optical depth properties of the individual sources.
4.1 IRAS 155345422
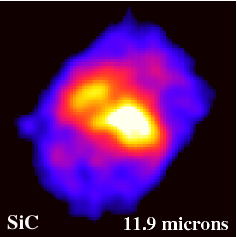
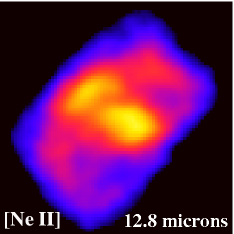
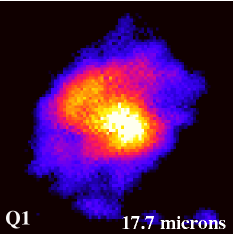
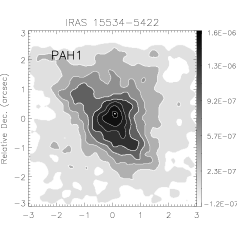
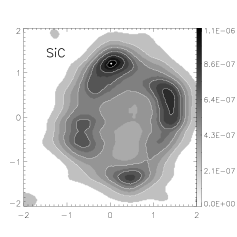
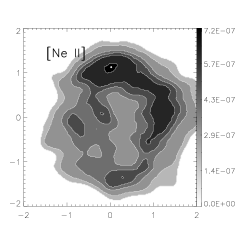
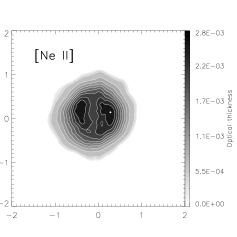
IRAS 155345422 is resolved in at least two structures that are distinguished by their morphology and emission properties (Figure 2). A first structure is an elongated, bar-like feature with a size of 3″ oriented at PA 55°. The emission of this bar is detected in PAH, SiC, and Q1, and is much weaker in [Ne ii]. A second structure is an arc-like feature, 5″ 3″ in size, which is oriented perpendicular to the bar and is particularly prominent in [Ne ii], but weak in SiC and Q1 and absent in PAH1. This arc-like extended structure is not closed and presents a rectangular shape at low intensity levels. The color composite picture of IRAS 155345422 (Figure 2) suggests that the arc-like feature traces ionized material, while the bar is mostly dominated by thermal dust emission.
The color map of this source (Figure 3), obtained using the [Ne ii] and the Q1 images, reveals a range of temperatures across the nebula from 801 K to 2701 K, with a mean value of 190 K. The color map greatly enhances the arc-like feature, which is the hottest component, whereas the bar, with lower temperatures, almost disappears in this map. The optical depth maps at different wavelengths (Figure 4), computed for a mean temperature value of 190 K, imply that the south-west tip of the bar represents the highest density zone in this object. The [Ne ii] optical depth map reveals a noticeable enhancement of the column density at the north-east tip of the bar, where it goes across the arc-like feature.
4.2 IRAS 170094154
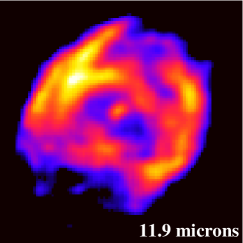
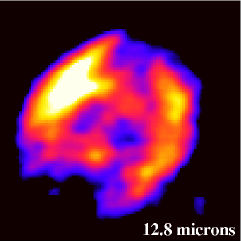
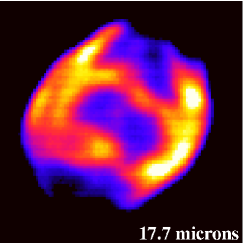
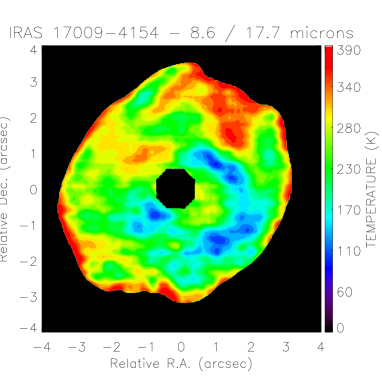
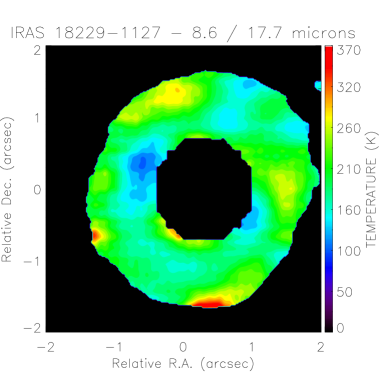
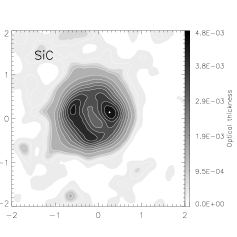
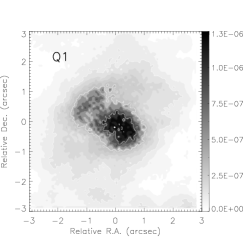
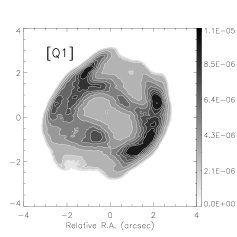
IRAS 170094154 has an elongated morphology toward the north-west with a size of 6355 in size. There is an innermost equatorial enhancement that can be appreciated as an elongated ring-like structure (3″2″) at PA64° surrounding a central star which is detected in all VISIR bands (Figure 2). Two prominent arc-like features trace the edge of the outermost regions and are located at PAs 64°–244° with brightness increasing with wavelength.
The color map of this source (Figure 3) shows values of temperature in the range from 1505 K up to 3905 K with a mean value of 210 K. The maxima in temperature are related with regions at the tips of the major axis of symmetry. The innermost ring-like structure surrounding the central star seems to have two different temperature components: the south-west is the coolest region (150 K), whereas there is a hot component located toward north-east with a temperature of 350 K. The arcs are warmer (250 K). The mean value of the temperature (=210 K) has been used to derive the optical depth maps of IRAS 170094154 (Figure 4). The regions with the highest column densities are the arcs, followed by the ring-like structure, as shown in all optical depth maps.
4.3 IRAS 182291127
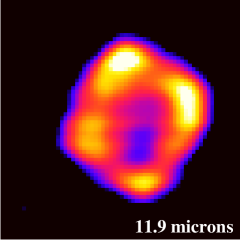
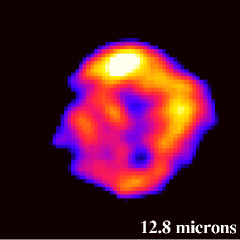
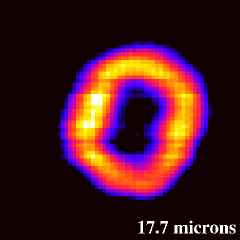
IRAS 182291127 has a rhomboidal clumpy envelope with an angular size of 25. In the PAH1, SiC, and [Ne ii] N-band images (Figure 2), this envelope is dominated by two bright knots toward the north and north-west, and two weaker knots are noticeable toward the south and south-east. The south-east knot is not detected in [Ne ii]. Interestingly, these knots are singularly not apparent in the Q1 image that shows a clearly hollow envelope, with a elongated cavity oriented along the north-south direction. The central star is detected, but only in the bluest PAH1 image at 8.6 m. The color-composite RGB picture of this object at the bottom of Figure 2 shows a reddened, hollow rhomboidal envelope with a spot brighter at shorter wavelengths at each corner.
We have derived the color map of this source using its PAH1 and Q1 images and we estimate a mean temperature of 170 K (Figure 3), with a range of 100 K 3701 K.
The bright knots in the N-band filters are the warmest regions of this source, with 280 K, whereas the rest of the rhomboidal envelope has the lowest temperatures (200 K). The mean value of 170 K has been used to derive the optical depth maps of IRAS 182291127 (Figure 4). The knots represent the regions with the highest densities in the N-band, with the north one being the most dense. These density variations are diminished in the Q1 optical depth map, where the rhomboidal envelope has a more homogeneous density distribution. It is remarkable the difference between the optical depth maps of the N-band and the one of Q1: while the knots are the densest zones from 8.6 to 12.8 m, the peak of the density at 17.7 m is toward east, where not a single knot is present.
4.4 IRAS 184540001
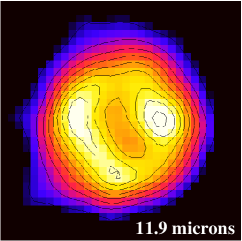
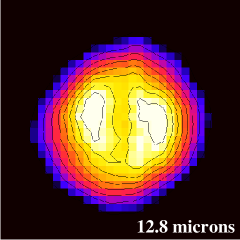
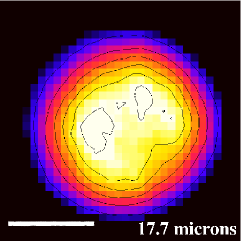
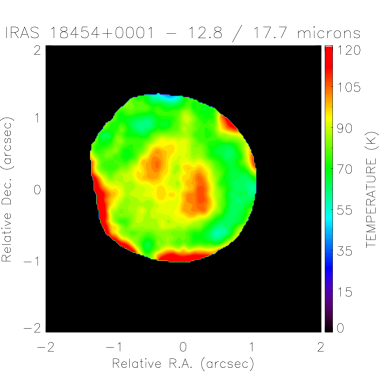
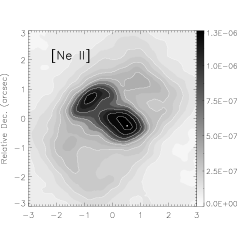
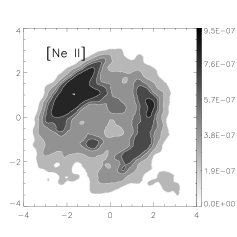
This source has the smallest angular size among the objects in our sample. The source can be described as a round, 15 in size, clumpy envelope in the SiC, [Ne ii], and Q1 images, but its morphology in the PAH1 image is singularly different (Figure 2). In this band, the image is dominated by a pair of bright knots along PA 121° that seem spatially coincident with brightness peaks in the Q1 image, whereas the peaks detected in the SiC and [Ne ii] images are located at different positions. All images hint at the presence of a central cavity, but its orientation and extent varies with wavelength. At large spatial scale, the Q1 image reveals an extended halo around the main nebula. The halo with a size of 5″4″ extends toward the north-east, as shown in red in the color-composite RGB picture at the bottom Figure 2.
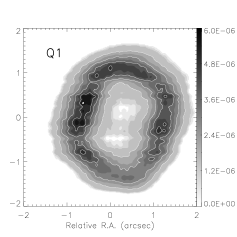
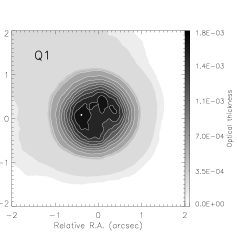
The [Ne ii] and Q1 images of IRAS 184540001 have been used to estimate the mean value of temperature of 80 K in a range from 501 K to 1201 K (Figure 3). The temperature variations are notably flat over the nebula, with the hottest temperature (100 K) at the pair of bright spots seen in [Ne ii] and regions of high temperature (90 K) at the bright PAH1 and Q1 knots. The emission of the envelope seems to be traced by a cooler dust component. Interestingly, the optical depth maps (Figure 4) show that the highest density regions are associated with the knots seen in PAH1 and in Q1, while the knots associated with the [Ne ii] emission peaks represent zones of lower column density. There is a remarkable difference in the value and location of the peaks in the the optical depth maps of IRAS 184540001 in PAH1 and Q1 with respect to those in SiC and [Ne ii], but we note this may be an artifact produced by the low value of the temperature estimated for this source (=80 K) that has been used to built its optical depth maps.

5 Discussion
5.1 Physical structure of the sources
We have obtained mid-IR high spatial resolution images of three PNe and one post-AGB source candidate using VISIR at the VLT. These images reveal notable morphological differences among the sources in our sample. The shell-like morphology and detection of a central star in three of these sources are not expected for the diffuse mid-IR emission from compact H ii regions (Takahashi et al. 2000). Only IRAS 155345422 may look like a compact H ii region, but its PN nature is well established by optical spectroscopy (Parker et al. 2012).
Temperature and optical depth maps built from these images are proven to be powerful tools to enhance morphological structures and to reveal new ones in these objects. In the following we will discuss the main characteristics of the individual sources as well as the characteristics that are shared by them all.
IRAS 155345422 is a young PN with two distinct structural components. The elongated innermost structure is dominated by thermal dust continuum and it represents the coldest and densest regions in this PN. This structure is surrounded by a warmer, ionized extended envelope of lower density. Whereas the color-composite picture of IRAS 155345422 in Figure 2 seems to imply that the elongated inner structure is a bipolar nebula surrounded by the ring-like envelope, the physical properties of the different components favor an alternative, more solid interpretation. The innermost structure is rather a high-density, dusty “torus”, whereas the apparent envelope can be associated to a pair of ionized bipolar lobes perpendicular to that “torus”. This interpretation is consistent with the narrow-band near-IR images presented by Ramos-Larios et al. (2012) and with the near-IR excess noticeable in its SED (Fig. 1).
IRAS 170094154 seems to have an slightly bipolar or elliptical morphology. The bright arcs can be interpreted as ionized bipolar extensions of an elliptical shell sculpted by a SiC and Q1 bright, dusty equatorial ring. The dust ring is the coldest structure in this source, whereas the bright arcs are warmer. The temperature is the highest at the northwest and southeast tips of the lobes.
Based on the properties of the SED of IRAS 182291127 and on its similarity with that of the PN IRAS 184540001 (Fig. 1), we favor its classification as a post-AGB source and discard a YSO nature. This source shows a peculiar clumpy and dusty rhomboidal envelope. This rhomboidal appearance is enhanced by the knots located toward the northwest, the densest region of this source, and southeast knots. The rhomboidal morphology of IRAS 182291127 resembles the shape of the PN BD303639 (Lagadec et al. 2011; Akras & Steffen 2012).
IRAS 184540001 is a compact PN displaying both a spherical AGB shell and a dusty torus, most noticeable in the PAH1 (8.6 m) and Q1 (17.7 m) images. The temperature map suggests the presence of relatively hot regions along the direction perpendicular to this torus. Alternatively, these regions may be dominated by ionized gas unveiled by its [Ne ii] emission. The torus shows density enhancements in the dust-dominated PAH1 and Q1 filters corresponding with the high density knots along the south-east and north-west direction. The presence of a high density torus, but a spherical AGB envelope, is intriguing. We might witness in this source the early phase on the shaping of a bipolar PN, before the spherical geometry of the AGB wind is disrupted by a fast stellar wind collimated by a toroidal density enhancement as proposed by the Generalized Interacting Stellar Wind model of PN shaping (GISW, Balick et al. 1987).
The morphological features detected in direct images are notably enhanced in the temperature and optical depth maps, as these distinguish between structures of same brightness, but different physical conditions. Furthermore, the physical characteristics of the structures detected for each source are generally consistent. The innermost dusty rings or torii of IRAS 155345422, IRAS 170094154, and IRAS 184540001 have lower temperatures (100 K) than the elongated hotter (150 K) bipolar regions.
The optical depth maps of IRAS 155345422, IRAS 170094154, and IRAS 182291127 peak at similar values for each of these sources. This implies that, there are no variations in the density derived from the different filters for each of these sources, and thus that the mid-IR emission of these source is optically thin.
5.2 Comparison with the morphology and physical structure of other evolved objects
Our mid-IR VISIR-VLT images have unveiled a wealth of structural components in the four sources in our sample. In short, these sources can be described as a detached rhomboidal shell (IRAS 182291127), a spherical shell with strong evidences of a dusty torus orthogonal to an ionized bipolar flow. (IRAS 184540001), and two mild bipolar or elliptical sources (IRAS 155345422 and IRAS 170094154). Contrary to other studies of sources in the transition towards the PN phase (Sahai & Trauger 1998; Ueta et al. 2000; Sahai et al. 2007, 2011; Lagadec et al. 2011), we do not find evidence of extreme axisymmetric bipolar or multipolar morphologies. In this respect, we note that we have not imposed to the sources in our sample any of the restrictions of previous studies, that required the sources to be detected in the optical (Ueta et al. 2000; Sahai et al. 2011), or to have fluxes at 12 m greater than 10 Jy (Lagadec et al. 2011). These selection criteria may have introduced notorious biases in the morphological output of the sample.
In this sense, the lack of restrictive selection criteria in our sample may probe a different population of sources in the transition between the late AGB and early post-AGB phases. The small number of objects in our sample does not allow us to drawn firm conclusions, however, the observed morphologies may be analyzed within the evolutionary context of PN formation. At least three of the sources in our sample (IRAS 155345422, IRAS 170094154, and IRAS 184540001) have already reached the PN stage, although they are still mostly obscured at optical wavelengths. The significant obscuration can be attributed to large amounts of circumstellar material that has been previously ejected by their central stars, suggesting massive progenitors. Interestingly, the optical depth values computed for IRAS 184540001 are significantly larger than those of the remaining sources, whereas its temperature is lower. The thicker envelope of this source may be indicative of an even more massive progenitor.
If the sources in our sample indeed descended from massive AGB stars, we do not see the expected correlation between extreme bipolar morphology and massive progenitors (Corradi & Schwarz 1995; Ueta et al. 2000; Siódmiak et al. 2008). It can be argued that the sources in our sample are at a very early evolutionary phase, when asymmetries have not fully developed yet. For example, IRAS 155345422, with its dense, dusty torus and bipolar lobes, might be a bipolar PN in the making, whereas the high density torus of IRAS 184540001, enclosed within a spherical shell, can provide the seed for a bipolar PN.
The use of color maps in the mid-IR domain has revealed a torus in IRAS 071341005 (Dayal et al. 1998) and hinted the presence of jets in Roberts 22 and in V Hya (Lagadec et al. 2005). The mid-IR size of these sources (4″) are similar to that of the sources in our sample, but the variations of the temperature across the sources studied in this work have shown structures that define the morphology more clearly. Compared with these previous analyses of color and optical depth maps, our study resolves much more morphological details, specially if we note that the sources in our sample do not display extreme axisymmetric nebulosities. The high-spatial resolution achieved by our data is certainly required to resolve the extended emission of the obscured and small-sized or compact sources transiting this evolutionary phase.
6 Conclusions
We have observed four heavily obscured post-AGB sources and PN candidates with VISIR-VLT in three different N bands (PAH1, SiC and [Ne ii]), and one Q band (Q1). Three sources in our sample (IRAS 155345422, IRAS 170094154, and IRAS 184540001) can be classified as young PNe, whereas only a preliminary classification as a post-AGB source is possible for IRAS 182291127.
The high-spatial resolution VISIR images have been used to investigate the extended emission and to study the spatial variations of the physical conditions (temperature and optical depth) of these sources. We are providing evidence of asymmetry in three young PNe: an innermost dust torus or ring embedded within an ionized spherical shell (IRAS 184540001), and two mild bipolar or elliptical sources with dusty rings (IRAS 155345422 and IRAS 170094154).
Compared to previous works, the use of color and optical depth maps have proven much useful to reveal fine structural details in a small sample of heavily obscured sources reaching the PN phase, confirming the usefulness of mid-IR high resolution observations for the study of this short evolutionary phase.
Our imaging study confirms that asymmetry is present in heavily obscured post-AGB stars and young PNe but, contrary to previous studies focused in these evolutionary phases, no extreme axisymmetric morphologies are found. These previous studies may be biased towards the mid-IR and optical brightest sources, missing critical early phases of the post-AGB evolution of the most massive progenitors. Our study, although based on a small sample, may be yielding important clues on the onset of asymmetry in massive progenitors of PNe. Further studies of the most obscured post-AGB sources must be pursued in the future.
Acknowledgements.
Part of this work was supported by the Ministerio de Economía y Competitividad of Spain through grants AYA 2008-01934, AYA 2008-06189-C03-01, AYA 2011-29754-C03-02, and AYA 2011-30228-CO3-01 cofunded by FEDER funds. MWB would like to thank to the EEBB-FPI for the grant to perform the short term stay in 2011, and to the European Southern Observatory (ESO) Headquarters in Garching, Germany, for all the facilities provided during this stay. GRL acknowledges support from CONACyT (grant 177864) and PROMEP (Mexico). LFM is also supported by grant IN845B-2010/061 of Xunta de Galicia, partially funded by FEDER funds. This paper made use of information from the red MSX Source survey database at www.ast.leeds.ac.uk/RMS which was constructed with support from the Science and Technology Facilities Council of the UK. We would like to thank the referee, Dr. C. Waelkens for his useful comments for the improvement of this paper.References
- Akras & Steffen (2012) Akras, S., & Steffen, W. 2012, MNRAS, 423, 925
- Balick & Frank (2002) Balick, B., & Frank, A. 2002, ARA&A, 40, 439
- Balick et al. (1987) Balick, B., Preston, H. L., & Icke, V. 1987, AJ, 94, 1641
- Buemi et al. (2010) Buemi, C. S., Umana, G., Trigilio, C., Leto, P., & Hora, J. L. 2010, ApJ, 721, 1404
- Cohen et al. (1999) Cohen, M., Walker, R. G., & Witteborn, F. C. 1999, LPI Contributions, 969, 5
- Corradi & Schwarz (1995) Corradi, R. L. M., & Schwarz, H. E. 1995, A&A, 293, 871
- Cox et al. (2011) Cox, N. L. J., García-Hernández, D. A., García-Lario, P., & Manchado, A. 2011, AJ, 141, 111
- David et al. (1993) David, P., Le Squeren, A. M., & Sivagnanam, P. 1993, A&A, 277, 453
- Dayal et al. (1998) Dayal, A., Hoffmann, W.F., Bieging, J.H. et al. 1998,ApJ, 492, 603
- Jiménez-Esteban et al. (2006) Jiménez-Esteban, F. M., García-Lario, P., Engels, D., & Perea Calderón, J. V. 2006, A&A, 446, 773
- de Gregorio-Monsalvo et al. (2004) de Gregorio-Monsalvo, I., Gómez, Y., Anglada, G., et al. 2004, ApJ, 601, 921
- García-Lario et al. (1997) García-Lario, P., Manchado, A., Pych, W., & Pottasch, S. R. 1997, A&AS, 126, 479
- Kenyon et al. (1988) Kenyon, S. J., Fernandez-Castro, T., & Stencel, R. E. 1988, AJ, 95, 1817
- Lagadec et al. (2005) Lagadec, E., Mékarnia, D., de Freitas Pacheco, J. A., & Dougados, C. 2005, A&A, 433, 553
- Lagadec et al. (2011) Lagadec, E., Verhoelst, T., Mékarnia, D., et al. 2011, MNRAS, 417, 32
- Lagage et al. (2004) Lagage, P. O., Pel, J. W., Authier, M., et al. 2004, The Messenger, 117, 12
- Manchado et al. (2000) Manchado, A., Villaver, E., Stanghellini, L., & Guerrero, M. A. 2000, Asymmetrical Planetary Nebulae II: From Origins to Microstructures, 199, 17
- Meixner et al. (1999) Meixner, M., Ueta, T., Dayal, A., et al. 1999, ApJS, 122, 221
- Parker et al. (2012) Parker, Q. A., Cohen, M., Stupar, M., et al. 2012, arXiv:1208.4164
- Preite-Martinez (1988) Preite-Martinez, A. 1988, A&AS, 76, 317
- Ramos-Larios et al. (2009) Ramos-Larios, G., Guerrero, M. A., Suárez, O., Miranda, L. F., & Gómez, J. F. 2009, A&A, 501, 1207
- Ramos-Larios et al. (2012) Ramos-Larios, G., Guerrero, M. A., Suárez, O., Miranda, L. F., & Gómez, J. F. 2012, A&A, 545, A20
- Sahai & Trauger (1998) Sahai, R., & Trauger, J. T. 1998, AJ, 116, 1357
- Sahai et al. (2007) Sahai, R., Morris, M., Sánchez Contreras, C., & Claussen, M. 2007, AJ, 134, 2200
- Sahai et al. (2011) Sahai, R., Morris, M. R., & Villar, G. G. 2011, AJ, 141, 134
- Schwarz et al. (1993) Schwarz, H. E., Corradi, R. L. M., & Stanghellini, L. 1993, Planetary Nebulae, 155, 214
- Siódmiak et al. (2008) Siódmiak, N., Meixner, M., Ueta, T., et al. 2008, ApJ, 677, 382
- Suárez et al. (2006) Suárez, O., García-Lario, P., Manchado, A., et al. 2006, A&A, 458, 173
- Suárez et al. (2011) Suárez, O., Lagadec, E., Bendjoya, P., et al. 2011, Asymmetric Planetary Nebulae 5 conference, held in Bowness-on-Windermere, U.K., 20 - 25 June 2010, A. A. Zijlstra, F. Lykou, I. McDonald, and E. Lagadec, eds. (2011) Jodrell Bank Centre for Astrophysics
- Takahashi et al. (2000) Takahashi, H., Matsuhara, H., Watarai, H., & Matsumoto, T. 2000, ApJ, 541, 779
- Ueta et al. (2000) Ueta, T., Meixner, M., & Bobrowsky, M. 2000, ApJ, 528, 861
- Ueta et al. (2001) Ueta, T., Meixner, M., Dayal, A., et al. 2001, ApJ, 548, 1020
- Urquhart et al. (2008) Urquhart, J. S., Hoare, M. G., Lumsden, S. L., Oudmaijer, R. D., & Moore, T. J. T. 2008, Massive Star Formation: Observations Confront Theory, 387, 381
- Van de Steene et al. (2000) Van de Steene, G. C., van Hoof, P. A. M., & Wood, P. R. 2000, A&A, 362, 984
- van der Veen et al. (1989) van der Veen, W. E. C. J., Habing, H. J., & Geballe, T. R. 1989, A&A, 226, 108