Center for Polymer Studies, Boston University, Boston, Massachusetts 02215, USA
Structure and roughness of interfaces Synchronization, nonlinear dynamics Scaling phenomena in complex systems
Competition between surface relaxation and ballistic deposition models in scale free networks.
Abstract
In this paper we study the scaling behavior of the fluctuations in the steady state with the system size for a surface growth process given by the competition between the surface relaxation (SRM) and the Ballistic Deposition (BD) models on degree uncorrelated Scale Free networks (SF), characterized by a degree distribution , where is the degree of a node. It is known that the fluctuations of the SRM model above the critical dimension () scales logarithmically with on euclidean lattices. However, Pastore y Piontti et. al. [A. L. Pastore y Piontti et. al., Phys. Rev. E 76, 046117 (2007)] found that the fluctuations of the SRM model in SF networks scale logarithmically with for and as a constant for . In this letter we found that for a pure ballistic deposition model on SF networks scales as a power law with an exponent that depends on . On the other hand when both processes are in competition, we find that there is a continuous crossover between a SRM behavior and a power law behavior due to the BD model that depends on the occurrence probability of each process and the system size. Interestingly, we find that a relaxation process contaminated by any small contribution of ballistic deposition will behave, for increasing system sizes, as a pure ballistic one. Our findings could be relevant when surface relaxation mechanisms are used to synchronize processes that evolve on top of complex networks.
pacs:
68.35.Ctpacs:
05.45.Xtpacs:
89.75.DaIn the last decade the study of complex networks received much attention because many processes take place on top of these kinds of structures. Here, we consider networks with scale free (SF) topologies characterized by a degree distribution , where is the degree or number of connections that a node can have with , where and are the maximal and minimal degree respectively, and measures the heterogeneity of the distribution [1, 2]. Historically, the research on complex networks was mainly focused on how the topology affects processes that evolve on top of them, such as epidemic spreading [3], traffic flow [4, 5], cascading failures [6, 7] and synchronization [8, 9, 10]. Recently, it was shown that the scaling behavior of processes, such as synchronization and jamming [11, 12], are fully governed by the topology of the underlying network. Synchronization processes are very important in many real situations such as supply-chain networks based on electronic transactions [13], neuronal networks [14] and financial transaction between traders [15]. One of the most successful attempts to model synchronization phenomenon is to map them into a non equilibrium surface growth [10, 16] where the relevant magnitude that represents the departure from synchronization is the dispersion or fluctuations of some scalar field over the nodes of a network given by , where represents the scalar on node , is the mean value, is the system size and denotes an average over network configurations. Synchronization problems deal with the optimization of the fluctuations in the steady state, being the system optimally synchronized when those fluctuations are minimized. On the other hand a system is called scalable if their fluctuations do not depend, or depend weakly, on the system size.
Many dynamic synchronization processes can be described by simple growth models. One of the most successful models of surface growth with relaxation is the Family model [17] (SRM) that represents very well film growth either by vapor or chemical deposition. Other very important model is the Ballistic Deposition (BD) [18] that represents sedimentation processes such as low thin-film grow at low temperatures [19]. However, more complex processes cannot be described by a single growth model and are better represented as the competition between two or more simple mechanisms. The competition between models on euclidean lattices [20, 21, 22, 23] was studied by few researchers, in spite of the fact that it is more realistic in describing grow processes on real materials. Pellegrini et. al. [20] studied the competition between the SRM model with probability and the BD model with probability on euclidean lattices and found a crossover between a logarithmic and a power law behavior of the fluctuations in the steady state with that depends on for dimensions . Note that is the critical dimension of the SRM model above which the behavior of takes the mean field value, with . Pastore y Piontti et. al. [24] studied the SRM model on degree uncorrelated SF networks and found that
| (1) |
a very different scaling behavior than the one obtained on euclidean lattices above , eventhough complex networks can be thought as high dimensional systems with . These results were theoretically confirmed by La Rocca et. al. [25] who derived the evolution equation of this model on complex networks. However, up to our knowledge, neither the BD model nor the competition between different processes on complex networks was ever reported. Usually the SRM model is associated with diffusion between first neighbors of a network, such as in load balance problems in parallel processors, where the load are tasks to solve. If the load difference between processors is large, nodes with less load must wait for the more loaded nodes to finish their tasks. Thus it is logical to send all the new task to the less loaded node to prevent the desinchronization of the system. Then sending new tasks to the less loaded processors could be represented by the BD model.
In this letter we study the scaling behavior of the fluctuations in the steady state with the system size for the BD model, and the competition between the SRM and the BD models on degree uncorrelated SF networks.
In our simulations, at each time step a node is chosen with probability . Then, the SRM rules are applied with probability and the BD rules with probability . Denoting by the nearest neighbor nodes of , the evolution rules for the SRM model are
| (3) |
Meanwhile for the BD model the evolution rules are
As initial condition we choose for and the time step increases by . The SF networks with different values of were constructed using the configurational model [26].
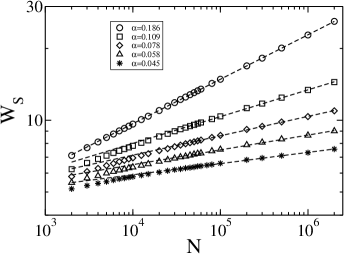
In Fig. 1 we show the fluctuations as a function of for the BD model () in log-log scale for different values of . We can see that for all the values of there exists a power law behavior denoted by the dashed lines that represent the fitting of the data with for large system sizes, where the exponent depends on . Clearly, we can observe that this behavior is very different than the one found for the SRM model on SF networks (see Eq. (1)). The power law behavior of the fluctuations in the steady state of the BD model seems to be an inherent property of the model regardless of the topology of the complex network over which the process evolves, although the exponent of the power law depends on the heterogeneity of the network. We find that as the heterogeneity of the network decreases, above , finite size effects become more relevant modifying the power law behavior found for large . Thus, we propose that
| (6) |
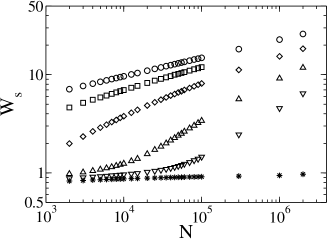
where the term is the correction to finite size scaling with and a constant. We can measure the finite size effects taking the derivative of with respect to
In Fig. 2 a) we plot as a function of up to , for two values of . The dashed lines represent the fitting with a power law from where we obtain the values of . In order to show that our proposed scaling (see Eq. (6)) is correct in Fig. 2 b) we plot as function of . We can see that for large system sizes does not depend on , but as decreases we observe a linear behavior, which shows the agreement between the proposed corrections to scaling and the simulations.
Next, we study the competition between the SRM and the BD models, i.e., the scaling behavior of with when we increase the parameter . Although the conclusions reached from the competition between the two models are qualitatively the same for all the values of , we will consider only the case because the effects found are more pronounced in this case and because for this value of finite size effects are negligible as we mention above. In Fig. 3 we plot as function of in log-log scale for different values of . We can see that for there is a pure power law with exponent (see Fig 1) and for the scaling behavior of with corresponds to a logarithm as expected for [24, 25]. For values we find that there is a crossover between both regimes. The corresponding curves become steeper as increases leading to expect that they will cross at some point. However, as the system size is increased we observe that the curves change their slope, avoiding the crossing between them. This is can be expected since the fluctuations in the competition with the SRM model, which tend to smooth out the interface via diffusion, cannot overcome the fluctuations of the pure BD model. In fact, we expect that for large sizes (), the behavior of all the curves with will tend to follow a power law with the same exponent that for the case . However from our data we cannot show our expectation even for the system sizes as big as the ones that we have achieved (). Note that each point in Figs. 1 and 3 corresponds to realizations of the networks for fix where each value of was obtained by a linear fitting on the steady state. Thus to reach bigger system sizes is very time consuming and goes beyond our computational capabilities. For this reason from the results shown until here we can only conclude that in the competition between both models, even for close to one, the BD dominates the behavior of the fluctuations.
In the competition, the BD model is responsible of generating bigger height differences (jumps) between neighboring nodes than the SRM model, which tends to smooth out the interface by diffusion (see Fig. 3). As a consequence, the big jumps that produce the BD model increase the fluctuations of the system. As increase, the number of jumps also increases and as a consequence the BD model dominates the behavior of the system, even for close to one. In order to verify our assumption we introduce the definition of “step”. Steps are landing structures with edges generated by the BD process and flat regions smoothed by the SRM process. Since represents the dispersion of the heights around their mean value, we can assume that most of the nodes of the network have a height , where is a positive integer number that determines the degree of confidence for a Gaussian distribution, i.e., correspond to of confidence and to . We verified that the distribution of heights is a Gaussian distribution for any value of . This implies that in average the absolute value of the difference of heights between any two pair of neighboring nodes is at most
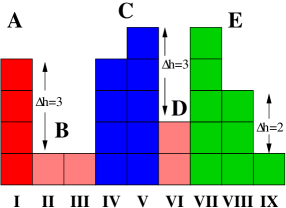
Then, if we denote the fluctuations for the pure SRM model () as , we define a step as an almost flat connected region of the interface where each pair of neighboring nodes has . Thus, computing how many steps each model generates and how this magnitude changes with , we can measure the influence of the BD process [27]. In Fig. 4 we show for a schematic plot for the particular case of a one-dimensional lattice where each step is marked with a different color and labeled by a letter. For example, the step C consist of nodes IV and V that have between them, and is limited by nodes III and VI because their height difference is greater than . Note that a step can be formed by a single node, as in the cases A and D. Thus a step is a soft region of the interface bounded by two borders represented by nodes with an abrupt jump in their height differences ().
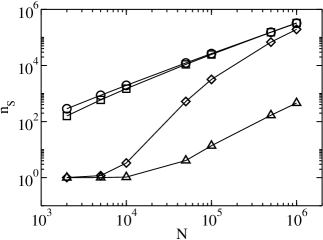
In Fig. 5 we plot in log-log scale the average number of steps as a function of for , , and , for and taking (see Fig. 3). We can see that for , is much smaller than for for all the values of . For large and the curves of try to reach the value of , which means that the BD is the dominating mechanism (see Fig. 3). Thus even for values of very close to , corresponding to pure SRM, as increases more steps appear and the BD model ends dominating the behavior of the fluctuations in the steady state. This explain the crossover behavior of with for all the values of . Thus a relaxation process driven by diffusion competing with a small contribution of the ballistic deposition will behave as a pure ballistic one for large . Then, if we are interested in reducing the fluctuations in order to improve the synchronization of the system when these two processes are competing, we must increase the diffusion and reduce the system size. Our findings could have a great impact when surface relaxation mechanisms are used to synchronize system on complex networks because a small contribution of the BD process reduces the synchronization and as a consequence the scalability of the system with the system size worsens [28].
In summary, we studied the scaling behavior of the fluctuations on the steady state for the ballistic deposition model in degree uncorrelated SF networks and found that where the exponent increases with the heterogeneity of the SF networks, i.e., as decreases. Our results suggest that the power law behavior of is an inherent property of this process found also in euclidean lattices. We also studied the scaling of with for the competition between the SRM and the BD models and found that there exists a crossover between different behaviors as we increase . For large , we found that for the values of approaches to the BD one, which means that the BD model always dominates the behavior of the fluctuations in the steady state. This was shown using the definition of step, where the average number of steps measure the influence of the BD process. We found that the crossover between the SRM and the BD corresponds to an abrupt increase in the average number of steps.
In a forthcoming work we will study analytically the BD model and the competition between the BD and the SRM models deriving the evolution equations for the heights from where we will be able to derive the scaling behavior of for all the values of .
Acknowledgements.
We thank UNMdP and FONCyT (PICT 0293/08) for financial support.References
- [1] R. Albert and A.-L. Barabási, Rev. Mod. Phys. 74, 47 (2002); S. Boccaletti, V. Latora, Y. Moreno, M. Chavez and D.-U. Hwang, Physics Report 424, 175 (2006).
- [2] As decreases the heterogeneity of the network increases due to the appearance of high degree nodes called hubs.
- [3] R. Pastor-Satorras and A. Vespignani, Phys. Rev. Lett. 86, 3200(2001).
- [4] E. López et al., Phys. Rev. Lett. 94, 248701 (2005); A. Barrat, M. Barthélemy, R. Pastor-Satorras and A. Vespignani, PNAS 101, 3747 (2004).
- [5] Z. Wu, et al., Phys. Rev. E. 71, 045101(R) (2005).
- [6] A. E. Motter, Phys. Rev. Lett 93, 098701 (2004).
- [7] S. V. Buldyrev, R. Parshani, G. Paul, H. E. Stanley and S. Havlin, Nature 464, 1025-1028 (2010).
- [8] J. Jost and M. P. Joy, Phys. Rev. E 65, 016201 (2001); X. F. Wang, Int. J. Bifurcation Chaos Appl. Sci. Eng. 12, 885 (2002); M. Barahona and L. M. Pecora, Phys. Rev. Lett. 89, 054101 (2002); S. Jalan and R. E. Amritkar, Phys. Rev. Lett. 90, 014101 (2003); T. Nishikawa et al., Phys. Rev. Lett. 91, 014101 (2003); A. E. Motter et al., Europhys. Lett. 69, 334 (2005); A. E. Motter et al., Phys. Rev. E 71, 016116 (2005).
- [9] G. Korniss, Phys. Rev. E 75, 051121 (2007).
- [10] D. Hunt, G. Korniss, and B. K. Szymanski, Phys. Rev. Let. 105, 068701 (2010).
- [11] C. E. La Rocca, L. A. Braunstein and P. A. Macri, Physica A 390, 2840-2844 (2011).
- [12] A. L. Pastore y Piontti, L. A. Braunstein and P. A. Macri, Physics Letters A 374, 4658-4663 (2010).
- [13] A. Nagurney, J. Cruz, J. Dong, and D. Zhang, Eur. J. Oper. Res. 164, 120 (2005).
- [14] Q. Wang, M. Perc, Z. Duan, and G. Chen, Phys. Rev. E 80, 026206 (2009).
- [15] S. Saavedra, K. Hagerty, and B. Uzzi, PNAS 108, 5296-5301 (2011).
- [16] G. Korniss, R. Huang, S. Sreenivasan and B. K. Szymanski, “Optimizing Synchronization, Flow, and Robustness inWeighted Complex Networks”, Handbook of Optimization in Complex Networks, Springer New York (2012) and cites in therein.
- [17] F. Family, J Phys. A 19, L441 (1986).
- [18] P. Meakin, P. Ramanlal, L. M. Sander, and R. C. Ball, Phys. Rev. A 34, 5091-5103 (1986).
- [19] P. Meakin, Fractals, Scaling and Growth Far from Equilibrium (Cambridge University Press, New York, 1998).
- [20] Y. P. Pellegrini and R. Jullien, Phys. Rev. Lett. 64, 1745 (1990); Phys. Rev. A 43, 920 (1991).
- [21] C. M. Horowitz, R. A. Monetti, and E. V. Albano, Phys. Rev. E 63, 066132 (2001); I. Irurzun, C. M. Horowitz and E. V. Albano, Phys. Rev. E. 72, 036116 (2005); C. M. Horowitz and E. V. Albano, Phys. Rev. E. 73, 031111 (2006); C. M. Horowitz and E. V. Albano, Phys. Rev. E. 81, 033102 (2010).
- [22] A. Chame and F. D. A. Aarão Reis, Phys. Rev. E 66, 051104 (2002).
- [23] D. Muraca, L. A. Braunstein, and R. C. Buceta, Phys. Rev. E 69, 065103 (R) (2004); L. A. Braunstein and Chi-Hang Lam, Phys. Rev. E 72, 026128 (2005).
- [24] A. L. Pastore y Piontti, P. A. Macri and L. A. Braunstein, Phys. Rev. E 76, 046117 (2007).
- [25] C. E. La Rocca, L. A. Braunstein and P. A. Macri, Phys. Rev. E 77, 046120 (2008).
- [26] M. Molloy and B. Reed, Random Struct. Algorithms 6, 161 (1995); Combinatorics, Probab. Comput. 7, 295 (1998).
- [27] While quantitative results depend on the value of , the qualitative results do not, since the number of steps will change depending on but the crossover between the two models will be clearly presented for any .
- [28] The results obtained for are very similar to the ones found for , although the crossover between the two behaviors now is between a constant, consequence of the SRM model for (see Eq. (1)), and a power law.