Present address: ] Universidade Tecnológica Federal do Paraná, Toledo, PR, Brazil
Microcanonical thermostatistics of coarse-grained proteins with amyloidogenic propensity
Abstract
The formation of fibrillar aggregates seems to be a common characteristic of polypeptide chains, although the observation of these aggregates may depend on appropriate experimental conditions. Partially folded intermediates seem to have an important role in the generation of protein aggregates, and a mechanism for this fibril formation considers that these intermediates also correspond to metastable states with respect to the fibrillar ones. Here, using a coarse-grained (CG) off-lattice model, we carry out a comparative analysis of the thermodynamic aspects characterizing the folding transition with respect to the propensity for aggregation of four different systems: two isoforms of the amyloid -protein, the Src SH3 domain, and the human prion proteins (hPrP). Microcanonical analysis of the data obtained from replica exchange method (REM) is conducted to evaluate the free-energy barrier and latent heat in these models. The simulations of the amyloid isoforms and Src SH3 domain indicated that the folding process described by this CG model is related to a negative specific heat, a phenomenon that can only be verified in the microcanonical ensemble in first-order phase transitions. The CG simulation of the hPrP heteropolymer yielded a continuous folding transition. The absence of a free-energy barrier and latent heat favors the presence of partially unfolded conformations, and in this context, this thermodynamic aspect could explain the reason why the hPrP heteropolymer is more aggregation-prone than the other heteropolymers considered in this study. We introduced the hydrophobic radius of gyration as an order parameter and found that it can be used to obtain reliable information about the hydrophobic packing and the transition temperatures in the folding process.
pacs:
87.15.Aa,87.14.Ee,87.15.Cc,05.70.FhI INTRODUCTION
Different diseases, including Alzheimer’s alzheimer_1 ; alzheimer_2 (AD), Parkinson’s cookson , and Huntington’s kordower ; imarisio diseases, are known to be the result of neurodegenerative processes caused by formation of fibrillar aggregates of proteins, known as proteinopathies, which occurs primarily in the cellular structures murphy ; thirumalai_146 ; takano ; chiti-review ; ventura . Because a number of proteins have been found to form fibrillar aggregates without sequence identity or structural homology under appropriate conditions in vitro, one can conclude that this is a common characteristic of polypeptide chains bucciantini ; thirumalai_146 ; chiti-review , that would reflect a property of their main backbone. Therefore, the use of detailed interatomic potentials in computational experiments employed for the thermodynamic characterization of proteins with known aggregation propensity seems to be inessential and thus, some general features can be extracted with the aid of simpler models nussinov . In particular, we followed ref. janke-L2006 and utilized a coarse-grained off-lattice model stillinger-2 in our simulations. In the simulations, the 20 naturally occurring amino acid residues are replaced with monomers whose hydrophobic-polar characters are denoted by and , respectively. Thus, our investigation of the thermodynamic features of peptide chains with known amyloidogenic propensity assumes that the nonbonded interactions are described by the hydrophobic-polar character of these monomers in all extension. The hydrophobicity of the side chains correlates with the aggregation rate dubay ; chiti-11 , so it is an important physicochemical ingredient promoting the nucleation of fibrillar aggregates. The microcanonical analysis of the heteropolymer aggregation process has been performed janke-L2006 ; liang and supports the main idea that simple models encompassing hydrophobic interactions among monomers or segments present the overall aggregation phenomenon through a temperature-driven first-order transition. A more comprehensive study on the properties of the aggregation phenomenon shows that the change in the aggregation rate depends on diverse factors, grouped into extrinsic or intrinsic factors dubay ; dobson-prone . Extrinsic factors include physicochemical properties related to the polypeptide environment. The intrinsic factors associated with amyloid formation refer to the characteristics of the polypeptide chains. Factors like hydrophobicity, propensity to form the -helical structure, propensity to form the -sheet structure, overall charge, and patterns of polar and nonpolar residues have been demonstrated to influence the aggregation rate. The propensity of globular proteins to adopt a different secondary structure content is another intrinsic factor related to the stability of the polypeptide chain. There is strong evidence that partially folded intermediates, such as for the A peptide in the case of Alzheimer’s, or with substantial unstructured conformations play an important role in the formation of amyloid fibril uversky_131 ; hamada ; neudecker ; kumita . Thus, conformational destabilization seems to be a natural requirement for polypeptide chains to achieve new arrangements even under physiological conditions, which culminates in their assembly of amyloid fibrils straub-2012 . On the other hand, unstructured or destabilized conformations do not seem to be a necessary condition to promote aggregation liemann ; soldi , although results from mutations on the amyloid -protein (A) have shown that the less stable A variants have the fastest nucleation kinetics in fibrillization ni_stability ; bitan .
Here, thermodynamic features of the amyloid -peptides (40 and 42), the Src SH3 domain, and the human prion protein (hPrP) are compared in silico. Moreover, we try to associate those features with their aggregation propensity levels. The amyloid -protein is the principal component of the amyloid plaques found in AD patients rauk_review . It is a small peptide that is predominantly constituted by 40 or 42 residues. The Src SH3 domain in turn, is a globular domain with 56 residues. Although this domain is non-pathogenic, it is expected to behave quite similarly to prion proteins during the aggregation transition. Actually, it has been experimentally shown that the SH3 domain aggregates to form amyloid fibrils ventura ; fontana . Molecular dynamics simulation of Src SH3 domains also led to aggregation conformations when the amino acid residue interactions were modeled by the Gō potential MD_SH3 . The prion protein with PDB entry 1HJM calzolai is considered in this study. A large number of observations have led to the conclusion that partial unfolding of the monomeric cellular prion protein (PrPC) seems to be necessary for the generation of the misfolded intermediates during fibrillization of the scrapie isoform PrPSc liemann ; daggett-101 ; yu-prion-2012 .
In addition, we emphasize that thermodynamic equilibrium properties are better analyzed in the microcanonical ensemble because it leads to the correct entropic characterization gross-JCP and sets a simple way of determining free-energy barriers. In fact, many systems present equilibrium properties in the microcanonical ensemble but do not have their equivalents in the canonical ensemble barre-PRL2001 ; bouchet-JSP ; costeniuc-PRE . This is a consequence of the nonconcavity of the entropy function, which produces energy-dependent equilibrium states in the microcanonical ensemble that cannot be associated with any temperature-dependent equilibrium states in the canonical ensemble. These missed states are the nonequilibrium ones in the canonical ensemble, and they generally correspond to metastable or unstable states in this ensemble touchette-PhysicaA . The most relevant feature that emerges from the nonconcavity of the entropy is the occurrence of a negative microcanonical specific heat. Hence, it is preferable to perform a microcanonical analysis so that the metastable states that may arise as a consequence of the dynamic structural conversion between the native and unfolded states can be properly accounted for. In this work, we use the replica-exchange method (REM) hukushima-REM and ST-WHAM-MUCA rizzi-st-wham-muca analysis to obtain such microcanonical results and to base our discussions on.
II MODEL AND SIMULATION ALGORITHM
To perform the simulations, the primary structure of a protein is mapped through the Roseman hydrophobicity scale roseman onto a string of elements and located at the atoms. Table 1 includes the PDB codes used in this study and the corresponding AB sequences. The interaction for chains with monomers is described by the following energy function stillinger-2 ,
| (1) |
Here, is the angle between three successive monomers, and denotes the distance between the monomers and in the chain. The coupling constant in the Lennard-Jones type potential depends on the pairwise hydrophobic details,
| (2) |
The spherical-cap algorithm janke-E2005 was used in the simulations in order to update conformations. This algorithm utilizes spherical coordinates for the generation of new positions for each monomer in the chain.
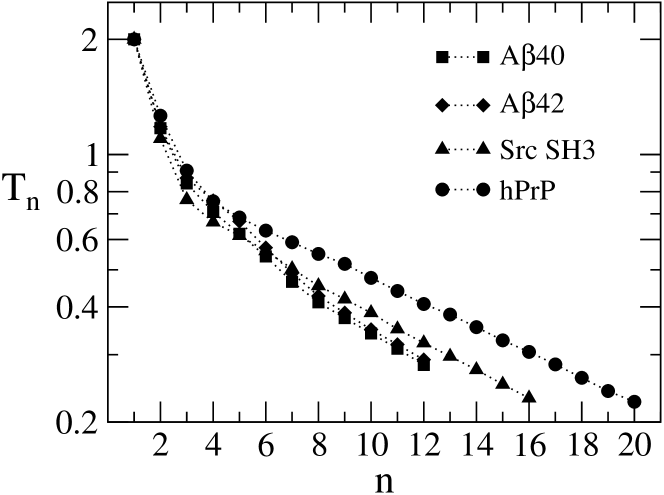
Conformations at different temperatures were obtained by REM. Figure 1 presents a log plot of the temperatures used in the replica exchange simulations for the heteropolymers A, Src SH3, and hPrP. The temperature sets were determined by the following protocol: given an initial inverse temperature , we determined the next inverse temperature by simulating only two replicas of the system with the Metropolis algorithm and the AB force field. First of all, we performed REM using sweeps and exchange conformation moves so as to equilibrate both replicas at the same reference temperature , with the Boltzmann constant . Next, the inverse temperature of one replica was increased by a small variation , and updates were performed again trying to exchange replicas after sweeps. If the fraction of accepted replica exchanges was approximately equal to a probability , this new inverse temperature was accepted as reference; otherwise, the inverse temperature was increased by once again. This procedure allowed for the recursive determination of all the temperatures. To compute , and were employed. The acceptance probability was set to for the amyloid -peptides, and for the Src SH3 domain and the hPrP protein. It has been demonstrated that these values provide a convenient number of round trips between extremal temperatures lingenheil2009 ; fiore2011 . For the all systems, evaluation of the temperature sets started at the inverse temperature , with . A simple statistics with five independent simulations was used for estimation, and thus for establishment of the set of temperatures to perform REM simulations for each heteropolymer.
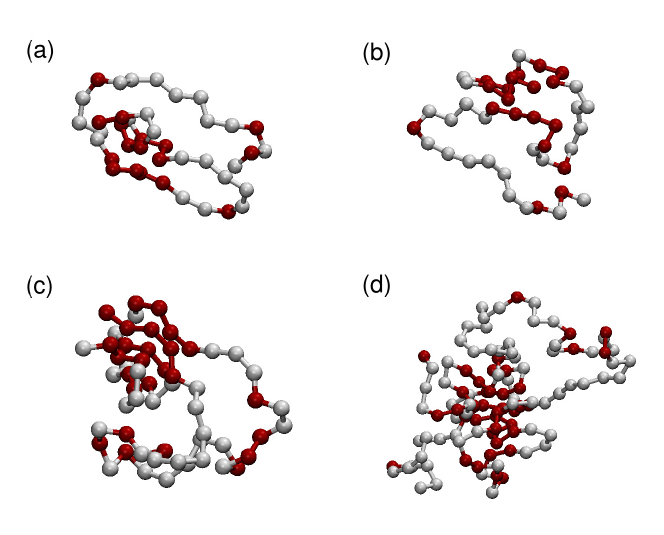
Final data production was obtained with 12 replicas for A and A, 16 replicas for Src SH3, and 20 replicas for hPrP. Simulations for data production were accomplished with sweeps and replica exchange moves, but for hPrP the number of exchange moves was doubled. Moreover, the above statistics was repeated five times, always starting from different initial conditions. Figure 2 shows conformations obtained from the AB model for the sequences in Table I, and sampled in the transition region.
Data analysis was performed using the ST-WHAM procedure, which is an iteration-free approach that solves the WHAM equations in terms of intensive variables st-wham . This procedure is a convenient way of obtaining the microcanonical inverse temperature estimates. On the basis of the assumption that the density of states can be obtained from
| (3) |
with being the energy histogram and the simulation weight, ST-WHAM states that the inverse temperature can be estimated from independent simulations (),
| (4) | |||||
| (5) |
where , , and . The sum in is over data produced by REM simulations, with the energy histograms and specified for each temperature . Thermodynamic quantities such as microcanonical entropy and specific heat are evaluated from a multicanonical entropy-like solution rizzi-st-wham-muca , the so-called ST-WHAM-MUCA procedure.
III NUMERICAL SIMULATIONS AND RESULTS
For comparative purposes, thermodynamic quantities such as the entropy, changes in the free energy , and latent heat are given as a function of the specific energy , where stands for the total number of monomers in the system. These quantities are summarized in Table 2.
Because the force field treats the hydrophobic bonding interactions as the driving force in the folding process, it is important to analyze how the hydrophobic monomers behave as a function of the temperature. In fact, a recent study has shown that, besides hydrogen bonding, hydrophobicity is a fundamental interaction in the competing processes leading to folded or misfolded proteins fitzpatrick . As we will show, the folding behavior can also be investigated by taking into account the spatial distribution of hydrophobic monomers by means of a radius of gyration restricted only to this type of monomer. It has been demonstrated that this hydrophobic radius is a suitable scoring function for discrimination between the native structure and other conformations alves-rh .
III.1 Microcanonical analysis of the A models
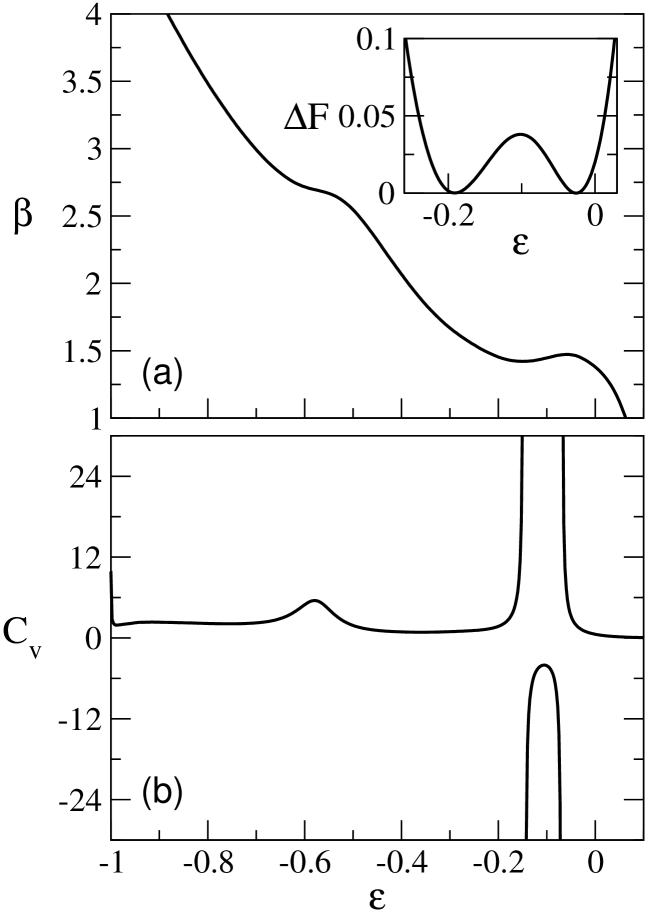
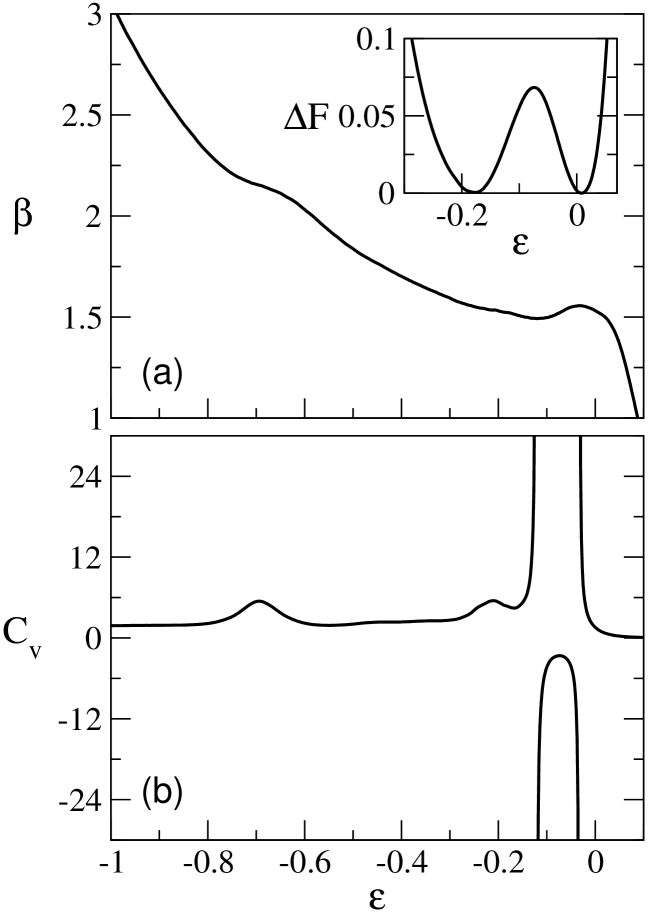
Figure 3(a) exhibits the estimates of for the A heteropolymer. The microcanonical entropy is calculated using these ST-WHAM estimates of according to the updating procedure ST-WHAM-MUCA. This entropy presents the so-called convex intruder (figure not shown) and produces a negative specific heat in the energy range , which is a signature of a first-order phase transition. Figure 3(b) depicts the behavior of . A small positive peak in is observed at , presumably due to further compaction of the heteropolymer chain. This latter transition is not related to a decrease in the microcanonical entropy with rising energy in this region. Therefore, does not present a van der Waals-like curve in Fig. 3(b), which results in a continuous phase transition at .
To evaluate the free-energy profile as the heteropolymer assumes a folded conformation characterized by a stable phase within the metastable one, we considered the change of the microcanonical entropy between these phases in the vicinity of the transition temperature . The energy region of interest is defined by the Maxwell construction in the caloric curve . This region is limited by the energies and () where the horizontal straight line of the Maxwell construction intercepts the caloric curve and identifies the inverse of the canonical first-order transition temperature , which is related to the change in the entropy,
| (6) |
The energies and define the discontinuity or the latent heat, observed in van der Waals loops. To calculate the change in the free energy and from , we defined a shifted entropy between and , , where and are such that a canonical entropy, , is defined in that energy range. The constants and are such that and . These conditions yield and , at for A40.
The corresponding change in the free energy can be estimated as
| (7) |
where is the reference free energy. Our results for are shown in the inset of Fig. 3(a). This analysis yields the free-energy barrier at the folding temperature . Latent heat is a consequence of the free-energy barrier that prevents the system from moving to a stable conformation in the new phase. Therefore, the smaller the latent heat, the higher the probability that a spontaneous fluctuation will give rise to this new phase. The estimate for the latent heat per monomer associated with this transition is .
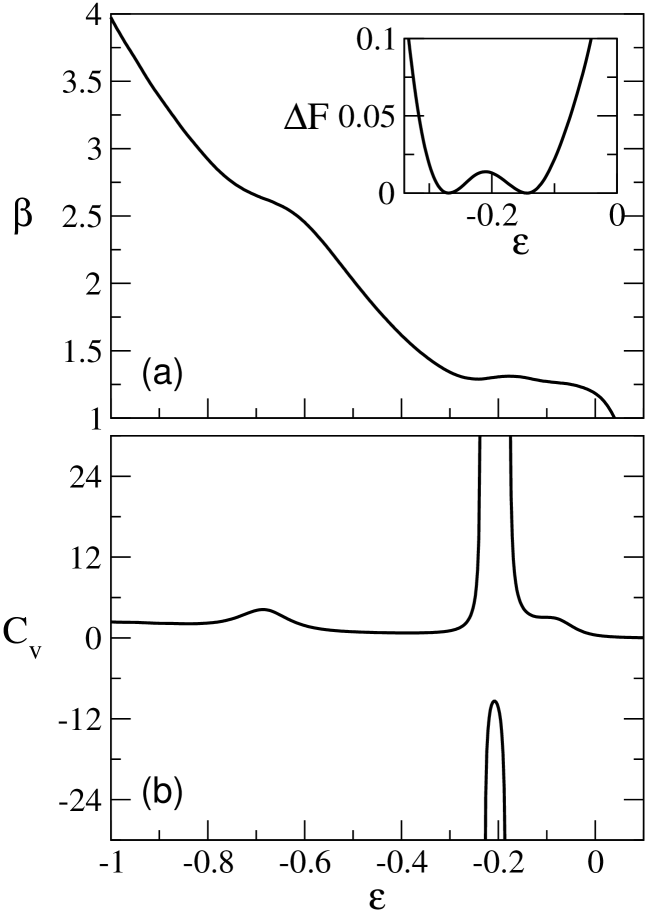
A similar analysis follows for the heteropolymer obtained with the PDB entry 1Z0Q for the A42 peptide. Results are presented in Fig. 4. However, for this heteropolymer, the caloric curve displays a less pronounced van der Waals-like behavior around as a consequence of a minor nonconcavity of the microcanonical entropy. This model yields (inset of Fig. 4(a)) and latent heat . Therefore, the free-energy barrier separating the folded and unfolded states of the heteropolymer describing A is smaller compared with the A heteropolymer. This corresponds to a less severe restriction to possible movements returning the heteropolymer to intermediate conformations, depending on how stable the folded conformations are thirumalai-Nature . A small positive peak in the specific heat at signals a continuous transition () similar to the one observed for the A heteropolymer.
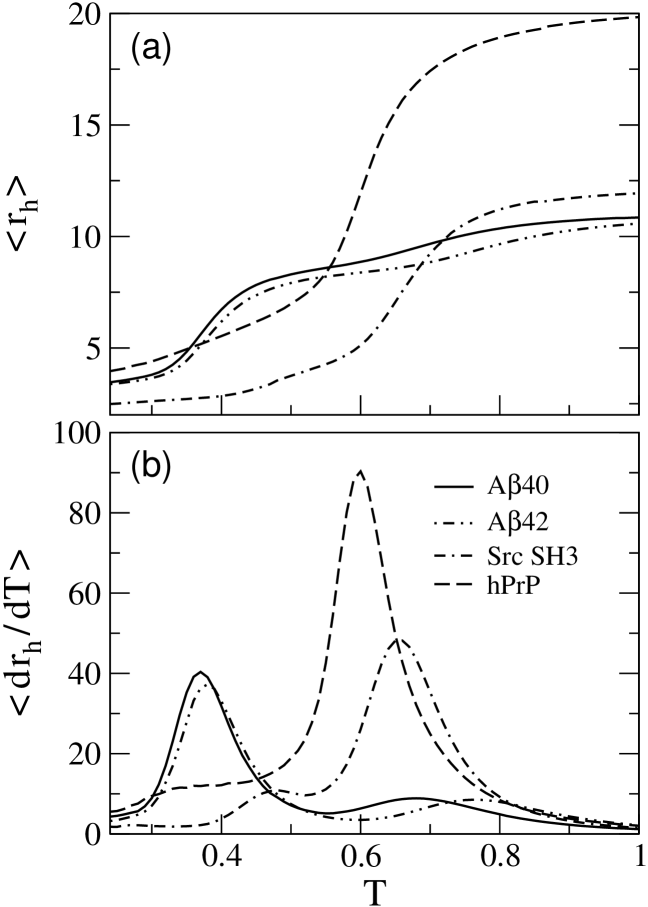
The results of the hydrophobic gyration radius for the A and A heteropolymers as a function of temperature are given in Fig. 5. The folding transition is expected to be accomplished by fast change in the spatial distribution of the monomers. In particular, this change is expected to be highly sensitive to the hydrophobic monomers, as illustrated in Fig. 5(a). Thus, we hypothesized that the temperature where the derivative hits its maximum represents the occurrence of a thermodynamic transition. These temperatures, denoted by , are easily identified in Fig. 5(b): and for A and A, respectively. These figures also identify the latter compaction transitions at temperatures and for the A and A, respectively. Estimates of are in very good agreement with the values obtained via Maxwell construction for both heteropolymers. This indicates that can be considered a reliable order parameter for depiction of a hydrophobic profile as a function of temperature. This conclusion is also supported by results attained for the Src SH3 and hPrP heteropolymers as shown in the following subsections.
III.2 Microcanonical analysis of the Src SH3 model
The SH3 domains have attracted much interest because they represent typical examples of proteins that fold via a two-state mechanism. It is largely accept that the physical process underlying protein folding in these cases is based on the nucleation-condensation scenario sh3-ding ; sh3-borreJMB ; sh3-borre ; sh3-hubner . In fact, a sharp transition at the folding temperature between the unfolded and folded states has been observed sh3-ding ; sh3-borreJMB .
Results from simulations for the Src SH3 heteropolymer obtained with the AB model are shown in Fig. 6. As expected for such peptide with a clear two-state transition mechanism, a van der Waals-like loop can be detected in the caloric curve (Fig. 6(a)). Therefore, the microcanonical specific heat presents the typical behavior observed in a first-order phase transition (Fig. 6(b)). The Maxwell construction leads to and , with . For this model, we obtained a free-energy barrier (inset in Fig. 6(a)) and a latent heat per monomer . Two small positive peaks are seen in at and . Both transitions are likely related to compactions. The behaviour of and its derivative are included in Fig. 5. The maximum of occurs at . This feature also signals the existence of a second (minor) peak in the derivative of at , which is related to the transition observed in Fig. 6(a) at .
III.3 Microcanonical analysis of the hPrP model
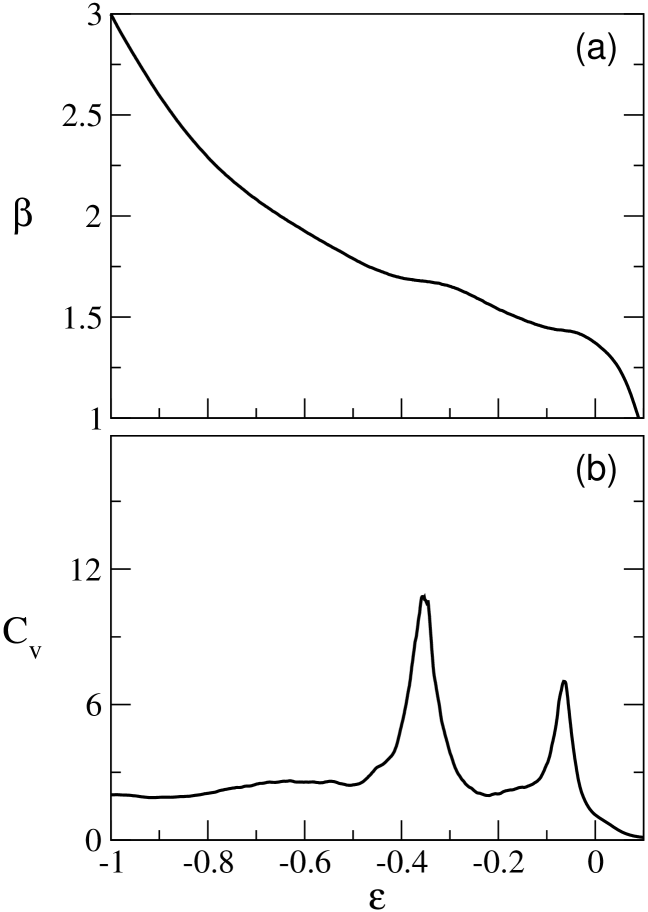
The next heteropolymer corresponds to the extracellular globular domain hPrP with 104 residues. Compared to the previous models, the numerical results do not furnish any convex intruder in . The behavior of , displayed in Fig. 7(a), does not produce a van der Waals-like curve. The microcanonical analysis yields positive specific heats associated with continuous phase transitions (Fig. 7(b)). The maxima of occur at and , which correspond to the phase transition temperatures and , respectively. The behaviour of and its derivative are also included in Fig. 5. Here, there is a clear transition at and just a tiny change in the derivative of the hydrophobic radius at .
Since our findings for this heteropolymer did not evidence a reduction in the microcanonical entropy as we moved toward the unfolded states, we may argue the following. Either the free-energy barrier separating the folded and unfolded states for this heteropolymer is not large enough to be revealed by our potential energy function because it does not contain interactions that reproduce the native contacts, or in fact the transition does not occur via a two-state mechanism. Interestingly, contradictory observations in what concerns the prion protein folding have been reported from diverse experiments. Experimental observations indicate that the native folding pathway involves the two-state process despite other evidences to the contrary (see, for example yu-prion-2012 and references therein).
IV Discussion and Conclusions
The ability of peptide chains to form fibrillar aggregates seems to follow from their propensity to aggregate under conditions that permit partial unfolding. These fibrillar structures originate from misfolded protein chains via a complex process. A mechanism for the formation of the fibrils considers that the intermediates correspond to metastable states with respect to the fibrillar states. In this sense, the existence of these aggregation-prone states can be a consequence of the low degree of stability of the native states. It has been demonstrated with a simple lattice model li-2010 that low-energy conformations populate the aggregation-prone states. Such conformations are identified in the variety of lowest energy oligomers and protofilaments obtained when multiple chains are present in the three-dimensional lattice. Here, we performed REM simulations of four biologically inspired heteropolymers to relate the thermodynamic properties with their aggregation propensities. Considering the amyloid -peptides, there is experimental evidence that the A42 is more aggregation-prone than A40 harper_1997 . Our findings for the free-energy barriers and latent heats of these heteropolymer systems, as listed in Table 2, indicate a two-state folding process. Smaller and for the A42 heteropolymer, compared with the respective values for A40, indicate that the formation of native states are facilitated for A42. On the other hand, these numerical values signal a weaker first-order transition for A42. This may give higher chances for the A42 native-like conformations to adopt partially folded intermediates under similar stability conditions. As a matter of fact, monomeric A peptides are considered to be intrinsically disordered and therefore, A42 can cross the free-energy barrier to misfold conformations more easily ni_stability .
For the Src SH3 heteropolymer, our results show a stronger first-order phase transition, confirming the two-state character expected for this system. Thus, on comparative grounds, it is reasonable to understand the experimental requirements to destabilise the native conformation liu-src-sh3 to produce some partially unfolded conformations as a prerequisite for its self-assembly.
The conflicting evidence about the mechanism of the folding process involving PrP shows how difficult the experimental measurements are yu-prion-2012 . Interestingly, our in silico experiment suggests that if there is a free-energy barrier separating the folded and unfolded states of the hPrP heteropolymer, it is not large enough to be revealed by our simple potential energy function. We argue that the absence of a free-energy barrier favors the presence of partially unfolded conformations in the hPrP heteropolymer, which could explain why it is more aggregation-prone than the other heteropolymers. Of course, our conclusions are based on a simple force field which was not designed, for example, to reproduce the native state. However, we expect that the hydrophobic force incorporates the main aspects that produce the transition-state configurations.
Because the propensity of peptides and proteins to form aggregates depends greatly on the sequence, Pawar et al. dobson-prone defined a phenomenological equation to express this feature. We calculated the intrinsic score of aggregation for our polypeptide chains at pH 7 by means of the Zyggregator algorithm zyggreg . This algorithm yielded the values presented in Table 2. Observation of the -scores reveals that the hPrP polypeptide is more aggregation-prone than the other polypeptide chains. This conclusion agrees with the thermodynamic phase transition results listed in Table 2 for these different heteropolymer systems, if we consider that weaker phase transitions facilitate the coexistence of mixed conformations.
We also computed the hydrophobic radius of gyration and as can be seen from Fig. 5, it is a convenient order parameter for identification of the folding temperatures. The agreement with the microcanonical estimates demonstrates that the spatial packing of hydrophobic monomers furnishes reliable information about the folding process. More importantly, this quantity can easily be analyzed in any protein folding study and does not depend on any other information about the protein chain like the usual reaction coordinates needing some information about native contacts.
Acknowledgments:
The authors acknowledge support by the Brazilian agencies FAPESP, CAPES, and CNPq. R.B.F. was also supported by UTFPR. This work used resources of the LCCA-Laboratory of Advanced Scientific Computation of the University of São Paulo.
References
- (1) D. J. Selkoe, Physiolog. Rev. 81, 741 (2001).
- (2) J. Hardy, and D. J. Selkoe, Science 297, 353 (2002).
- (3) M. R. Cookson, Ann. Rev. Biochem. 74, 29 (2005).
- (4) S. Ramaswamy, K. M. Shannon, and J. H. Kordower, Cell Transplantation 16, 301 (2007).
- (5) S. Imarisio, J. Carmichael, V. Korolchuk, C.-W. Chen, S. Saiki, C. Rose, G. Krishna, J. E. Davies, E. Itofi, B. R. Underwood, and D. C. Rubinsztein, Biochem. J. 412, 191 (2008).
- (6) S. Ohnishi, and K. Takano, CMLS, Cell. Molec. Life Sciences 61, 511 (2004).
- (7) F. Chiti, and C. M. Dobson, Ann. Rev. Biochem. 75, 333 (2006).
- (8) A. Espargaró, V. Castillo, N. S. De Groot, and S. Ventura, J. Mol. Biol. 378, 1116 (2008).
- (9) R. M. Murphy, Annu. Rev. Biomed. Eng. 4, 155 (2002).
- (10) D. Thirumalai, D. K. Klimov, and R. I. Dima, Curr. Opin. Struct. Biol. 13, 146 (2003). Cell 93, 337 (1998). Nature Rev. Genetics 6, 435 (2005).
- (11) M. Bucciantini, E. Giannoni, F. Chiti, F. Baroni, L. Formigli, J. Zurdo, N. Taddei, G. Ramponi, C. M. Dobson, and M. Stefan, Nature 416, 507 (2002).
- (12) B. Ma, and R. Nussinov, Curr. Opin. Chem. Biol. 10, 445 (2006).
- (13) C. Junghans, M. Bachmann, H. Arkin, and W. Janke, Phys. Rev. Lett. 97, 218103 (2006).
- (14) F. H. Stillinger, and T. Head-Gordon, Phys. Rev. E 52, 2872 (1995).
- (15) K. F. DuBay, A. P. Pawar, F. Chiti, J. Zurdo, C. M. Dobson, and M. Vendruscolo, J. Mol. Biol. 341, 1317 (2004).
- (16) M. Belli, M. Ramazzotti, and F. Chiti, EMBO reports 12, 657 (2011).
- (17) T. Chen, X. Lin, Y. Liu, T. Lu, and H. Liang, Phys. Rev. E 78, 056101 (2008).
- (18) A. P. Pawar, K. F. DuBay, J. Zurdo, F. Chiti, M. Vendruscolo, and C. M. Dobson, J. Mol. Biol. 350, 379 (2005).
- (19) V. N. Uversky, and A. L. Fink, Biochim. Biophys. Acta 1698, 131 (2004).
- (20) D. Hamada, T. Tanaka, G. G. Tartaglia, A. Pawar, M. Vendruscolo, M. Kawamura, A. Tamura, N. Tanaka, and C. M. Dobson, J. Mol. Biol. 386, 878 (2009).
- (21) P. Neudecker, P. Robustelli, A. Cavalli, P. Walsh, P. Lundström, A. Zarrine-Afsar, S. Sharpe, M. Vendruscolo, and L. E. Kay, Science 336, 362 (2012).
- (22) J. R. Kumita, L. Helmfors, J. Williams, L. M. Luheshi, L. Menzer, M. Dumoulin, D. A. Lomas, D. C. Crowther, C. M. Dobson, and A.-C. Brorsson, FASEB J. 26, 192 (2012).
- (23) J. E. Straub, and D. Thirumalai, Annu. Rev. Phys. Chem. 62, 437 (2011).
- (24) S. Liemann, and R. Glockshuber, Biochem. 38, 3258 (1999).
- (25) G. Soldi, F. Bemporad, S. Torrassa, A. Relini, M. Ramazzotti, N. Taddei, and F. Chiti, Biophys. J. 89, 4234 (2005).
- (26) C.-L. Ni, H.-P. Shi, H.-M. Yu, Y.-C. Chang, and Y.-R. Chen, FASEB J. 25, 1390 (2011).
- (27) G. Bitan, M. D. Kirkitadze, A. Lomakin, S. S. Vollers, G. B. Benedek, and D. B. Teplow, Proc. Natl. Acad. Sci. U.S.A. 100, 330 (2003).
- (28) A. Rauk, Chem. Soc. Rev. 38, 2698 (2009).
- (29) P. P. Laureto, N. Taddei, E. Frarel, C. Capanni, S. Costantini, J. Zurdo, F. Chiti, C. M. Dobson, and A. Fontana, J. Mol. Biol. 334, 129 (2003).
- (30) F. Ding, N. V. Dokholyan, S. V. Buldyrev, H. E. Stanley, and E. I. Shakhnovich, J. Mol. Biol. 324, 851 (2002).
- (31) L. Calzolai, and R. Zahn, J. Biol. Chem. 278, 35592 (2003).
- (32) M. L. DeMarco, and V. Daggett, Proc. Natl. Acad. Sci. U.S.A. 101, 2293 (2004).
- (33) H. Yu, X. Liu, K. Neupane, A. N. Gupta, A. M. Brigley, A. Solanki, I. Sosova, and M. T. Woodside, Proc. Natl. Acad. Sci. U.S.A. 109, 5283 (2012).
- (34) D. H. E. Gross, and J. F. Kenney, J. Chem. Phys. 122, 224111 (2005).
- (35) J. Barré, D. Mukamel, and S. Ruffo, Phys. Rev. Lett. 87, 030601 (2001).
- (36) F. Bouchet, and J. Barré, J. Stat. Phys. 118, 1073 (2005).
- (37) M. Costeniuc, R. S. Ellis, H. Touchette, and B. Turkington, Phys. Rev. E 73, 026105 (2006).
- (38) H. Touchette, M. Costeniuc, R.S. Ellis, and B. Turkington, Physica A 365, 132 (2006).
- (39) K. Hukushima, and K. Nemoto. J. Phys. Soc. Jap. 65 1604 (1996).
- (40) L. G. Rizzi, and N. A. Alves, J. Chem. Phys. 135, 141101 (2011).
- (41) M.A. Roseman, J. Mol. Biol. 200, 513 (1988).
- (42) M. Bachmann, H. Arkin, and W. Janke, Phys. Rev. E 71, 031906 (2005).
- (43) M. Lingenheil, R. Denschlag, G. Mathias, and P. Tavan, Chem. Phys. Lett. 478, 80 (2009).
- (44) C. E. Fiore, J. Chem. Phys. 135, 114107 (2011).
- (45) J. Kim, T. Keyes, and J. E. Straub, J. Chem. Phys. 135, 061103 (2011).
- (46) A. W. Fitzpatrick, T. P. J. Knowles, C. A. Waudby, M. Vendruscolo, and C. M. Dobson, PLoS Comput. Biol. 7, e1002169 (2011).
- (47) N. A. Alves, V. Aleksenko, and U. H. E. Hansmann, J. Phys.: Condens. Matt. 17, S1595 (2005).
- (48) D. Thirumalai, and G. Reddy, Nature Chem. 3, 910 (2011).
- (49) F. Ding, N. V. Dokholyan, S. V. Buldyrev, H. E. Stanley, and E. I. Shakhnovich, Biophys. J. 83, 3525 (2002).
- (50) J. M. Borreguero, N. V. Dokholyan, S. V. Buldyrev, E. I. Shakhnovich, and H. E. Stanley, J. Mol. Biol. 318, 863 (2002).
- (51) J. M. Borreguero, F. Ding, S. V. Buldyrev, H. E. Stanley, and N. V. Dokholyany, Biophys. J. 87, 521 (2004).
- (52) I. A. Hubner, K. A. Edmonds, and E. I. Shakhnovich, J. Mol. Biol. 349, 424 (2005).
- (53) J. D. Harper, and P. T. Lansbury, Annu. Rev. Biochem. 66, 385 (1997).
- (54) Z. Liu, G. Reddy, and D. Thirumalai, J. Phys. Chem. B 116 6707 (2012).
- (55) M. S. Li, N. T. Co, G. Reddy, C.-K. Hu, J. E. Straub, and D. Thirumalai, Phys. Rev. Lett. 105, 218101 (2010).
- (56) The intrinsic aggregation propensity score algorithm is available at http://www-vendruscolo.ch.cam.ac.uk/zyggregator.php.
| Protein | PDB code | Residues | Sequence |
|---|---|---|---|
| amyloid | 2LFM | 40 | BABAB BBBBB BABBB BAAAA ABBAB BBBBA AABAA ABBAA |
| amyloid | 1Z0Q | 42 | BABAB BBBBB BABBB BAAAA ABBAB BBBBA AABAA ABBAA AA |
| Src SH3 | 1NLO | 56 | AAAAA BBBBB BABAB ABABB BBBAB AABBA BBBAA AABBA AABBA BBAAB |
| BBAAA B | |||
| prion protein | 1HJM | 104 | ABBBA ABBAA BBAAA BABBB BBBBB BBBBA BBBAB BABBB AABBB BBBBB |
| AABBA ABAAA BBBAA AAAAB BBBAA BABAB AABBA ABBAA AABBB BBBBA | |||
| BBBB |
| Model | score zyggreg | ||||
|---|---|---|---|---|---|
| A40 | 0.692(1) | 0.038(2) | 0.165(3) | 0.68(1) | 0.90 |
| A42 | 0.769(1) | 0.014(1) | 0.125(2) | 0.76(1) | 0.94 |
| Src SH3 | 0.658(1) | 0.068(2) | 0.190(8) | 0.66(1) | 0.96 |
| hPrP | 0.596(2) | 0.60(1) | 1.14 |